/·;'outh East Asian Studies, VoL 15, No.4, l\Iarch 1978
On Statistical Tsunami Risk of the Philippines
Shigehisa NAKAMURA
*
I Introduction
Philippines are on the Circum-Pacific Earthquake Zone, so that they have suffered from the earthquakes and tsunamis for many times repeatedly. The latest example is the earthquake and tsunami at the south of Mindanao Island in August 1976. The suffers caused by the earthquakes and tsunamis have been compiled and analyzed to develop an effective countermeasure against the destructions. The reference for the countermeasure is the compiled data as a chronological records. Adding to that, the earthquakes and tsunamis have been understood as one of the significant geophysical phenomena and studied by a dynamical analysis. And the fruitful results of the research seems yet not fully utilized in the prediction and countermeasure against the risk of the earthquakes and tsunamis. In this article, the tsunamis in Philippines are analyzed statistically to obtain basic data for the prediction and countermeasure against the next occurrence. At first, the compiled data of the tsunamis in Philippines are rearranged to tabulate chronological tsunami tables for the localities and to reduce the local return period of the tsunami occurrences. And, the tsunami occurrences are assumed as a Poisson process which is a special case of stochastic processes through the analysis to obtain the local probabilities of the wave height exceeding the given height during the given time interval for any locality. Referring to the statistical result of the tsunami risk, countermeasures and recommendations may be offered effectively to the protection of the coast in Philippines.
II Compiled data of tsunamis in Philippines
The data of the earthquakes in Philippines have been presented by Min5za et a1.
(1960Y), Repetti (1946)2) and Damasco (1969)3). As for the tsunamis in Philippines, we
have only two catalogs edited by Iida et a1. (1967)4) and Soloviev and Gao (1970)5). The catalog 1967 is a chronological table of the tsunamis observed in the world with a remark to the loc~lities. And the catalog 1970 is classifying the tsunamis in each nationality and tabulated in a local chronological table with a digest of the documents. Soloviev and Gao ga ve a chronologicaI table of the tsunamis for each of the si x local districts in Philippines: northeastern Philippines, northwestern Philippines, central Philippines, eastern Philippines,
}fn~7 :/ 71iWfE 15B4f}
Table 1 Chronologica I catalogs of local tsunamis In Philippines.
Locality No. Date Location Depth M Reli-ability m 101 1735 2-27 Baler PX 1 1/2 Eastern 1021O;~ 1880 7-18 15 N, 121. 5E 100km 7 1/2 PX 0 19tH 9-10 Lamon Bay 7 PX 0 Luzon 104 1937 8-20 11l.5N, 121. 5E 7 1/2 LX 1 105 191\9 9-05 17. ON, 121. OE tlO 6 E -4 106 1949 12-29 17. ON, 121. OE 80 7 1/2 D 1 107 1968 tI-02 19.5N,122.2E 36 7 1/4 S 201 1627 9- Bangui 8 ? L 3 1/2 Western 202 1645 11-30 NW Luzon 8 ? D 203 1872 1-26 16. ON, 119.0E 6 ? L 1 1/2 Luzon 204 1915 11-18 18.0N, 119.5E 6 1/2 PX 1/2 205 1924 5-07 16. ON, 119. OE () 1/2 S 1 1/2 206 1934 2-14 17.4N,119.3E 7 1/2 S 1/2 301 1677 12-07 14. 5N, 120. 5E P 1 302 171\4 N Luzon PX 1 Near 303 1770 12- Manila DX 0 304 1824 10-26 14.3N, 121. 3E DX 1 Manila 305 1828 11-09 Manila 7 1/2 D 1/2 306 1880 1-18 Manila E 307 1852 9-16 14. ON, 120.5E 7 1/2 PX 1 1/2 308 1862 3-04 Manila 6 PX 1/2 309 1863 6-0:3 14.5N, 121. OE 6 1/2 P 1 401 165360r7- NE Mindoro D 1 402 1675 3- Pola, Mindoro P 1 403 1747 SE Luzon DX 404 1840 2-22 Sorsogon, Luzon 6 172 D 1 405 1865 10-19 B.3N, 123.5E 6 PX 0 406 1869 8-16 12.5N, 12:t 5E 7 PX 0 Central 407 1887 2-02 Panai D 408 1889 5-26 B.5N, 121. OE 6 3/4 L -3 Philippines 409 1905 12-08 11. ON, 12:1.5E 6 1/2 DX 0 410 1922 2-28 10.2N, 124. IE 6 1/4 P a 411 1922 3-01 9. ON, 123.3E 6 PX 1/2 412 1925 5-05 9.3N, 122.7E 6 3/4 PX 1/2 413 1925 5-25 12.2N, 122. IE 6-1/4 PX 1/2 414 1925 11-13 1:1. ON, 125.0E 7 1/4 PX 1/2 415 1928 6-15 12.4N, 120.9E 7.0 X 1/2 416 1939 5-07 B. 5N, 121. 3E 110 6 1/2 DX 1/2 417 1948 1-25 1O.9N, 122. IE tI 1/4 L 1 501 1897 9-21 6. ON, 122.0E 3.6 D 1 502 1897 9-21 6. tiN, 121. 5E 8 1/2 S 2 1/2 Southern 50:3 1902 8-21 7.5N, 123.5E 7 1/4 D 504 1917 1-31 5. 5N, 125. OE LX 0 Mindanao 505 1918 8-15 5.5N, 124.5E 8 1/4 S 2 1/2 506 1923 3-0:3 6.5N, 124. OE 7 1/4 LX 1/2 507 1928 12-19 7. ON, 124.0E 7 1/4 L 1 508 1976 8-16 6.8N, 123.4E 7.8 S (14 ft) 601 1910 12-30 9. ON, 125.5E 80 6 1/4 DX 1 602 1911 7-12 9. ON, 126. OE 50 7 3/4 DX Eastern 603604 19211923 11-127-13 8. ON, 127.0E9.5N, 127.0E 7 1/25 1/2 LXDX 11 Mindanao 605 1924 4-15 6.5N, 126.5E 8 1/4 P 1/2
606 1924 8-30 8.5N, 126.5E 7 1/4 PX 1/2 607 1929 6-13 8.5N, 127.0E 7 1/4 P 1/2 608 1932 3-19 9.5N, 127.3E 7 :1/4 S
609 1972 12-04 6.5N, 126.6E 40 7.6 S -1 In the column of 'reliability' S, L, P, D and E denote sure, likely, probable, doubtful and erroneous respectively. Notation X indicates that the tsunami IS registered 10 Catalog 1970 but
S. NAKAMURA: On Statistical Tsunami Risk of the Philippines
southern Philippines and western Philippines.
The author rearranged the table presented by Soloviev and Gao as shown in Table 1 and Fig. 1 in order to have a rational consideration of the localities and to ease the statistical analyses. Another six districts are introduced by the author, i. e., i eastern Luzon, ii western Luzon, iii near Manila, iv central Philippines, v southern l'vlindanao and vi eastern Mindanao. The formation of the columns in the table (Table 1) is prepared after that presented by Soloviev and Gao. The maximum tsunami heights are estimated referring to the categories of tsunami intensity by Soloviev (1970)6). And it seems that mFlny additional and miscellaneous data are included in the catalog 1970 in comparing to the preliminary catalog 1967. Some of the same tsunamis was registered and dated differently in the two catalogs. In Table 1, the latest and recent data are added, i. e., one in 1972 from the record by Osaka Regional Meteorological Observatory and one in 1976 from the report by P AGASA (1976)7). In the statistical analyses of the local tsunami risks, reliability of the data is taken into consideration to exclude erroneous and doubtful terms in the local chro-nological table of the tsunamis.
III Statistical model of tsunami occurrences In this article, the tsunamis caused by the earthquakes are treated.
As a prevailed concept, the tsunamis have been accepted as the accompanied phenomena with the earthquakes. Recent statistical studies have shown that the tsunami occurrence can be analyzed as a Poisson process similar to the earthquake occurrence (Newmark and Rosenblueth, 1971)8).
When the frequency of the tsunamis exceeding the wave height H is itCH), then, the mean time interval to appear the tsunamis exceeding the wave height l-Iis
T(H)= 11,1(l-I) (1)
where T(H) is defined as 'return period '. Ifwe can find T(H) or "J(ll) by any
process-ing of the data, a probabilityP can be obtained for the case that the maximum wave height Y exceeds H at once at least during the time interval t. If the tsunamis are analyzed as a Poisson process,
P=I-exp(-tIT(H))=I-exp(-A(H)· t) (2)
Wiegel (1970)9) had shown the linear relations between H and the logarithm of A(H) for the tsunamis at Hilo in Hawaii, San Francisco and Crescent City in California. That is
(3) where Jo=1(Ho), (j is a constant, l-Iois the smallest value of the maximum wave height
II in the statistical and reliable tsunami data.
Rascon and Villareal (1975)10) considered that the relation shown by Wiegel as men-tioned above can be found on the coast of Mexico facing Pacific Ocean ad analyzed to apply Bayes' theorem in order to refine the statististical analyses. Although this refinement does
not include any dynamical or physical consideration. Now, the author introduce a result of the statistical analyses by the use of the above three relations under some suitable assumptions.
IV Return period of tsunami occurrence
The return period of tsunami occurrence for each local blocks (Fig. 1) are analyzed, though the available samples are not necessarily sufficient as a statistical sample ensemble. 4. 1 Eastern Luzon
The tsunami occurrences were 5 times during 243 years from 1935 to 1977. In the table, some ambiguity in reliability was checked to assure the estimated tsunami height, for example, 1m. The result of the analyses is shown in Fig. 2. In this case, the obtained constants are
10=0.0206, p=O. 747,110=0.9 (4)
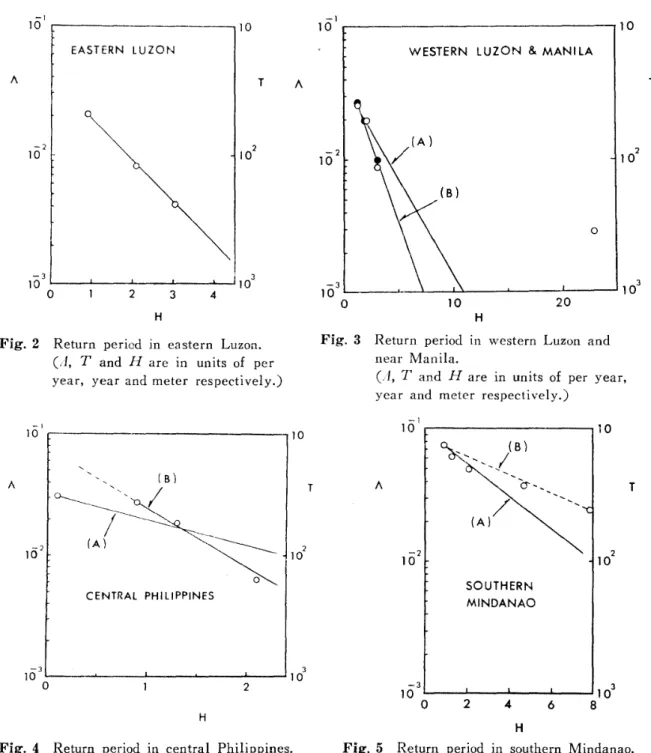
4. 2 Western Luzon and near Manila
The two districts, western Luzon and near Manila, are considered to analyze. In the table, the estimate of the tsunami in 1627 is surely little reliability as the statistical data. Ifthat is reliable, we have to understand so as that the amomarous tsunami which might scarecely occur appeared in the finite time interval of 351 years from 1627 to 1977. Ifthe time interval is taken to be longenough
- - , - - - , - - - . , - - - r - - . . , - ,
Fig. 1 Zoning of the coastal areas in Philippines.
statistically, of cause, the enormous tsunami, such as that in 1627, is scarecely expected to be observed.
In Fig. 3, the result (A) from the data for 351 years (1627-1977) and the result (B) from the data for 301 years (1677-1977) are shown.
As for the curve (A),
10=0.0256, p=O. 336, Ho=1. 3 (5)
As for the curve (B),
/10= O. 0266,
f3
= O. 454, Ho=1. 3 ( 6 )4. 3 Central Philippines
The tsunamis in the central part of Philippines had been observed 10 times during 325 years (1653--1977). In Table 1, the tsunami intensity in 1889 is anomarously small. \Ve now have to understand that the other tsumln1is of the anomarously small intensity should be excluded through the compilation or should be not registered as the tsunamis. This might be likely when the registered earthquake occurrences are considered to be similar to
S.NAKAl\HlHA: On Statistical Tsunami Risk of the Philippines EASTERN lUZO~~ 101. . . . - - - , 1 0 T o 20 10 _L-_~_ _._... .L_ ____' 103
WESTERN LUZON & MANILA
-3 10
o
-2 10 A T 4 - - - , 1 0 3 2 - ! 10 r - - - ' -2 10 . H HFig. 2 Return pericd in eastern Luzon.
(/1, T and H are in units of per
year, year and meter respectively.)
Fig. 3 Return period in western Luzon and near Manila.
(.1, T and H are in units of per year, year and meter respectively.)
- ] 10 r - ' - - - . 1 0 -·1 10 . . . - - - . . , 10 A -2 10 A -2 10 SOUTHERN MINDANAO 2 10 T 2 - ] 3 10 '--_ _"--_ _..1--_ _"""--_ _- ' - - _ - - '10 o H
Fig. 4 Return period in central Philippines.
(A, Tand H are in units of per year, year and meter respectively.)
H
Fig. 5 Return period in southern Mindanao.
(.1, T and II are in units of per year, year and meter respectively.)
the tsunami occurrences are. vVith these considerations, the result (A) including and the Result (B) excluding the data in 1889 are shown in Fig. 4.
As for the curve (A),
,/ 0=0.0308,13=0.454, Ilo=--=O.l (7)
As for the curve (B),
T 2 10 10 o 20 PHILIPINES 10 H -3 3 10 1---"'---..-.--'--'-'---...1.----110 o -2 10 T 2 H o EASTERN MINDANAO o - 2 2 10 '--_ _-'-_ _.-J...._ _--'- " ' - - _ - - - - '10
Fig. 6 Return period in eastern Mindanao. (A, T and H are in units of per year, year and meter respectively.)
-1
10 . - - - . . 1 0
A
Fig. 7 Return period in Philippines.
(A, T and H are in units of per year, Six times observed the tsunamis during year and meter respectively.)
81 years (1897-1977). The intensity of the three tsunamis in the above six are equal to 2 If the curve (B) in Fig. 4 is assumed
to be actual, it might be possible to count out the whole tsunami occurrences of the small intensity.
4. 4 Southern Mindanao
H
Fig. 8 Statistical tsunami risk in eastern Luzon. Curves A, B, C, D, E and F are for T =500, 200, 100, 50, 2;:; and 10 years respectively.
(P and H are exceeding occurrence probability and wave height in meter.) or exceeding 2. 15 10 5 WESTERN LUZON & MANILA -1 10 P -2 10 H
Fig. 9 Statistical tsunami risk in western Luzon and near Manila. Curves A, B, C, D, E and F are for T =500,200, 100, 50,25 and 10 year's respectively. (P and H are exceeding occurrence probability and wave height in meter.)
10 EASTERN LUZON 5 -1 10 -2 10 -3 10 ' - -...- - - ' - - - - ' - - - ' o p
(9)
s.
NAKAMURA: On Statistical Tsunami l~isk of the PhilippinesThe constants in (3) are obtained as follows (A) :
/10=9.974, p=O. 283, Flo=O. 9
The trend of this is shown by the curve (A) in Fig. 5.
Now, we have to remind that the recent records of the tsunamis are more reliable than the old documents of the ancient tsunamis. This might support that the effective appre-ciation might be in an envelope as shown for example by the curve (B) in Fig. 5, i. e.,
/10=0.074, p=0.157, Ho=O. 9 (10)
4. 5 Eastern Mindanao
In this district, five tsunamis were observed during 68 years (1910-1977). The result of the analysis is shown in Fig. 6. And the constants are
/10=0.0735, p=O. 598, Ho=O. 4 (11)
4. 6 Philippines
The analyses are carried out the cases including and excluding the data in 1627, i. e., as for the case including 1627, the curve (A) is obtained as shown in Fig. 7 and the con-stants are
,10=0.0997,/3=0.280, Ilo=O. 1 (12)
and as for the case excluding 1627, the curve (B) is obtained and the constants are
/10=0.1046, p=O. 336,110=0.1
V Risk of local tsunami
(13)
When the probability of the tsunami occurrence is assumed to be an indicator of the risk caused by the tsunamis, we may predict the risk by the use of the probability.
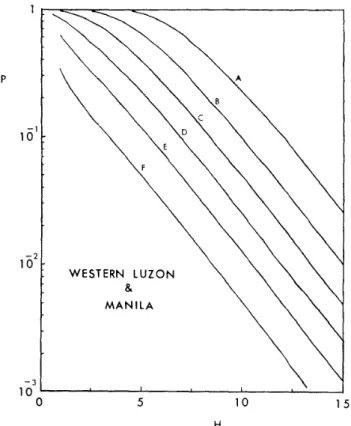
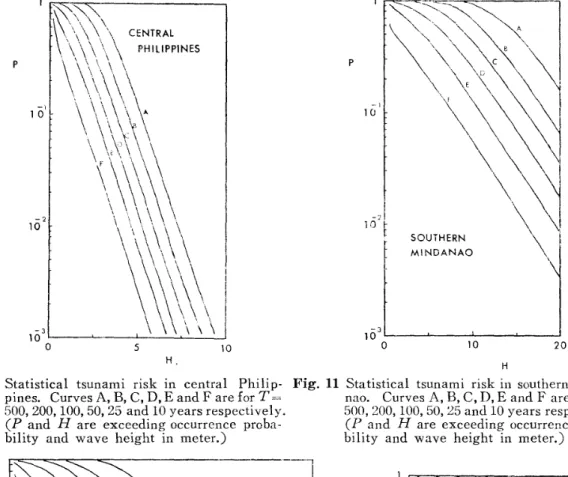
The constants (4) to (13) for (2) characterize each local district respectively. Using these constants, the probability of the tsunami occurrences is reduced to show curves as in Figs. 8 to 13 for each local district respectively. And the remarks are that the curves in Fig. 10 are reduced by using the curve (B) in Fig. 4 and the curves in Fig. 11 are obtained by the curve (B) in Fig. 5.
As for the whole area of Philippines, the curves are reduced as shown in Fig. 13, which predicts that a tsunami exceeding 10m of the maximum wave height once in 100 years at anywhere in Philippines is expected to occur in probability about 0.3. And that, the pro-bability is 0.4 to be expected a tsunami once in 25 years exceeding 5m of the maximum wave height.
With a comparison of the local tsunami occurrence probabilities for the six districts for a given time interval, the most probabl district of threatening to suffer from a tsunami is the southern Mindanao. And the districts of the eastern Mindanao, the western Luzon and near Manila are followed.
To help an understanding to the local tsunami risk, how high is the maXImum wave height expected once in 10 years in probability 1/10, is read out of Figs. 8 to 13 to tabulate
20 H 10
'~~~~
1
\~
SOUTHERN \ \ , ' MINDANAO \ -1 10 p -2lOt
-3 10 ' - - - ' - - - ' - - - -...- - - ' o -1 1CJ p HPig. 11 Statistical tsunami risk in southern Minda-nao. Curves A, B, C, D, E and F are for T=
500,200,100,50,25 and 10 years respectively. (P and H are exceeding occurrence proba-bility and wave height in meter.)
15
Fig. 13 Statistical tsunami risk in Philippines. Curves A, B, C, D, E and F are for T = SOO, 200, 100, 50, 25 and 10 years respectively. (P and H are exceeding occurrence proba-bility and wave height in meter.)
10 10 H. 5 5 p -3 10 ' - - - ' - - - ' - - - -....- - - ' ' - - - ' - - - '
o
-2 10 EASTERN MINDANAO -1 10 p HPig. 12 Statistical tsunami risk in eastern Mindanao. Curves A, B, C, D, E and F arc for Tee 500, 200, 100, 50, 2.') and 10 years respectively. (P and H are exceeding occurrence proba-bility and wave height in meter.)
Pig. 10 Statistical tsunami risk in central Philip-pines. Curves A, B, C, D, E and F are forT =
500,200,100,50,25 and 10 years respectively.
(P and H are exceeding occurrence proba-bility and wave height in meter.)
S.NAKAMURA: On Statistical Tsunami Risk of the Philippines
Table 2 Maximum tsunami height expected to occur once In
10 years in probability 1/10.
Locality
Eastern Luzon
Western Luzon and near Manila Central Philippines Southern Mindanao Eastern Mindanao Philippines Expected maximum wave height 108m 3.3m 107m 7.8m 3.6m G.8m
Table 3 Probability of the maximum tsunami height exceeding 2m to occur once in 10 years.
Locality
Eastern Luzon
Western Luzon and near Manila Cetral Philippines Southern Mindanao Eastern Mindanao Philippines Probability 0.087 0.17 0.077 0.42 0.24 0.43
the prediction as in Table 2. This table shows that the tsunami risk in the southern Mindanao is the most remarkable than that in the other districts and is almost same to the tsunami risk in the whole area of Philippines. That is, in other words, the southern Mindanao will have possibly often experiences of tsunamis in Philippines. This result might be reduced also by Table 3, which shows that the local probabilities of the tsunami occurrence once in 10 years exceeding 2m of the maximum wave height.
Conclusions
A statistical analysis of the local tsunami occurrences is carried out with an assumption that the tsunamis occur as a Poisson process. The obtained results are useful to predict the probability of the wave height exceeding the given height during the given time interval .at any locality in Philippines.
References
1) Minoza, W. A., Ocampo, A. T. and Bellosilli, S., 1960: Significant Philippine Earthquakes
1949-1959, Philippine ·Weather Bureau Scientific Paper 101.
2) Repetti, W.
c.,
1946: Catalogue of Philippine Earthquakes 1589-1899, Bull Seis. Society of America, 36.~~) Damasco, Z. ]., 1969: Seismicity of the Philippines 1897-1967, Individual Study Report, Bull. of IlSEE, Vol. 6, 1970.
4) !ida, K., Cox, D. and Pararas-Carayannis, G., 1967: Preliminary Catalogs of Tsunamis in the Pacific, Hawaii Inst. Geophys., University of Hawaii, HIG-67-10 Data Report No.5, a200pp.
5) Soloviev, S. L. and Gao, Ch. N., 1970:Catalogs of Tsunamis in the Western Pacific Ocean, Izdat.
Nauka, Moscow.
6) Soloviev, S. L., 1970: Recurrence of Tsunami in the Pacific, Tsunamis tn the Pacific Ocean,
edited by W. M. Adams, East-West Center Press, Honolulu.
7) Kintanar, R. L., 1976: Preliminary Report on the A10ro Gulf Earthquake of August 17, 1976,
National Geophys. Astr. Service, PAGASA.
8) Newmark, N. M. and E. Rosenblueth, 1971: Fundamentals of Earthquake Engineering, Prentice
Hall Inc., Englewood Cliffs, N. J,
9) Wiegel, R. L., 1970: Earthquake Engineering, Prentice Hall Inc., Englewood Cliffs, N. J, 10) Rascon, O. A. and A. G. Villareal, 1975: On a Stochastic Model to Estimate Tsunami Risk,
Jour. Hydraulic Res., Vol. 13, No.4.
11) ITIC, 1976: Severe Earthquake and Tsunami Hit the Philippines, August 16, 1976, ITIC News-letter, Vol. 9, No.3.