NUE Journal of International Educational Cooperation, Volume 14, 1-12, 2020
Study Note
1. Introduction
The current biggest issue in mathematics education in El Salvador has been addressed by the Ministry of Education of El Salvador (MoE) in conjunction with the Japanese International Cooperation Agency (JICA) under the Project of Improvement of Mathematics Learning in Elementary and Secondary (ESMATE or El Salvador Matemática) (MoE, 2020a). ESMATE has become a policy as a consequence of the follow up to the project and its higher goal of improving the academic performance in mathematics of students from elementary to
secondary school in El Salvador (MoE, 2020a; Mejía & Ishizaka, 2019; ESMATE, 2020a; ESMATE, 2020b; MoE, 2020b)2. A short-term effectiveness in students
learning outcomes was evidenced during the first and second term of implementation in 2018 and 2019 (MoE, 2020a; Maruyama & Kurosaki, 2020).
At this point, despite the short-term success shown in MoE (2020a)3, it is considered that the
ESMATE intervention is still not sufficient to solve issues like the “learning crisis” happening in El Salvador, understanding “learning crisis” as the fact that most students in elementary school do not have mathematic comprehension of the previous grades
Diagnostic Analysis of the Mathematics Lessons Considering the Influence
of Teaching Style and Lesson Plan Adherence in the New Textbooks
Implementation in El Salvador
Francisco Antonio MEJÍA RAMOS1, Hiroki ISHIZAKA
Naruto University of Education
Abstract
The performance of students’ mathematic skills in El Salvador is likely to have improved since the recent intervention of textbooks in 2018. Few previous studies have addressed this intervention in El Salvador, but researches at classroom level have not been carried out yet. The present article attempts to determine whether or not a difference exists in the students’ learning achievements between a class carried out with the textbook and workbook, and a class carried out without them by using a controlled trial pre and post test. Furthermore, it presumes to understand the teaching style that might explain the difference between both groups by using video recording analysis. The findings rise the importance of the lesson plan adherence and teaching style, since the non-material-based lessons showed a better learning achievement level than the material-based lessons.
Keywords: El Salvador, ESMATE, mathematics textbooks, teaching style, lesson plan adherence.
1 Contact can be through e-mail: [email protected]
2 Some of the references of ESMATE are websites and their contents are Spanish language based
3 English language-based information about this can be found in https://proyectoesmate.files.wordpress.com/2019/05/
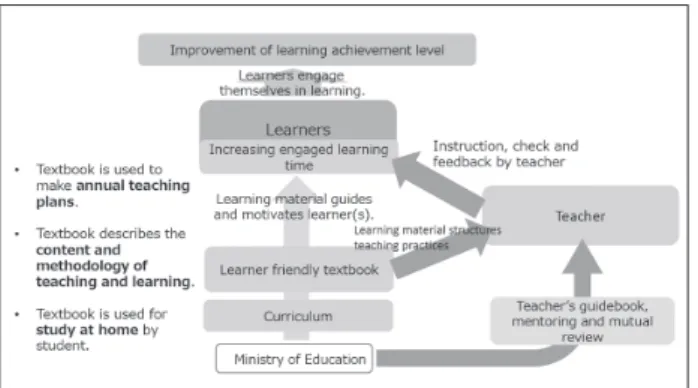
contents supposed in the curriculum at the beginning of the academic year (MoE, 2020a). The research from Maruyama & Kurosaki (2020) raises the effectiveness of the ESMATE framework (see Figure 1) in order to overcome this learning crisis and highlight some factors affecting like the timely distribution of the textbook and workbook, the checking of workbook by teachers, and some other basically related to the curriculum materials and school management. But, specifically talking about the learning crisis, there are no reasons posed by Maruyama & Kurosaki explaining why students cannot overcome this learning crisis and how it can be overcome at the classroom level. From the authors’ experience in ESMATE implementation, it is likely to believe that implementation issues might be happening in the instruction, check of work and feedback by teacher or the teaching practices showed in Figure 1, but this is not evidence-based finding and it is still not very concrete. Due to this, a classroom level research is necessary in order to clarify which specific issues are happening in mathematics lesson with textbook implementation.
This paper attempts to understand some implementation issues of ESMATE at the classroom level as it relates to different conditions of use for the curriculum materials. Findings in this research are expected to be used for planning a concrete improvement proposal in future activities of ESMATE. This research can be categorized as a diagnostical one to find out what kind of learning conditions influence students’ learning, using materials developed by ESMATE. From these assertions, a framework (Figure 4) was constructed in order to carry out this diagnostical research at classroom level and identify some concrete and specific issues at this level of the ESMATE implementation.
2. Literature review
The Salvadoran textbooks are based in Japanese teaching style as mentioned in (Mejía & Ishizaka, 2019). But cultural and context circumstances might affect the implementation and effectiveness of the curriculum materials as has happened in other countries’ experience. For instance, based on Lindorff et al. (2019), findings which explains the experience of applying mastery approaches based on East Asian countries (Shanghai and Singapore), and the application of Singaporean teaching style that focuses on textbook use and mastery-based instruction in UK. Besides, another experience is in the use of Finnish textbooks implemented in Sweden and Italy, where it addressed how Finnish teachers’ culture relies on the instructional lesson planning and the teacher’s guide more than the textbook, despite of the fact that teachers in other countries rely more on textbook for this (Tuula et al., 2018).
The textbook itself is influencing students’ learning achievements due to aspects like organization of lessons, the use of the time, introduction of new concepts, nature of examples, the quality of instructional activities and the provision of guided and independent practice (Carnine, 1991). Despite the influence of the textbook in the improvement of the learning achievements, the concrete use of it in the classroom may change from teacher to teacher (Freeman & Porter, 1989; Moulton, 1997). Starting with the different approach in which textbook plays its own role during lessons, different experiences and results may occur. For example, in the Singaporean case, even during a lesson, textbook gives a clear and concrete trajectory of learning activities, by which students smoothly follow sequential stages of the lesson (Lindorff et al., 2019). And also, Singaporean textbook works as a cornerstone in students’ self-learning, like homework, which is considered as one of the bases of Singaporean education’s success (Kaur, 2010). However, the role of the introduced Singaporean type textbook during the lesson is considered totally different in UK (Lindorff et al., 2019; O’Keeffe & White, 2017), where the textbooks are mostly used for exercises, problems and homework preferably selected by teachers, and not fully nor sequentially lectured by teacher. In addition, even the availability of textbooks is not assured in all schools (O’Keeffe & Figure 1. The ESMATE framework. Data source:
White, 2017).
At micro level, classroom, learning experiences in using textbooks vary from teacher to teacher, as well as from one country to another one. For instance, in planning the instructional lesson, some teachers may rely more on textbook itself, such as mentioned before in studies from UK case (O’Keeffe & White, 2017; Thomson & Fleming, 2004), while German teachers consider textbooks to be the most important learning resource for their mathematics instruction (Sievert, van den Ham, Niedermeyer & Heinze, 2019). On the other hand, the case of Finland present variations, where around a 90% of teachers rely more on the use of the teacher’s guide for instructional lesson planning (Tuula et al., 2018). Accordingly, as is showed in a case study of China, teachers’ reliance level toward textbook and teacher guide was found as one of the important parameters to determine their instructional coherence (Chen & Li, 2009).
Considering the intervention made by Lindorff et al. (2019) in the case of UK, it is clear how the teaching style might influence students’ learning achievements. For instance, how teachers use the textbook, and a very remarkable aspect related to the overall teachers’ fidelity to the intervention (how teachers apply the adapted teaching style and adhere to the lesson plan), including the instructional teaching planning and the teachers’ adherence during the lesson (Lindorff et al., 2019). At the microlevel, some specific aspects from the UK experience, and the different used instruments (QoT, ISTOF, MECORS) can be considered in this research. These specific features of the teaching style would be “promoting active learning and metacognitive skills”, “activating pupils”, “clear instruction”, “demonstrates skills on questioning”, “assessment and evaluation”, “adaption of teaching”, “classroom climate”, “classroom management”, “effective classroom organization”4 (Lindorff et al., 2019). These
features of the teaching style can be considered as key factors in the ESMATE framework (Figure 1) related to “teaching practices” and “instruction, check, and feedback” parts and which is also concretely stated on the ESMATE teacher’s guide (MoE, 2019, p.7, 10, 14-17).
Despite the information presented, and the experience about successful approaches (like
Singaporean one) in countries like UK, there exists a lack of evidence or researches made in Latin America about implementation of successful approaches from abroad (like Japanese, Singaporean, Finnish). Even in some mentioned articles (Lindorff et al., 2019; Tuula et al., 2018) is addressed that evidence to support the transferability of these successful approaches is still limited. At this moment was not possible to find evidence of these kinds of relationships between textbook implementation and research at classroom level, students’ outcomes and underlaying teaching style and lesson plan adherence, even in developing countries, and in particular for Latin American countries like El Salvador.
The teacher’s role in the implementation is cornerstone to the appropriate use of textbooks. In this sense, it is also important to note the role that textbooks have in helping teachers to learn mathematics and to improve teaching practices (Chávez & Reys, 2003). Moreover, according to the Japanese teaching style described by Shimizu (2002, p.4): “the teacher needs to plan their lesson with a clear idea about both the topics to be taught and expected students’ responses”. Thus, the teaching learning process in the Japanese style substantially considers important traits included in textbooks and teaching style. A significant step is that teachers should have a clear idea about the topic to be taught in each lesson, and it is important that the goal for their lessons are usually similar to that found in the teacher’s edition of textbooks (Shimizu, 2002). Another important trait is that teachers should have a clear idea about the expected student’s responses, and they (teachers) should plan instructional activities considering these expectations and pursuing to promote students’ thinking and encourage them to come up with different solutions (Shimizu, 2002). Finally, at the classroom implementation, it is very important that while students are working, teacher moves around to observe students’ work, in order to watch students who, have good ideas, and detect wrong ideas (Shimizu, 2002). Therefore, in order to find out possible conditions and features of the teaching style, which may affect appropriate contextualization of Japanese teaching style and textbooks in El Salvador, it is very important to focus
on analyzing concrete teaching practices and understand how teachers plan and evaluate their adherence to that plan in order to reach the objective for each lesson.
Specifically, in the case of El Salvador, the main resource to prepare the lesson plan is the teacher’s guides related to the textbooks (MoE, 2019)5. For
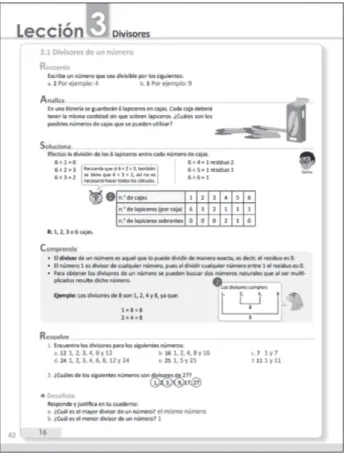
planning a lesson, teachers should consider general guidance written in the introduction of teacher’s guide, including key lesson activity items such as “review”, “problem”, “solution”, “conclusion”, “example” or “exercises” (see Figure 2), “time table” according to each lesson’s activity, and some instructional considerations for each activity (MoE, 2019). Also, each lesson’s guide has specific considerations for the sequence, focus and approach of the content; furthermore, blackboard planning is included in this space in order to organize the blackboard for each lesson (see Figure 3). In order to prepare a lesson, teachers should: read the lesson page in the teacher’s guide, analyze the expectations of each class, solve the purposed problems in advance and compare with the solved ones in the teacher’s guide, consider some key question to conduct the class, determine the exact time for each activity, check the blackboard planning of the lesson, and prepare didactical material if necessary (MoE, 2019).
3. Research question and Framework
With the purpose of identifying and understanding issues involved at the classroom level in the implementation of ESMATE, this paper addresses the following research questions:
● Which features in the teaching style may be
affecting the students’ learning achievements between lessons carried out with the textbook and workbook and lessons carried out without textbook or workbook?
● How is the lesson plan adherence influencing
the teaching style in lessons carried out with and without the textbook and workbook? For this research, the framework can be seen in the Figure 4. Due to the diagnostical nature of the research, the expectation is to identify different issues happening at classroom level under previously
5 The teacher’s guide used as reference was 5th grade, but all grades have similar information
Figure 2. Textbook sequence. Data source: Teacher’s guide (MoE, 2019)
Figure 3. Teacher’s guide consideration. Data source: Teacher’s guide (MoE, 2019)
controlled main conditions (with or without students’ resources). This can help to identify more features in the teaching style and how lesson plan adherence may affect students’ learning process and their achievement. Students’ resources are textbook and workbook, while teacher’s additional resource is teacher’s guide. These resources are derived from Japanese style textbook and teaching (MoE, 2020a) and aliened to Salvadorian curriculum by ESMATE. 4. Research methodology
The purpose of this research is to identify different issues happening at classroom level under previously controlled main conditions (with or without students’ resources) in the implementation of ESMATE framework by developing some lessons in arithmetic. More concretely speaking, it presumes to determine whether or not a difference exists in the student’s learning achievement between a class carried out with the textbook and workbook, and a class carried out without textbook or workbook.
Furthermore, it presumes to understand the features in the teaching style and lesson plan adherence that may be affecting the students’ learning achievements between both groups.
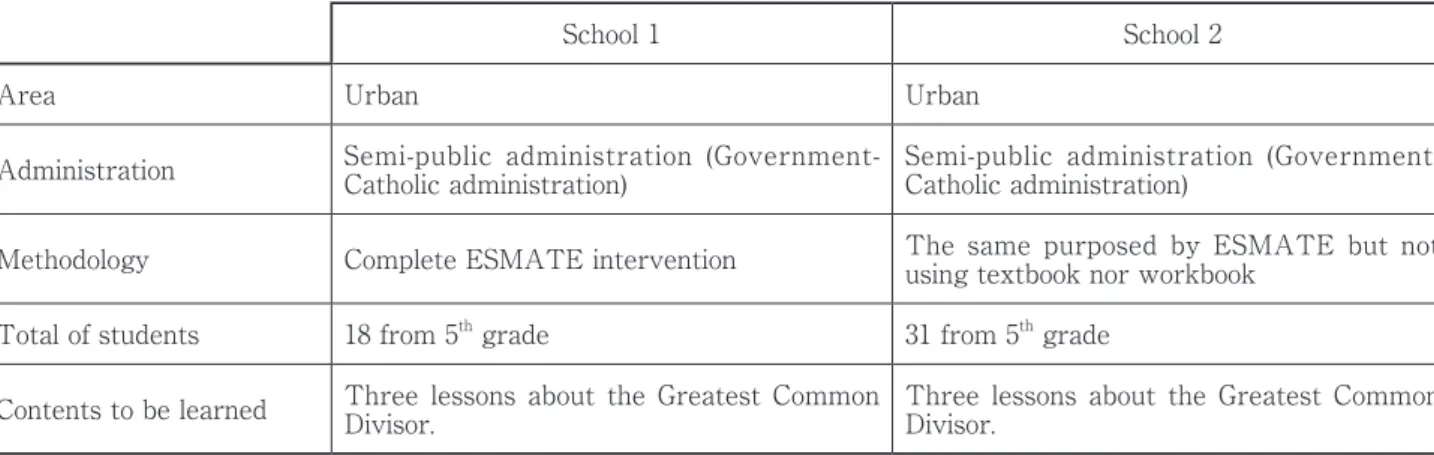
The research was carried out in two classroom groups with the features detailed in the Table 1. In both groups, a mixed method, quantitative and qualitative, was implemented. The quantitative method aims to clarify if any difference is shown between both groups, and the qualitative method pursues the elicitation of the features of the teaching style and lesson adherence that could explain the result of the quantitative analysis.
In order to guarantee a fair comparison between both schools, the social and environmental background can be assumed from the features described in Table 1, both schools have urban location and semi-public administration (students from both schools are also taught in moral values and manners from the Catholicism, that influence in their behavior and personality to be similar).
Table 1. Classroom group features
School 1 School 2
Area Urban Urban
Administration Semi-public administration (Government-Catholic administration) Semi-public administration (Government-Catholic administration) Methodology Complete ESMATE intervention The same purposed by ESMATE but not using textbook nor workbook
Total of students 18 from 5th grade 31 from 5th grade
Contents to be learned Three lessons about the Greatest Common Divisor. Three lessons about the Greatest Common Divisor.
Figure 4. Research framework. Source: Adapted by the author from ESMATE framework, Maruyama & Kurosaki (2020)
The comparative study was conducted by using pre and post tests. First of all, the pre and post tests were used to detect improvement of students’ learning achievement in School 1 and School 2 separately. Secondly, pre and post tests were applied to compare students’ learning achievement of the two schools to determine whether there was any difference between the two school before and after conducting the lessons, and then to compare between the two schools about how much the students’ achievement has been improved. Finally, the results of the pre and post tests were used to analyze to what extent students’ achievement of both schools was improved in each cognitive domain: knowledge, application and reasoning. For scoring the students’ learning achievement through the pre and post tests, the following Likert scale codes were used:
Category 1: if the procedure is totally correct Category 2: if the procedure is partially correct
(to reach a specific point in the procedure determined in advance is considered as half), Category 3: if the procedure is incorrect Category 4: if the student leaves it blank. To analyze the results of pre and post tests, descriptive and inferential statistics were employed. 4.2. Qualitative methodology
Two camcorders were used to record the six lessons taught by the teachers (three lessons per teacher). The six videos of lessons were transcribed, categorized and analyzed in the following two ways. The first way was to identify some features in the teaching style taken not only by the two teachers but also the reactions by students, and to estimate the time allocated to develop each activity, analyzing the transcript. The second way was to analyze the lesson plans adherence by the teachers, according to the remarks made in general guidance of the teacher’s 4.1. Quantitative methodology
The evidence of students’ learning achievement will be elicited through a mathematics paper-based test corresponding to the three lessons that were addressed with them. In said paper-based test was taking into account the cognitive domains framework used for the Trends in International Mathematics and Science Study (TIMSS). The definition for each cognitive domain was taken as follows:
The first domain, knowing, covers the facts,
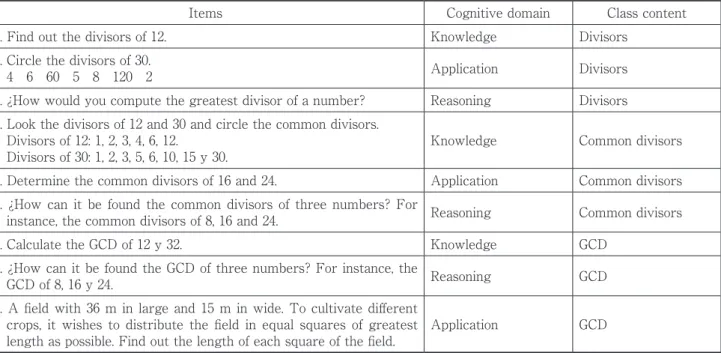
concepts, and procedures students need to know, while the second, applying, focuses on the ability of students to apply knowledge and conceptual understanding to solve problems or answer questions. The third domain, reasoning, goes beyond the solution of routine problems to encompass unfamiliar situations, complex contexts, and multistep problems (IEA, 2019) Table 2 summarizes the items of the test and its categorization per content and cognitive domain.
Table 2. Items used in the mathematic test
Items Cognitive domain Class content
1. Find out the divisors of 12. Knowledge Divisors
2. Circle the divisors of 30.
4 6 60 5 8 120 2 Application Divisors
3. ¿How would you compute the greatest divisor of a number? Reasoning Divisors
4. Look the divisors of 12 and 30 and circle the common divisors. Divisors of 12: 1, 2, 3, 4, 6, 12.
Divisors of 30: 1, 2, 3, 5, 6, 10, 15 y 30. Knowledge Common divisors
5. Determine the common divisors of 16 and 24. Application Common divisors
6. ¿How can it be found the common divisors of three numbers? For
instance, the common divisors of 8, 16 and 24. Reasoning Common divisors
7. Calculate the GCD of 12 y 32. Knowledge GCD
8. ¿How can it be found the GCD of three numbers? For instance, the
GCD of 8, 16 y 24. Reasoning GCD
9. A field with 36 m in large and 15 m in wide. To cultivate different crops, it wishes to distribute the field in equal squares of greatest
guide. This means how well each teacher fit, follow, and carried out the activities planned in the lesson plan (MoE, 2019, p.10, p14, pp.42-48).
5. Research results
From the research design, it was found that the learning conditions for School 1 are quite auspicious and favorable, since the number of students was less than 20 and the students enjoyed all the materials developed by ESMATE, including textbook and workbook. Therefore, a better performance in students from the School 1 than the School 2 might be also predicted.
5.1. Quantitative research results
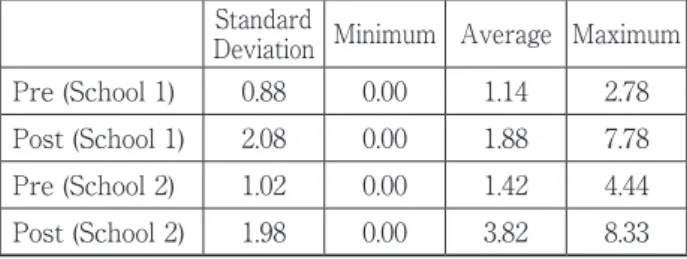
The descriptive statistics for the two schools in both pre and post tests are shown in Table 3 considering a ten-based score for each student. Apparently there exists difference and improvement evidence after the lessons’ teaching in both schools. But these hypotheses are going to be confirmed by calculating some t-tests.
The Table 4 shows the mean difference evidenced by the t-test for a paired data collection separately for the School 1 and School 2. In this table, two-tailed test was considered. As can be seen in the results, in School 1 the mean has not improved in the post-test. On the other hand, in the School 2 it was statistically accepted that there exists improvement in the means with a 1% of significance level.
For comparing the results between both schools, the t-test for a heteroscedastic data collection was used in a variable created as the difference between the post and the pre score for each student. The fairness of the comparison between students from School 1 and School 2 can be guaranteed by the pre-test results, that shows that students do not have any significant difference about the knowledge of the contents to be taught. It implies that at least, most of the students of both schools have almost no knowledges/skills about the chosen topics of “divisors” (the average scores are 1.14 and 1.42 respectively). The previous knowledge/skills, which are directly linked with this topic are also assumed similar between the two schools’ students.
Table 5 shows the mean difference with the t-tests result. From these results it is clear that the difference in the achievements before and after the lessons are statistically significant between both schools with significance of 1%. Therefore, the students’ learning achievement from School 2 were better than those from School 1, even with the different pre-conditions. These findings can be graphically confirmed in Figure 6.
6 Note: 10% significance: *, 5% significance: **, 1% significance: ***
Table 3. Descriptive statistics per school
Standard
Deviation Minimum Average Maximum
Pre (School 1) 0.88 0.00 1.14 2.78
Post (School 1) 2.08 0.00 1.88 7.78
Pre (School 2) 1.02 0.00 1.42 4.44
Post (School 2) 1.98 0.00 3.82 8.33
Table 4. T-test for each school 6
School 1
(pre-post difference) (pre-post difference)School 2
Two-tailed 0.74 (0.114) 2.40*** (0.000)
Table 5. T-test comparing both schools
School 1 and 2 (post-pre difference)
Two-tailed 1.66*** (0.004)
Figure 5. Score means behavior in School 1 and School 2 for pre and post-test.
To understand at which cognitive level, knowledge, application and reasoning, the improvement of students’ learning achievement was more evident, Figures 6, 7 and 8 were summarized. In Figure 6 the results based on the cognitive domains and focused only on totally correct answers (the Category 1, defined by the author) is presented. From this figure apparently most of the improvement, as can be
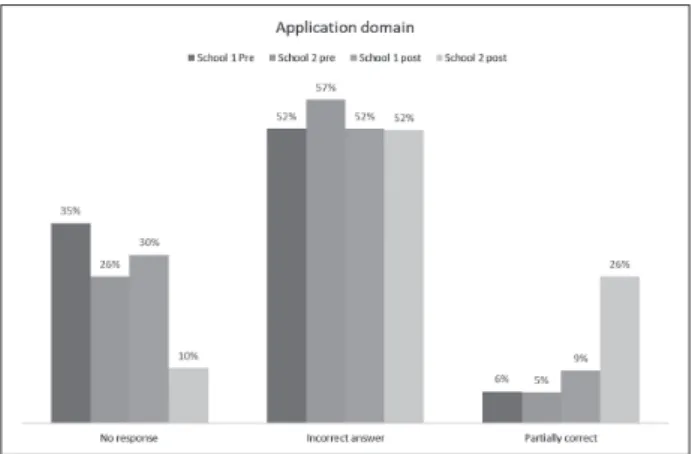
expected, is inside of the knowledge domain, in particular, more relevant in the post test results of the School 2, whereas in the other domains, there was no much difference between pre and post tests, nor between the School 1 and 2. For analyzing more deeply the results of the other domains (application and reasoning), Figures 7 and 8 show detailed difference in students’ performance considering the partial scores (Category 2 and 3) and the answers left blank (Category 4). It is evident that, in the School 2, how a lower percentage of students left items blank, and how the percentage of partially correct answers increased in both domains. While in the School 1 the difference was that now students at least started facing the problem, even the procedure was not correct at all; this result is also remarkable in the School 1. Despite the above mentioned, even though some positive improvements were achieved by students from School 2, the scores are still low, and the performance after the lessons cannot be expected to be like that. An emphasis should be given also to the application and reasoning domains during the teacher’s lesson instruction.
5.2. Qualitative research results
For understanding how the students’ performances were affected by the teaching style and lesson plan adherence in the results, the lesson videos were analyzed in two different ways. One was by analyzing only the specific activities and facts that occurred during each class, and the second one was to understand whether the teacher adhered well to the enacted lesson plan or not.
In Table 6, more frequently detected activities in all the six lessons were summarized as common behaviors of teachers and students. Except for the common behaviors, many other behaviors were omitted because of scarcity of general features among them. Even though the common behaviors were confirmed in all the six lessons, time allocation of each lesson for the common behaviors varied. Based on this analysis procedure7, four common behaviors were
detected: i) teacher walks around classroom to check notebooks, ii) teacher gives feedback, iii) students think and solve, iv) students draw or do other related tasks.
7 This analysis procedure basically resembles grounded theory approach in the sense that the author interpreted all the
behaviors detected in the recorded lessons and coded them into four groups of activities.
Figure 6. Comparison by cognitive domain considering totally correct answers
Figure 7. Comparison in application domain considering partially correct, incorrect and left blank answers
Figure 8. Comparison in reasoning domain considering partially correct, incorrect and left blank answers
But for these four common behaviors showed in the Table 6, there exists a clear trend: teacher in the School 2 is using more time in walking around the classroom and giving specific feedback to students. The quality of the feedbacks was not classified, but in general, most of the feedbacks were appropriate and suitable for students’ needs. With respect to the students’ behaviors during the lessons, time to think and solve was counted if the students are silently working or reading, writing with the pen or pencil, revising previous lessons, or asking classmates questions. Also, it was considered as time for drawing and doing other tasks, if students were using rulers, glue, scissors, or were requesting some stationery tools. The students in the School 1 spent more time in doing tasks, other than thinking, facing and solving the problem than in School 2.
From the results of Table 6, it appears necessary to analyze whether the difference of time allocation for the behaviors was derived from the teaching style or not. Certainly, the level of understanding and skill may vary from teacher to teacher, but it is also important to verify whether contents of the teacher’s guide (lesson plan) are well understood by teachers or not. Since the teacher’s prepared lesson plans is basically supposed to be aligned with the teacher’s guide, in this research, it was planned to determine from the video analysis i) how well teachers adhered to the lesson plan and also ii) to what extent the students’ expectations in the lesson plan were accomplished in the lessons. The Table 8 summarized these aspects of teachers and students, using a term “(expected) performance” criteria utilized to measure whether the teacher adhered to that lesson plan activity or not, and for students, whether the activities succeed in getting the students’ expectation. These
performances of teachers and students were analyzed in each phase of the lesson: “review”, “problem”, “solution”, “conclusion”, “example” or “exercises”. Since in this case the lesson plans for both teachers were the teacher’s guide pages corresponding to the lessons to be taught and the introductory pages, the considered aspects in Table 7 were taken from the teacher’s guide. To determine teacher’s and student’s performance, this research categorized three grades (1 to 3) of adherence (teachers’ side) and accomplishment (students’ side) respectively. This categorization was defined as follows:
Category 3 means “totally accomplished”: if teacher or students fulfilled all the aspects in the rubric (see Table 7).
Category 2 means “partially accomplished”: if teacher or students fulfilled at least the half of the aspects in the rubric (see Table 7).
Category 1 means “not accomplished”: if teacher or students fulfilled less than the half of the aspects in the rubric (see Table 7).
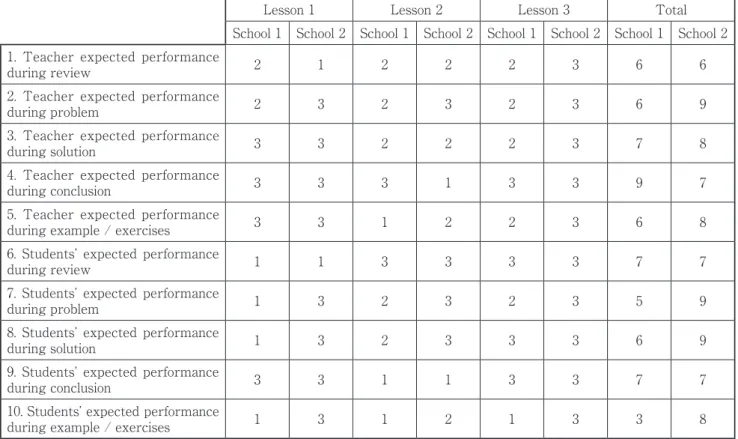
To simplify discussion about this qualitative data, Table 8 quantified the results, summing up the grades given to each lesson for both School 1 and 2. The results can be seen on the cell of “total” in Table 8. According to the Table 8 some interesting findings can be addressed. Firstly, teacher performance in the initial problem is better in School 2 than School 1, this fact can be explained because it seems like in School 2, the teacher involved more the students with very clear instructions. Secondly, even though teacher performance in conclusion is slightly better in School 1 than School 2, School 1 is the same as School 2 in terms of students’ performance in conclusion. Finally, there is not much gap in teacher performance of example / exercises between two schools, there Table 6. Time allocation of teacher and students’ behaviors during the three lessons
Lesson 1 (range of time
used in minutes) Lesson 2 (range of time used in minutes) Lesson 3 (range of time used in minutes)
School 1 School 2 School 1 School 2 School 1 School 2
Time of teacher walking around the
classroom checking notebooks 6-7 8-9 1-2 9-10 5-6 9-10
Time of teacher giving feedback 7-8 11-12 2-3 7-8 14-15 19-20
Time used for student to think and
solve 3-4 10-11 2-3 10-11 8-9 19-20
Time used by students in drawing,
Table 7. Rubric for categorization of students and teachers’ performance
Students Teacher
Review
− To solve the problems related to previous lessons − To achieve specific aspects of the content related to the
teacher’s guide expectation
− To use less than 5 minutes
− Teacher promoted student’s activation and active learning
Initial problem
− To read and analyze the problem
− To understand and extract the main information to solve
− To prepare the solution plan
− To use less than 5 minutes
− To ask to the students to read the initial problem, verifying the comprehension about it
− To write the resumed problem on the blackboard − To direct to work individually
Solution
− To solve the problem by using the solution plan
− To compare solution with another classmate or textbook
− To socialize the solution in group or with the class − To achieve specific aspects of the content related to the
teacher’s guide expectation
− To use about 15 minutes
− To enhance knowledge and previous weakness to students
− To explain in plenary, if it is considered necessary − To use specific extra material indicated for the lesson Conclusion
− To read and highlight the most important − To identify new concepts
− To link with the class content
− To use less than 5 minutes
− To focus the main information, by linking with the solution procedure
Problem section:
− To solve at least the first item, conclusion can be used as reference
− To verify the final answer with the shared answer on the blackboard
− To apply specific aspects of the lesson’s content
− To use at least 15 minutes
− To support student during the solving time − To give feedback in case of mistakes − To manage the answers socialization − To assign the homework
Data source: adapted by author considering ESMATE teacher’s guide (MoE, 2019)
Table 8. Teacher and students’ performance during the three lessons
Lesson 1 Lesson 2 Lesson 3 Total
School 1 School 2 School 1 School 2 School 1 School 2 School 1 School 2 1. Teacher expected performance
during review 2 1 2 2 2 3 6 6
2. Teacher expected performance
during problem 2 3 2 3 2 3 6 9
3. Teacher expected performance
during solution 3 3 2 2 2 3 7 8
4. Teacher expected performance
during conclusion 3 3 3 1 3 3 9 7
5. Teacher expected performance
during example / exercises 3 3 1 2 2 3 6 8
6. Students’ expected performance
during review 1 1 3 3 3 3 7 7
7. Students’ expected performance
during problem 1 3 2 3 2 3 5 9
8. Students’ expected performance
during solution 1 3 2 3 3 3 6 9
9. Students’ expected performance
during conclusion 3 3 1 1 3 3 7 7
10. Students’ expected performance
confirmed huge gap in students’ performance between them. In this case, the teachers’ performance in the activities of the rubric based on the teacher’s guide does not depend on the relevance of the activities with the content of the lesson. But students’ performance is measuring very specific aspects of the lesson content involved in the solution of the first item.
This aspect of the rubric and its connection with the teacher’s guide teaching instruction shows that it is likely to pose that the teacher’s guide should provide more specific and concrete directions for teacher’s performance in order to assure i) the relevance of the activities with the content of the lessons, ii) what teachers need to detect while walking around the classroom and what kind of feedback is suitable for each situation in order to assure students active learning and involving.
At this point is important to clarify from the Table 7 rubric that the textbook in School 1 was expected to be used during the lessons in order for the students to follow and read some moments of the class. For instance, to read and analyze the initial problem, to compare their own solution with the given solution (when it was instructed by the teacher), read and highlight the conclusion. In spite of the textbook can be used in other kind of supportive learning activities (read written explanation), doubts consultation (solution confirmation), or overtime study; these aspects are optional or are not explicitly mentioned in the teacher’s guide or textbook itself. Also, the use of workbook could not be evidenced, since the teacher did not revise the homework during the lessons’ time. Then, it seems like the existence of the textbook and workbook at the classroom does not necessarily mean a huge advantage or difference more than time consuming reduction (teacher might allow students to skip writing some aspects that are already written in the textbook or workbook); unless that specific instructions in the lesson plan or homework assignation were explicitly considered in the lesson plan (teacher’s guide).
6. Conclusions
It appears as if the learning achievements differ between a “textbook-used” (textbook and workbook) lesson and a “no textbook-used” lesson and is likely to
be affected by some features of the teaching style used. For example, how teacher walks around classroom to check notebooks, what kind of aspects they need to detect from students, and how to give feedback to students adequately. Furthermore, the relevance of the activities with the objectives of the lesson need to be very concrete in the lesson plan in many aspects like to plan learning activities that promote the application and reasoning skills, tell clear instructions to the students, assure the appropriate active learning and thinking, clarify the role of the textbook during the class (or overtime study) in each lesson, and keep the time for the checking the workbooks.
As shown in the results above, even though the adherence to the lesson plan (teacher’s guide) of both teachers can be similar, the students’ scores can vary meaningfully. In other words, it means that even if teachers reach a similar category in different moments of the lesson, students’ performance gap can be elicited. Moreover, even if teachers and students reach a high-level category average in performance based on rubric of Table 7, it does not necessarily mean that students have an acceptable score average in all the cognitive domains. Therefore, not only the teaching style needs to be improved through the lesson plan, but also the expected students and teacher performance need to be higher in order to improve application and reasoning skills.
References
Carnine, D. (1991). Reforming mathematics instruction: The role of curriculum materials. Journal of Behavioral Education, 1(1), 37–57. https://doi. org/10.1007/bf00956753
Chávez, O., & Reys, R. E. (2003). From the textbook to the enacted curriculum: textbook use in the middle school mathematics classroom [Doctor’s dissertation, University of Missouri-Columbia]. http://hdl.handle. net/10355/10363
Chen, X., & Li, Y. (2009). Instructional coherence in Chinese mathematics classroom—a case study of lessons on fraction division. International Journal of Science and Mathematics Education, 8(4), 711–735. https://doi.org/10.1007/s10763-009-9182-y
ESMATE. (2020a). Home [Facebook page]. Facebook. Retrieved August 25, 2020, from https://www.
facebook.com/esmateoficial/
ESMATE. (2020b). Home [YouTube channel]. YouTube. Retrieved August 25, 2020, from https://www.youtube. com/channel/UCBHYm85q6CqmQcFr7InR35Q
Freeman, D. J., & Porter, A. C. (1989). Do Textbooks Dictate the Content of Mathematics Instruction in Elementary Schools? American Educational Research Journal, 26(3), 403–421. https://doi.org/ 10.3102/00028312026003403
IEA (2019) Chapter 1: TIMSS 2019 Mathematics framework. TIMSS & PIRLS International Study Center, 13-25. http://timss2019.org/wp-content/ uploads/frameworks/T19-Assessment-Frameworks-Chapter-1.pdf
Kaur, B. (2010). Mathematics homework: a study of three grade eight classrooms in Singapore. International Journal of Science and Mathematics Education, 9(1), 187–206. https://doi.org/10.1007/ s10763-010-9237-0
Li, Y. (2010). Elementary teachers’ thinking about a good mathematics lesson. International Journal of Science and Mathematics Education, 9(4), 949–973. https://doi.org/10.1007/s10763-010-9263-y
Lindorff AM, Hall J & Sammons P (2019) Investigating a Singapore-Based Mathematics Textbook and Teaching Approach in Classrooms in England. Front. Educ. 4:37. doi: 10.3389/feduc.2019.00037 Maruyama, T. & Kurosaki, T. (2020). Developing
textbooks for helping students learn mathematics: Empirical evidence from El Salvador. [conference presentation]. Education GP BBL series, World Bank, April 16
Mejía, F. & Ishizaka, H. (2019). Effectiveness and Issues of ESMATE (Project of Making New Mathematics Textbooks for Primary and Secondary Schools): Contextualization of the Japanese Teaching Style Materials to Current Learning Situation in El Salvador. NUE Journal of International Educational Cooperation, Volume 13, 47-55. doi.org/10.24727/ 00028536
Ministry of Education of El Salvador (2019). ESMATE teacher’s guide fifth grade (2nd ed.). Ministry of Education ed., El Salvador: UCA publishers, 10, 14, 42-48. https://www.mined.gob.sv/component/
jdownloads/send/1240-quinto-grado/8567-guia-metodologica-5.html
Ministry of Education of El Salvador (2020a). ESMATE systematization, El Salvador: Ministry of Education ed., Ministry of Education.
Ministry of Education. (2020b, August 25). ESMATE. Ministerio de Educación de El Salvador. https:// www.mined.gob.sv/materiales-educativos/item/ 1014902-esmate.html
Moulton, J. (1997). How do teachers use textbooks? A review of the research literature. SD Publication Series, Technical paper No. 74, 3-4. http://citeseerx. ist.psu.edu/viewdoc/download?doi=10.1.1.512.4224 &rep=rep1&type=pdf
O’Keeffe, L., & White, B. (2017). A snapshot of the role of the textbook in English secondary mathematics classrooms. International Journal for Mathematics Teaching and Learning, 18.3, 318-332. https://www. cimt.org.uk/ijmtl/index.php/IJMTL/article/ view/75/46
Shimizu, Y. (2002). Capturing the structure of Japanese mathematics lessons: some findings of the international comparative studies [Conference presentation]. ICMI-Second East Asia Regional Conference on Mathematics Education and Ninth Southeast Asian Conference on Mathematics Education, Nanyang, Singapour. http://share. nanjing-school.com/files/2013/11/japaneseUS-maths-19z7tui.pdf
Sievert, H., van den Ham, A.-K., Niedermeyer, I., & Heinze, A. (2019). Effects of mathematics textbooks on the development of primary school children’s adaptive expertise in arithmetic. Learning and Individual Differences, 74, 101716. https://doi. org/10.1016/j.lindif.2019.02.006
Thomson, S. and N. Fleming (2004). Summing it up: Mathematics achievement in Australian schools in TIMSS 2002 (TIMSS Australia Monograph no. 7). Melbourne: ACER.
Tuula Koljonen, Andreas Ryve & Kirsti Hemmi (2018) Analyzing the nature of potentially constructed mathematics classrooms in Finnish teacher’s guides – the case of Finland, Research in Mathematics Education, 20:3, 295-311, DOI: 10.1080/14794802.2018. 1542338