菱刈鉱山地域火山岩の古地球磁場強度と磁気特性
著者
上野 直子, 鄭 重, 上野 宏共
雑誌名
東洋大学紀要. 自然科学篇
号
56
ページ
141-175
発行年
2012-03
URL
http://id.nii.ac.jp/1060/00005329/
Creative Commons : 表示 - 非営利 - 改変禁止 http://creativecommons.org/licenses/by-nc-nd/3.0/deed.jacurve, hysteresis parameters, Curie temperature and susceptibility change with temperature were measured to fi nd the correlation with the result of paleointensity. Thelliers’ method could not derive any long straight line in Arai diagram. Moreover, Zheng’s method succeeded only in one sample. The main reasons of the failure were thermo-chemical alteration and unstable remanent magnetic property of rocks during the laboratory heating process. For most of the samples, the blocking temperature spectra have shifted toward the lower temperature side after heating. A good result by Zheng’s method, which being conducted successfully the correction of grains magneto-static interaction, from Shishimano dacite yields 46+/–3 nT.
Keywords: Hishikari, Paleointensity, Pleistcene, Thelliers’ method, Zheng’s method
1. Introduction
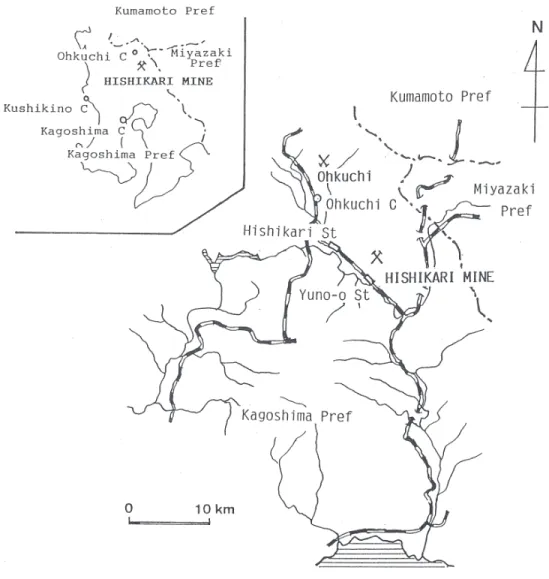
The Hishikari mine (32° 05’N. 130° 41’E) is located in Kagoshima Prefecture, Kyushu,
Japan (Fig.1.). The geological sequences in the area are divided in two main groups: the Shimanto Supergroupe of Cretaceous and volcanic rocks of Pleistocene.
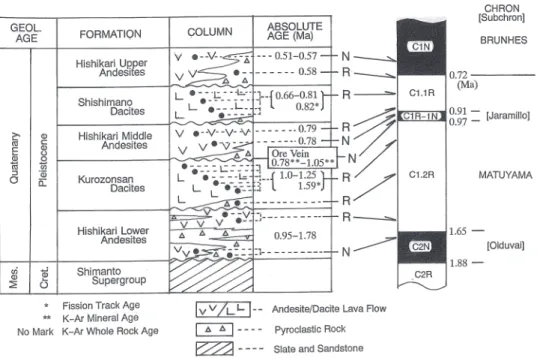
The Pleistcene volcanic rocks composed of andesite and dacite are divided into five
*)
上野直子:東洋大学自然科学研究室 〒 112-8606 東京都文京区白山 5-28-20
Natural Science Laboratory, Toyo University, 5-28-20, Hakusan, Bunkyouku, Tokyo 112-8606, JAPAN: [email protected]
**)
鄭 重:綜合開発株式会社地球科学事業部 〒 133-0057 東京都江戸川区西小岩 1-30-16
三幸ビル 2 号館
Sogo Kaihatu Co., Sanko Build., 1-30-16, Nishikoiwa, Edogawaku, Tokyo 133-0057, JAPAN: [email protected]
***)
上野宏共:千葉科学大学環境安全システム学科 〒 288-0025 千葉県銚子市潮見町 3 現住所:〒 989-3123 仙台市青葉区錦ケ丘 6-20-8
Department of Enviromental Security Systems, Chiba Institute of Science, 3 Shiomicho, Choshishi 288-0025, JAPAN.
142 Naoko UENO, Zhong ZHENG and Hirotomo UENO
formations as shown in Fig.2. In this area, about one hundred data of absolute ages of Pleistcene volcanic rocks by K-Ar and fi ssion track methods are accumulated (Metal Mining Agency of Japan and Sumitomo Metal Mining Co., Ltd., 1987). The geomagnetic polarity sequences were also studied and described in detail by Ueno et al.(1987) and Ueno (2007) as shown in Fig. 2. Combining (i) geological sequences, (ii) absolute ages, and (iii) magnetic polality , it is suggested that the volcanic rocks were erupted during the 5 changes of polarity in Pleistocene.
The aim of this study was to reveal the magnetic property of constituting igneous rocks,
and to estimate the intensity variation of geomagnetic fi eld during the polarity changes.
2. Samples
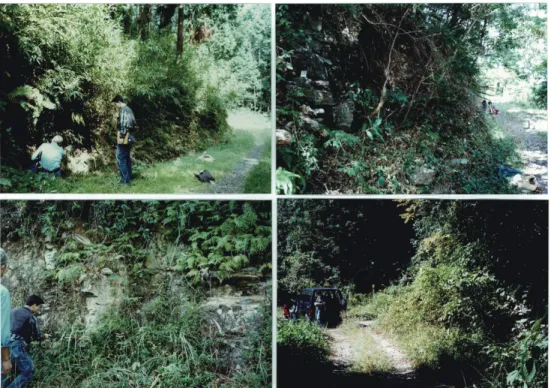
Sampling was carried near the age dating point as shown in Fig.3. The sampling points
were plotted also on the geological map Fig.4 . Some representative outcrop photos are presented in Fig.5. Sample number with formation and magnetic sequence was listed in Table 1.
3. VSM Characters of Rockmagnetism
To understand the general character of the rockmagnetism, VSM (Vibrating Sample
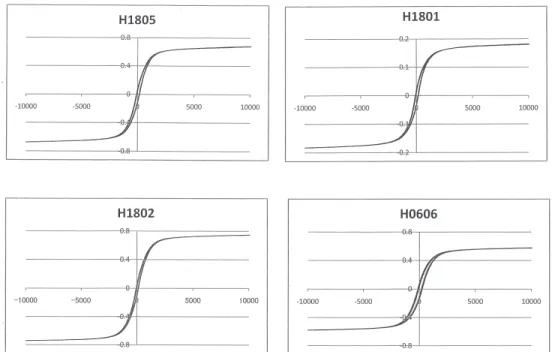
Magnetometer) was used to draw hysteresis loops, Js-T (saturated magnetization variation with temperature change) cur ves and Day diagram. Fig.6 shows some examples of hysteresis loops. Hc (coercivity) varies from 80 Oe to 200 Oe, and Table 2 summarizes the main parameters of the result of VSM experiment.
Some representative examples of Js-T curves are showed in Fig,7-1 and 7-2. The general
feature of irreversible cur ves strongly suggests somewhat mineral change occurred in heating process. VSM made by Riken Denshi Co. was used at the magnetic fi eld of 10kG, in vacuum of 10-5 Torr. Day diagram illustrated in Fig.8 indicates the main magnetic minerals
are dotted in pseudo-single domain region of titano-magnetites.
144 Naoko UENO, Zhong ZHENG and Hirotomo UENO
Fig.3 Sampling site (original map: 国土地理院地形図 栗野) ○ sampling point
Fig.4 Geological map with absolute age dating point (Ma) of sampling site. (original map: 住友金属鉱山株 式会社作成地質図 栗野 , 吉松)
146 Naoko UENO, Zhong ZHENG and Hirotomo UENO
Table 1. Sample number and formation/ magnetic sequence Fig.5 Pictures of the sampling site
the upper left - - - 1801 the upper right - - - 1803 (this side), 1804 (far side) the lower left - - - 1802 the lower right - - - 1903
Fig.6 Examples of hysteresis curve
148 Naoko UENO, Zhong ZHENG and Hirotomo UENO
Fig.7-1 Examples of Js-T curves
4. Paleointensity by Thelliers’ Method
The Coe’s version of the Thelliers’ method was carried in the laboratory of Tokyo Institute
of Technology a long time ago. Some Arai diagrams of those results were illustrated in Fig.9-1~Fig.9-8. Procedures and conditions are as follows: specimens are 25mm in diameter,10mm to 22mm in length: treated in a series of paired heating-cooling cycles, repeated in zero and known laboratory field with progressively increasing temperature: nitrogen atmosphere above 100℃: pTRM test was employed for every sample.
All the specimens failed to yield long straight lines in Arai diagram. For the reason, it can
not expect to calculate a constant intensity of ancient geomagnetic fi eld (Han). The reasons of
off-lines in Arai diagram were considered to be both chemical alteration during heating and magneto-static interaction effect of magnetic grains as suggested in detail in next section 5.
Fig.10. shows |-T (the variation of initial susceptibility with temperature change) during
the Thelliers’ experiment measured by Bartington instruments.
5. Paleointensity by Zheng’s Method
Zheng’s method for paleointensity determination was introduced in the several previous
reports (Ueno et al. 2005; Ueno et al. 2008; Ueno and Zheng 2010; Ueno and Zheng 2011; Ueno and Zheng 2012; Zheng et al.2005; Zheng and Zhao 2006). The experiments of Zheng’s method were carried in a furnace made by Sogo Kaihatsu Co, under vacuum atmosphere about 0.1 Pa.
Briefl y, the Zheng’s method requires the following condition:
Fig.8 Day Diagram
150 Naoko UENO, Zhong ZHENG and Hirotomo UENO
Fig.9-1 Arai Diagram of the Hishikari Upper (N) : Laboratory Field H0=40nT
Fig.9-3 Arai Diagram of the Shishimano ( R ) : H0=40nT
152 Naoko UENO, Zhong ZHENG and Hirotomo UENO
Fig.9-5 Arai Diagram of the Kurozonsan (R) and the Hishikari Lower (N) : H0=50nT
Fig.9-7 Arai Diagram of the Hishikari Lower (N) : H0=50nT
154 Naoko UENO, Zhong ZHENG and Hirotomo UENO
1. To fi nd out the maximum temperature, under which no signifi cant thermo-chemical alteration occurs during the experiments.
2. To satisfy pTRM1=pTRM2, under this maximum temperature in the duplicate experiments of TRM addition.
3. Under this maximum temperature, to ascertain that unblocking temperature spectra of NRM and TRM coincide in some temperature range.
4. Paleointensity data calculated from the individual temperature ranges must follow a normal distribution.
To select the suitable samples for Zheng’s method, |-T measurement by KLY-3S
Fig.11-1 |-T change by Kapper Bridge of Hishikari Upper (N)
Fig.11-2 |-T change by Kapper Bridge of H1801 : Shishimano (R), H1802 : Hishikari Middle (N), H606 : Hishikari Lower (R)
156 Naoko UENO, Zhong ZHENG and Hirotomo UENO
5-1 Quick Method
Thermal demagnetization of NRM was carried on fi ve samples (including sample H1801)
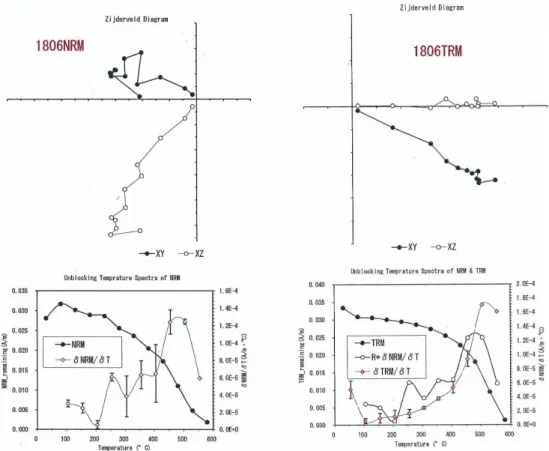
to yield unblocking temperature spectra. Next, after being heated over 590℃ the sample was cooled to room temperature in the laboratory fi eld of 50nT to acquire a full TRM, thermal demagnetization was carried again to yield unblocking temperature spectra of this full TRM in the same temperature steps as NRM (Fig.12-1~ Fig.12-5). Comparison of those two unblocking spectra of TRM and NRM yields a paleointensity data from each unblocking temperature interval (Table 3).
Except for sample H1801, paleointensity data from individual unblocking temperature
intervals of each specimen are widely scattered. Only the specimen H1801 showed good consistent results with average of 46+/–3nT by directly comparison of unblocking spectra of NRM with that of TRM (quick version of Zheng’s method). The coincidence of unblocking spectra pattern of NRM and TRM of H1801 suggests that the chemical change might have not occurred during laboratory heating, assuring that the NRM were originated from TRM. On the other side, specimens H1806, H1802, H606 and H604 were suffered from chemical changes during heating, thus resulting the different patterns of unblocking spectra between NRM and TRM.
The chemical alteration of the magnetic minerals estimated by the dif ference of
unblocking spectra pattern of NRM and TRM could be the main reasons of the failure in previous Thelliers’ method illustrated in Fig.9-1~ Fig.9-8.
The comparison of unblocking spectra pattern of duplicate thermal demagnetization might
indicate the chemical change of the magnetic minerals during experiment. Magneto-static interaction effect is another reason which resulting off-line behavior in Arai diagram. If there
Table 3. Han calculated from Unblocking Temperature Spectra (see Fig.12) in easy method.
158 Naoko UENO, Zhong ZHENG and Hirotomo UENO
is the large interaction effect, large scattered distribution of Han can be expected, thus
resulting off straight-line behavior in Arai diagram. In this case, a Han calculated from Arai
diagram (apparent Han) is far from the genuine one. Small interaction effect only makes small
dispersive distribution of Han, and makes almost straight line in Arai diagram to obtain a data
near its genuine. The difference between the genuine Han and apparent Han depends on the
distribution of unblocking temperature of interacting-grains. Large difference in distribution of unblocking temperature of interacting-grains produces a large difference between the genuine Han and apparent Han. Similar unblocking temperature of interacting grains
contributes to get the near genuine apparent Han. It must also notice there is existence the
case when apparent Han from each individual temperature intervals would be quite different
from the genuine one while if it is of a small dispersive distribution would still make faked straight line in Arai diagram.
Coincidence was noticed between |-T change (Fig.11-1 ~ Fig.11-3) and unblocking spectra
pattern of NRM and TRM (Fig.12-1 ~ Fig.12-5). Only sample H1801 (Fig.11-2) shows the good reproducibility in the repeated analysis. On the other hand, reproducibility could not be
found in other specimens, due to the chemical change during the laboratory heating.
5-2 Zheng’s method applied to H1801
Five specimens from the sample H1801 were selected for Zheng’s method under the
suggestion of pilot in quick measurement.
1
stRUN (pick-up run)
In Zheng method, the 1st RUN (pick-up run) is a “differentiated Thellier method”.
For every temperature interval (Ti+1,Ti), we measure the following two terms:
pTRM1(Ti+1,Ti, Hlab) and
dNRM(Ti+1,Ti) = NRM(Ti)remaining - NRM(Ti+1)remaining
Then, an apparent paleointsnsity Han-1 can be estimated
(Differentiated Thellier method)
160 Naoko UENO, Zhong ZHENG and Hirotomo UENO
Han-1 = dNRM(Ti+1,Ti) /pTRM1(Ti+1,Ti, Hlab) * Hlab (1)
Thermal demagnetization of NRM was conducted step-wisely (Ti+1) to obtain an individual
dNRM(Ti+1,Ti). Then at every individual temperature interval (Ti+1,Ti), pTRM1(Ti+1,Ti, Hlab)
was acquired by cooling from temperature Ti+1 to Ti in a laboratory fi eld of Hlab (100nT), a
fi eld which was applied in perpendicular direction of NRM, and this fi eld Hlab was switched
off when cooling from temperature Ti to room temperature. Comparison of the these two
dNRM(Ti+1,Ti) and pTRM1(Ti+1,Ti, Hlab) yielded a apparent paleointensity (Han-1). The detail of
the results were shown in Fig.13-1, 13-3, 13-5, 13-7 and 13-9. Arai diagram did not follow a straight line because of the chemical change or affect of magneto-static interaction between the magnetic grains. To correct the interaction effect, the 2nd run was performed.
2
ndRUN
In the experiment of 2nd RUN (correction run), the same specimen is used to acquire a
TRMlab-2 to correct the interaction affect.
TRMlab-2 is acquired cooling from thermal alteration safeguard maximum temperature Tn
to room temperature in an artifi cial fi eld Hlab-2 as close as possible to ancient magnetic fi eld
intensity (Han) at a given low cooling rate 1℃/min. And the artifi cial fi eld is applied to the
sample in the same direction of NRM.
In this way, the obtained TRMlab-2 is a TRM of property nearest that of full_TRM.
TRMlab-2 = TRM(Tn, T0, Hlab_2) + NRM(Tn)_remaining (2)
In the second run, TRMlab-2 is used instead of NRM, the same process as 1st RUN, to get
pTRM2(Ti+1,Ti) and dTRM_lab-2(Ti+1,Ti) and Han-2
Han-2 = dTRM_lab-2 (Ti+1,Ti) /pTRM2(Ti+1,Ti,Hlab) * Hlab (3)
Fig.12-5 Unblocking Temperature Spectra of H604 : Hishikari Lower (N)
162 Naoko UENO, Zhong ZHENG and Hirotomo UENO
Fig.13-1 1st
Fig.13-2 2nd
164 Naoko UENO, Zhong ZHENG and Hirotomo UENO
Fig.13-3 1st
Fig.13-4 2nd
166 Naoko UENO, Zhong ZHENG and Hirotomo UENO
Fig.13-5 1st
Fig.13-6 2nd
168 Naoko UENO, Zhong ZHENG and Hirotomo UENO
Fig.13-7 1st
Fig.13-8 2nd
170 Naoko UENO, Zhong ZHENG and Hirotomo UENO
Fig.13-9 1st
Fig.13-10 2nd
172 Naoko UENO, Zhong ZHENG and Hirotomo UENO
If no signifi cant thermal alteration occurs during the experiment, pTRM2(Ti+1,Ti) will be
almost equal to pTRM1(Ti+1,Ti). The propor tional par t of dTRM_lab-2(Ti+1,Ti) and
dNRM(Ti+1,Ti) will be used to estimate genuine paleointensity (Corrected Han).
Corrected Han = (Hlab-1 / Han-2) * Han_1 (4)
In the 2nd run of this time, we selected Tn to be 590 ℃ and a laboratory fi eld to be 50nT,
thus a full TRM was acquired.
The results of second run are illustrated in Fig.13-2, 13-4, 13-6, 13-8 and 13-10. Similarly to
the 1st run, Arai diagram did not make the straight line because of the interaction effect.
Only specimen H1801-3 (Fig.13-10) meets the condition for interaction correction:
blocking temperature spectra pTRM2(Ti+1,Ti) are almost equal to pTRM1(Ti+1,Ti), and do
exists proportional part of dTRM_lab-2(Ti+1,Ti) and dNRM(Ti+1,Ti). Three temperature intervals,
500 ℃~530 ℃, 530 ℃~550 ℃ and 550 ℃~570 ℃ were used to obtained a corrected Han with
average 46+/–3nT, which is well consistent with that of quick method.
For other four specimens, comparison with fi rst blocking temperature pTRM1(Ti+1,Ti) the
second one pTRM2(Ti+1,Ti) have shifted toward the low temperature side. Because of
thermal alteration, correction of interaction effect could not be performed.
Following shows the detail of correction for specimen H1801-3 (Fig.13-9~Fig.13-10), three
temperature intervals were used to obtain a corrected Han,
Interval Ⅰ (500℃~530℃), Han-1=41nT, Han-2=48nT
Interval Ⅱ (530℃~550℃), Han-1=31nT, Han-2=34nT
Interval Ⅲ (550℃~570℃), Han-1=32nT, Han-2=33nT
Corrected Han from Interval Ⅰ = (41/48)*50=42.7 nT
Corrected Han from Interval Ⅱ = (31/34)*50=45.6 nT
Corrected Han from Interval Ⅲ = (32/33)*50=48.5 nT
Averaged corrected Han=46+/–3 nT
In the case of the Arai diagram,
Corrected Han = (50/Han-2)* Han-1nT
= (50/ 41.7)*30.8=36.9nT
6. Result and Conclusion
Pleistcene igneous rocks collected from the Hishikari mining districts were used to extract
the paleomagnetic intensities of geomagnetic fi eld. Before the intensity experiments, some experiments to uncover the rockmagnetic properties were also carried out. Hysteresis curve,
during the laboratory heating process. For most of the samples, the blocking temperature spectra had shifted toward the lower temperature side after heating. Another failure for Thelliers’ method was the effect of magneto-static interaction between grains, which conducted an off-line behavior in Arai diagram, which could not be correctted by Thelliers’ method. An exceptional good result from Shishimano dacite by Zheng’s method yielded 46+/–3nT, which had been conducted successfully the interaction correction.
As the results, we could not get the paleomagnetic intensity change during the Pleistcene
in which 5 times of polar change are well known, from igneous rocks collected from the Hishikari mining districts. However we could get excellent information and data for the future paleomagnetic study.
References
Metal Mining Agency of Japan and Sumitomo Metal Mining Co.,Ltd. (1987), Discovery and development of Hishikari mine. Mining Geology, 37 (4), 227-236 (in Japanese with English abstract).
Ueno, H., M. Nedachi, Y. Urashima, K. Ibaragi and R. Suzuki (1987), Paleomagnetism of the Hishikari Gold Deposits; Preliminary Report. Rock Magnetizm and Paleogeophysics, 14, 31-35.
Ueno, H. (2007), Application of the geomagnetic polarity sequence to dating mineral deposits. Andrew et al. (eds) Dgging Deeper: Mineral Explaration and Research, 353-356, Irish Association Economic Geology, Dublin.
Ueno, N., Z. Zheng and T. Sato (2005), Rock magnetic properties of an An-ei Lava, in Sakurajima Volcano – Application to experimental study of geomagnetic paleointensity -. Journal of Toyo Univ.,Natural Science, 49: 111-121.
Ueno, N., Z. Zheng, K. Nemoto and T. Hatta (2008), Thermal analysis of initial susceptibility, isothermal remanence magnetization, sur face analysys by X-ray photoelectron spectroscopy and paleointensity determination by the new method, on Unsen Volcanic rocks. Journal of Toyo Univ.,Natural Science, 52: 117-148.
174 Naoko UENO, Zhong ZHENG and Hirotomo UENO
Ueno, N., Z. Zheng (2010), A case study of Unzen Volcanic rocks by using Zheng’s method for paleointensity determination. Journal of Toyo Univ.,Natural Science, 54: 107-145. Ueno, N., Z. Zheng (2011), Paleointensity determination and rock magnetic characters of
Miyakejima 1983 lava, Japan. Journal of Toyo Univ.,Natural Science, 55: 163-181
Ueno, N., Z. Zheng (2012), Paleointensity determination of Miyakejima 1983 lava (2). Journal of Toyo Univ.,Natural Science, 56: 177-215.
Z. Zheng, X. Zhao and N. Ueno (2005),Probing and correcting the non-ideal behavior of magnetic grains during Thellier paleointensity experiment: A new method of paleointensity determination (in Japanese with English abstract).Journal of Geograpy, 114(2):258-272. Z. Zheng, X. Zhao (2006), A new approach for absolute paleointensity determination:
Consideration on blocking processes between temperature and interaction field. EOS Trans.AGU,87 (52),Fall Meet. Suppl. Abstract GP21A-1290
Z. Zheng, X. Zhao and C.S. Horng (2010), A new high-precision furnace for paleomagnetic and paleointensity studies: Minimizing magnetic noise generated by heater currents inside traditional thermal demagnetizers. Geochemistry Geophysics Geosystems, 11,Q04Y08,doi :10.1029/2010GC003100.
要旨
菱刈鉱山地域火山岩の古地球磁場強度と磁気特性
上野直子・鄭 重・上野宏共
菱刈鉱山地域には K-Ar 法とフィッショントラック法により、連続的に 0.5my ∼ 1.8my に年代測定された第四紀更新世の安山岩(Andesite)と石英安山岩(Dacite)の溶岩が分 布している。古地磁気学の研究結果では、それらは BRUNHES と MATUYAMA クロンの 境界(0.72Ma)を挟んで、ノーマル(N)とリバース(R) に分かれ、さらに MATUYAMA クロン内で JARAMILLO (0.91~0.97Ma)と OLUDUVAI (1.65~1.88Ma) の 2 つのサブクロ ン(N)を含んでいる。
当研究の当初の目的は N と R の境界での地球磁場強度の変化を測定することであった。 岩石磁気特性は VSM でヒステリシス曲線、ヒステリシスパラメーター、キュリー点を測 定した。Day ダイアグラム上では全ての試料が擬似単磁区となった。初期帯磁率を温度を 繰り返し昇降しながら測定して、実験中の加熱による化学変化の有無を予想した。また、 同じ目的で NRM と TRM を熱消磁して Unblocking Temperature Spectra を作成した。 古地球磁場強度は測定法のうち最もよく使われる古典的なテリエ法及び最近筆者等が開 発した鄭法で測定した。テリエ法ではアライダイアグラムで良好な直線が得られなかった。
鄭法では1試料について 46+/–3nT の信頼できる結果が得られた。
結論として、当研究の当初の目的である N と R の境界での地球磁場強度の変化を測定 することについては、現在の技法では菱刈鉱山地域の火山岩から強度変化を求めることは できなかった。しかし、今後の古地球磁場強度研究に役立つ多くの岩石磁気的データが得 られた。