Informative Genes from Gene Expression Data
for Cancer Classification
著者
Mohd Saberi Bin Mohamad
内容記述
学位授与大学: Osaka Prefecture University(大阪
府立大学), 学位の種類: 博士(工学), 学位記番号:
論工第1235号, 学位授与年月日: 2010-03-31, 指導
教員: 大松繁.
Studies on Intelligent Approaches to Select
Informative Genes from Gene Expression Data for
Cancer Classification
Mohd Saberi Bin Mohamad
January 2010
i
Gene expression technology namely microarrays, offers the ability to measure the expression levels of thousands of genes simultaneously in biological organisms. Gene expression data produced by the microarrays are expected to be of significant help in the developments of efficient cancer diagnoses and classification platforms. Many researchers have analyzed gene expression data to select a small subset of informative genes for cancer classification using various intelligent approaches. As a result, the selection of the small subset has improved classification accuracy. However, due to the small number of samples compared to the huge number of genes (high-dimension), irrelevant genes, and noisy genes, the most approaches face difficulties to select the small subset. Therefore, the ultimate goal of this research is to propose intelligent approaches for selecting a small (near-optimal) subset of informative genes from gene expression data for cancer classification. Support vector machine classifiers (SVMs) were used to measure classification accuracies on the gene subsets that produced by all the proposed approaches. The first six proposed approaches were produced based on genetic algorithms (GAs), whereas the remaining approaches were extensions of particle swarm optimization (PSO).
First, a multi-objective strategy in a hybrid of GAs and SVMs (GASVM) was proposed to improve the performance of GASVM that uses a single-objective approach. It is called MOGASVM. The strategy has been developed based on maximization of classification accuracy and gene subset size minimization. In this strategy, multi-objective problems have been accommodated by using specialized fitness functions in GAs. The ultimate goal of the strategy is to search and select a nondominated gene subset Pareto front. It was tried on four benchmark gene expression data sets and obtained encouraging results on those data sets as compared with an approach that used a single-objective strategy in GASVM.
Second, an approach using two hybrid methods was then introduced. This approach includes MOGASVM and an improved GASVM (GASVM-II). It was proposed to overcome the limitations of MOGASVM and GASVM-II that developed separately
ii
dimensionality of the data, and therefore the complexity of the search or solution spaces can also be decreased. In the second phase, MOGASVM is used to select and optimize a small subset of informative genes from the subset that is produced by the first phase. The approach was assessed and evaluated on four well-known gene expression data sets, showing competitive results.
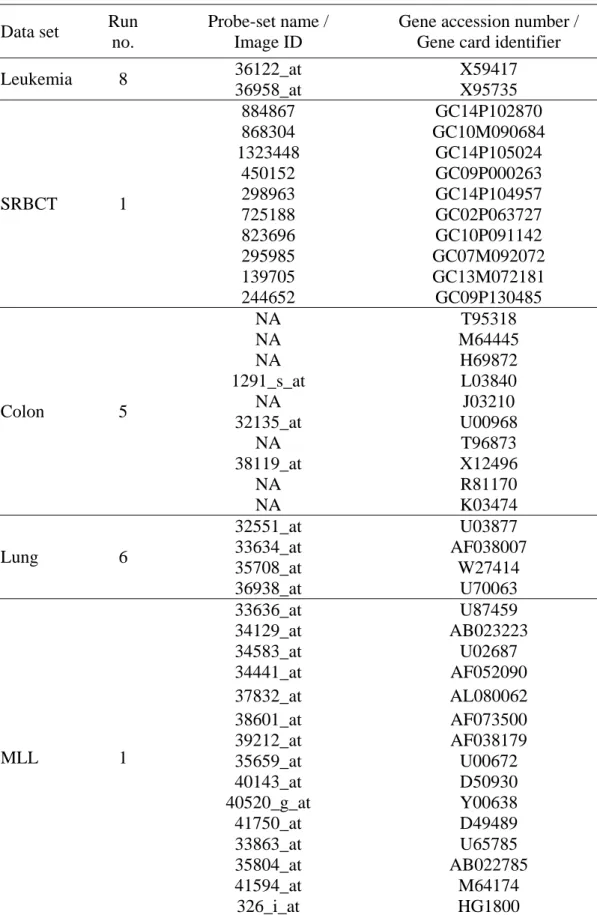
Third, a cyclic hybrid method based on GASVM-II has been proposed. It differs from other GASVM-based methods in one major part, namely it involves a cyclic approach, whereas the GASVM-based methods did not use any cyclic approach. Basically, the cyclic hybrid method repeats the process of GASVM-II to iteratively reduce the dimensionality of data and produce potential gene subsets. Five real gene expression data sets were used to test the effectiveness of the method. Experimental results show that the performance of the proposed method is superior to other experimental methods and previous related works in terms of classification accuracy and the number of selected genes. In addition, a scatter gene graph and the list of informative genes in the best gene subsets are also presented for biological usage.
Fourth, an iterative approach based on MOGASVM is then developed. Generally, it is almost completely the same with the proposed cyclic hybrid, but it uses MOGASVM to replace GASVM-II in the process to yield potential gene subsets and reduce the dimensionality of data iteratively. To demonstrate its effectiveness, four gene expression data sets are used. Experimental results show that the approach is efficient in finding genes for classifying cancer classes.
Fifth, a two-stage method was proposed to surmount the drawbacks of GASVM-based methods in previous related works. In the first stage, a filter method such as gain ratio (GR) or information gain (IG) is applied on overall gene expression data to preselect genes and finally produce a subset of genes. The dimensionality of data is also can be decreased. The second stage applies MOGASVM to automatically optimize the gene subset that is produced by the first stage. As a result, it yields a small (near-optimal) subset of informative genes. The two-stage method was evaluated on four publicly
iii
Sixth, since a two-stage method does not perform well as expected, a three-stage method that includes frequency analysis in the third stage was proposed. The frequency analysis is implemented to identify the most frequently selected genes in near-optimal gene subsets. The most frequently selected genes are presumed to be the most relevant for the cancer classification. The three-stage method differs from methods in previous works in one major part. The major difference is that it involves three stages (using a filter method, a hybrid method, and frequency analysis), whereas the previous works usually had only one stage (using a filter method or a hybrid method) or two stages (using a filter method and a hybrid method). The proposed method has been tested and evaluated for gene selection on five gene expression data sets that contain binary classes and multi-classes of tumor samples. Based on the experimental results, the performance of proposed method is better than that of other methods in previous related works. The list of informative genes in the final gene subset is also presented for biological usage.
Seventh, a modification of binary PSO was proposed to overcome the limitations of the conventional version of binary PSO and previous PSO-based methods. A scalar quantity called particle’s speed and a novel rule for updating particle’s positions are introduced in this modified binary PSO. This particle’s speed and rule are proposed in order to reduce the probability of genes to be selected for the cancer classification. By performing experiments on 12 different gene expression data sets, the modified binary PSO outperforms other previous related works, including the conventional version of binary PSO in terms of classification accuracy, the number of selected genes, and running times.
Eighth, an enhancement of binary PSO with the constraint of particle’s velocities was proposed. The constraint is introduced in the enhanced binary PSO to increase the probability of genes to be unselected for the classification. Experimental results on five actual gene expression data sets show that the performance of the proposed approach is superior to other previous related works, as well as to conventional binary PSO tried in this work.
iv
decrease the probability of genes to be selected for the cancer classification. The proposed method was experimentally assessed on five well-known gene expression data sets. In this sense, comparisons with the existing of binary PSO and several PSO-based methods show competitive results.
As a conclusion, 12 benchmark gene expression data sets have been used in this research to test the effectiveness of the proposed intelligent approaches. Overall, experimental results show that the performances of the proposed approaches are superior to previous related works as well as methods experimented in this work in terms of classification accuracy, the number of selected genes, and running times.
v
This thesis is an outcome of the contributions of many people. I would like to express my sincere gratitude and appreciation to my supervisor, namely Professor Dr. Sigeru Omatu for his intelligent guidance, encouragement, patience, motivation, and invaluable suggestion that made this research possible to be successfully completed in short time. I also appreciate his immediate and very thoughtful responses to my studies and life problems. Sincere appreciations and thanks are extended to Professor Dr. Safaai Deris, who proposed me to pursue my studies under supervision of Professor Dr. Sigeru Omatu. Furthermore, kindly thanks are extended to Professor Dr. Hidetomo Ichihashi and Professor Dr. Keinosuke Matsumoto those who have reviewed and commented this thesis in order to improve it. It is also a great pleasure to express my appreciation to Associate Professor Dr. Michifumi Yoshioka and all other members of the Intelligent Signal Processing Laboratory for their kind help and friendship in many aspects of this research and my life in Japan.
In addition, I would like to take this opportunity to thank Universiti Teknologi Malaysia for permission to fully allow my studies in Osaka Prefecture University, Japan. I also owe a great debt to Malaysian Ministry of Higher Education and Universiti Teknologi Malaysia for the scholarships of my studies. My sincere appreciation also goes to all the people that have answered my email queries so promptly, open source communities, Google, and to all those authors who have generously made their publications and lecture notes available online. Special thanks also to Osaka Prefecture University and Universiti Teknologi Malaysia for subscribing the databases of journals, conferences, and lecture notes where I can freely download the articles by online.
On a personal note, I would also like to give my best thanks to my family especially for my wife (Nur Yumni Binti Yahya), parents, grandmother, parents in law, and my supervisor’s wife for their love, help, support, encouragement, and understanding throughout this endeavor. I am greatly indebted to all of them. Above all, the thanks and gratefulness go to my God (ALLAH) for all the good award.
vi
Abstract i
Acknowledgments v
Contents vi
List of Figures xi
List of Tables xiii
List of Abbreviations xvi
List of Appendixes xviii
1 Introduction 1
1.1 Microarrays 1
1.2 Cancer Classification Based on Gene Expression Data 3 1.3 Gene Selection from Gene Expression Data 4
1.4 Problem Statements 6
1.5 Goal and Objectives of the Research 7
1.6 Scopes of the Research 8
1.7 Organization of the Thesis 8
2 A Multi-Objective Genetic Algorithm 10
2.1 Introduction 10
2.2 A Multi-Objective Strategy in Genetic Algorithms 10
2.3 Experimental Results 13
2.3.1 Data sets 13
2.3.2 Experimental setup 14
2.3.3 Result analysis and discussion 14
vii
3.2 The Proposed Approach 20
3.3 Experimental Results 22
3.3.1 Data sets 22
3.3.2 Experimental setup 23
3.3.3 Result analysis and discussion 24
3.4 Summary 28
4 A Cyclic Hybrid Method 29
4.1 Introduction 29
4.2 Previous Works 29
4.3 The Proposed Cyclic Hybrid Method 30
4.3.1 Chromosome representation for C-GASVM 33 4.3.2 A fitness function for C-GASVM 35
4.4 Experiments 35
4.4.1 Data sets 35
4.4.2 Experimental setup 36
4.4.3 LOOCV and test accuracies of selected genes with C-GASVM 37 4.4.4 A list of informative genes for biological usage 39 4.4.5 C-GASVM versus other experimental methods 42 4.4.6 C-GASVM versus previous related works 44
4.5 Summary 47
5 An Iterative Approach 48
5.1 Introduction 48
5.2 The Proposed Iterative Approach Based on GASVM 48
5.3 Experiments 50
5.3.1 Data sets 50
5.3.2 Experimental setup 50
viii
6 A Two-Stage Method 56
6.1 Introduction 56
6.2 The Proposed Two-Stage Method (Filter+MOGASVM) 56 6.2.1 Stage 1: Pre-selecting genes using a filter method 57 6.2.2 Stage 2: Optimizing a gene subset using MOGASVM 58
6.3 Experiments 59
6.3.1 Data sets 59
6.3.2 Experimental setup 59
6.3.3 LOOCV and test accuracies of selected genes with
Filter+MOGASVM 60
6.3.4 Filter+MOGASVM versus other experimental methods 62 6.3.5 Filter+MOGASVM versus previous related works 65
6.4 Summary 67
7 A Three-Stage Method 68
7.1 Introduction 68
7.2 The Proposed Three-Stage Method 68
7.2.1 Stage 1: Pre-selecting genes using a filter method 69 7.2.2 Stage 2: Optimizing a gene subset using MOGASVM 70
7.2.3 Stage 3: Analyzing the frequency of each gene in near-optimal
subsets 70
7.3 Experiments 71
7.3.1 Data sets and experimental setup 71 7.3.2 Classification accuracies of the final subset of informative genes 72 7.3.3 A list of informative genes for biological usage 73 7.3.4 3-SGS versus other previous methods 75
ix
8.1 Introduction 80
8.2 The Conventional Version of Binary PSO (BPSO) 81
8.2.1 Investigating the drawbacks of BPSO and previous PSO-based
methods 82
8.3 A Modification of Binary PSO with Introduced Particle's Speed and a
Novel Rule (IPSO) 84
8.3.1 The calculation of the distance of two particles’ positions 86
8.3.2 Fitness functions 87
8.4 Experiments 88
8.4.1 Data sets and experimental setup 88 8.4.2 Experimental results and discussion 90
8.5 Summary 97
9 Enhanced Binary Particle Swarm Optimization with the Constraint of
Particle’s Velocities 98
9.1 Introduction 98
9.2 An Enhancement of Binary Particle Swarm Optimization Based on the
Constraint of Particle’s Velocities (CPSO) 98
9.3 Experimental Results 101
9.3.1 Data sets and experimental setup 101 9.3.2 Result analysis and discussion 102
9.4 Summary 107
10 Improved Binary Particle Swarm Optimization Based on a Modified
Sigmoid Function 108
10.1 Introduction 108
10.2 An Improvement of Binary Particle Swarm Optimization with a Modified
Sigmoid Function (SPSO) 108
x
10.4 Summary 117
11 Conclusions 118
11.1 Introduction 118
11.2 Conclusion Remarks 118
11.3 Direction for Future Works 119
Appendixes 120
xi
1.1 The matrix of gene expression data. 2
1.2 The model of cancer classification. 3
1.3 The categories of gene selection methods. 5 2.1 The n-dimensional decision space maps to the m-dimensional objective space. 11
3.1 The algorithm GASVM-II+MOGASVM. 21
3.2 A relation between the classification accuracies and the numbers of selected genes on the lung data set (10 runs on average). 25
3.3 A relation between the classification accuracies and the numbers of selected genes on the MLL data set (10 runs on average). 25
4.1 The flowchart of C-GASVM. 31
4.2 The algorithm of C-GASVM. 32
4.3 A relation between the number of subsets y and the number of selected genes x
from the total number of genes M. 33
4.4 Integer chromosome representation in C-GASVM. 34 4.5 The scatter graph of the two-genes in the best subset of the leukemia data set 40
5.1 The general flowchart of I-MOGASVM. 49
6.1 General flowcharts of (a) previous works (GASVM-based methods); (b) the
present work (Filter+MOGASVM). 57
7.1 The proposed three-stage method (3-SGS). 69
8.1 The pseudo code of BPSO. 83
8.2
The areas of (P x tid( )= and ( ( ) 1)0) P x tid = based on sigmoid functions in (a) IPSO; (b) BPSO.
87
8.3 A relation between the average of fitness values (10 runs on average) and the number of generations for IPSO and BPSO. 93
9.1
The areas of (P x tid( )= and ( ( ) 1)0) P x tid = based on sigmoid functions in (a) CPSO; (b) BPSO.
xii 10.1
The areas of unsatisfied ( )s ti ≥ ( ( ) 0)0, P x tid = and ( ( ) 1)P x tid = in (a) SPSO; (b) BPSO.
110
10.2 A relation between the average of fitness values (10 runs on average) and the number of generations for SPSO and BPSO. 113
xiii
2.1 The summary of gene expression data sets. 13
2.2 Classification accuracies for different gene subsets using MOGASVM on the leukemia and colon data sets (10 runs on average). 15
2.3 Classification accuracies for different gene subsets using MOGASVM on the lung and MLL data sets (10 runs on average). 16
2.4
The results of the best subsets in 10 runs ( w1=0.8 and w2 =0.2 of the leukemia data set, w1=0.7and w2 =0.3 of the colon, lung, and MLL data sets).
17
2.5 The benchmark of MOGASVM with GASVM (single-objective) and SVM on
the leukemia and colon data sets. 17
2.6 The benchmark of MOGASVM with GASVM (single-objective) and SVM on
the lung and MLL data sets. 18
3.1 Parameters of the proposed approach (GASVM-II+MOGASVM). 23
3.2 Classification accuracies for different gene subsets GASVM-II+MOGASVM
(10 runs on average). 24
3.3 The result of the best gene subsets in 10 runs. 26
3.4 The benchmark of GASVM-II+MOGASVM with GASVMs and SVM on the
leukemia and colon data sets. 26
3.5 The benchmark of GASVM-II+MOGASVM with GASVMs and SVM on the
lung and MLL data sets. 27
4.1 Parameter settings for C-GASVM. 36
4.2 Classification accuracies for each run using C-GASVM. 38 4.3 The list of informative genes in the best gene subsets. 41 4.4 The benchmark of C-GASVM with other experimental method. 43
4.5 The comparison between C-GASVM and other previous GASVM-based
methods. 46
xiv
5.4 The benchmark of the proposed I-GASVM with the other experimental methods and previous related work on the leukemia and lung cancer data sets. 53
5.5 The benchmark of the proposed I-GASVM with the other experimental methods and previous related work on the MLL and colon cancer data sets. 54 6.1 Parameter settings for Filter+MOGASVM. 60 6.2 Classification accuracies using Filter+MOGASVM on the lung data set. 61 6.3 Classification accuracies using Filter+MOGASVM on the MLL data set. 61 6.4 Classification accuracies using Filter+MOGASVM on the leukemia data set. 62
6.5 The benchmark of Filter+MOGASVM with Filter+GASVM and the previous
methods on the leukemia data set. 63
6.6 The benchmark of Filter+MOGASVM with Filter+GASVM and the previous methods on the lung and MLL data sets. 64
6.7 The comparison between the proposed method (Filter+MOGASVM) and other
previous GASVM-based methods. 65
7.1 An example to obtain the frequency of each genes (assume that the maximum
number of cycles is five). 71
7.2 Parameter settings for 3-SGS. 72
7.3 The list of informative genes in the final gene subsets. 74
7.4 The benchmark of 3-SGS with previous methods on the leukemia and colon
data sets. 75
7.5 The benchmark of 3-SGS with previous methods on the MLL data set. 76 7.6 The benchmark of 3-SGS with previous methods on the SRBCT data set. 77 7.7 The benchmark of 3-SGS with previous methods on the lung data set. 77 8.1 The description of 10 gene expression data sets. 88 8.2 Parameter settings for IPSO and BPSO. 89
8.3 Experimental results for each run using IPSO on the 11_Tumors, 9_Tumors, Brain_Tumor1, and Brain_Tumor2 data sets. 90
8.4 Experimental results for each run using IPSO on the Leukemia1, Leukemia2,
xv
8.6 Comparative experimental results of IPSO and BPSO. 94 8.7 A comparison between IPSO and previous PSO-based methods. 95 9.1 Parameter settings for CPSO and BPSO. 101
9.2 Experimental results for each run using CPSO on the leukemia, colon, and lung
data sets. 102
9.3 Experimental results for each run using CPSO on the MLL and SRBCT data
sets. 103
9.4 Comparative experimental results of CPSO and BPSO. 105 9.5 A comparison between CPSO and previous PSO-based methods. 106 10.1 Parameter settings for SPSO and BPSO. 111
10.2 Experimental results for each run using SPSO on the leukemia, colon, and lung
data sets. 114
10.3 Experimental results for each run using SPSO on the MLL and SRBCT data
sets. 114
10.4 Comparative experimental results of SPSO and BPSO. 115 10.5 A comparison between SPSO and previous PSO-based methods. 116
xvi 3-SGS A three-stage method
ADCA Adenocarcinoma ALL Acute lymphoblastic leukemia
AML Acute myeloid leukemia
BPSO The conventional version of binary particle swarm optimization
C-GASVM A cyclic hybrid method
CPSO An enhancement of binary particle swarm optimization with the proposed constraint of particle’s velocities
DLBCL Diffuse large B-cell lymphomas Filter+MOGASVM A two-stage method
GA Genetic algorithm
GASVM A hybrid of genetic algorithms and support vector machines GASVM-II GASVM version II
GASVM-II+MOGASVM A combination between GASVM-II and MOGASVM GPSO Geometric particle swarm optimization
GR Gain ratio
IG Information gain
I-MOGASVM An interactive approach based on MOGASVM IBPSO An improved binary particle swarm optimization
IPSO An improved (modified) binary particle swarm optimization LOOCV Leave-one-out-cross-validation
MOGASVM Multi-objective GASVM
MLL Mixed-lineage leukemia
MOO Multi-objective optimization
MPM Malignant pleural mesothelioma New-GASVM An improved GASVM
xvii
PSOTS A hybrid of PSO and tabu search
SPSO An improvement of binary particle swarm optimization based on a modified sigmoid function
SRBCT Small round blue cell tumors SVM A support vector machine classifier
xviii
Appendix A The list of publications referred in this thesis 120 Appendix B The glossary of structural genomic terms 123
Chapter 1
Introduction
Bioinformatics is defined as an application of computation tools to capture, analyze, and interpret biological data. It is an interdisciplinary field, which harnesses computer science, mathematic, engineering, and biology. It represents a relatively new area of computer science and engineering to handle and manage large amounts of data generated by advance technologies which are designed for measuring biological systems. The use of computational intelligence methods in analyzing the biological data is currently at the forefront of its field and represents a major opportunity in the research of computational intelligence communities.
The problem of cancers in this world is a growing one. A traditional cancer diagnosis relies on a complex and inexact combination of clinical and histopathological data. This classic approach often fails when dealing with atypical tumors or morphologically indistinguishable tumor subtypes. Recent advances in microarrays technology have led to a promising future of cancer diagnosis using new molecular-based approaches. This technology allows scientists to measure the expression levels of thousands of genes simultaneously in biological organisms. The most important application of gene expression data that are produced by the microarrays technology is the selection of informative genes for cancer classification. For quick reference, a glossary of structural genomic terms is also provided in Appendix B.
1.1 Microarrays
Microarrays technology is a machine that can be used to measure the expression levels of thousands of genes simultaneously under different cancerous or normal samples [22]. Microarrays experiments are used to gather information from tissue and cell samples about gene expression differences that are useful in diagnosing diseases [9]. It produces gene
M genes N samples g1,2 g1,M l1 g1,1 g2,1 g2,2 g2,M l2 gN,1 gN,2 gN,M lN Class label ( 1) N M G × + =
expression data as the final product. Therefore, it provides a new way for people to understand molecular behaviors in abnormal tissues and improve classification performances for accurate in cancer diagnosis and treatment. At the same time, the microarrays lead many issues for biologists with the large amount of data generated [37]. These issues have required molecular biologists to collaborate with computer scientists who have some experience in the development of intelligent approaches for processing and analyzing the huge amount of data [28]. This research uses gene expression data to select information genes for cancer classification.
Usually, the matrix of gene expression data, GN×(M+1) contains different values of gene expression levels on a large scale. This matrix is organized as shown in Fig. 1.1, where M = the total number of genes in each sample of GN×(M+1),
N = the total number of samples in GN×(M+1),
, i j
g = a numeric value of the gene expression level of the jth gene in the ith sample, 1, 2,.., ;
i= N j=1, 2,..,M,
i
l = a class label for the ith sample, li∈ − + for binary classes and { 1, 1} li∈ + +{ 1, 2,...,+C} for multi-classes where + =C the total number of classes in GN×(M+1).
1.2 Cancer Classification Based on Gene Expression Data
Recently, there are many classifiers such as support vector machines (SVMs), neural networks, etc. have been used for cancer classification of gene expression data. Based on the favorable results of SVMs from previous works [6],[9],[28], this research uses SVMs to classify cancer classes. Moreover, SVMs have many advantages such as flexibility in choosing a similarity function, sparseness of solution when dealing with large data, the ability to handle large feature space, and the ability to identify outliers [6]. The detail of SVMs can be found on in Mukherjee’s thesis [28].
A cancer classification model has two phases: 1) Gene selection; and 2) classification [10]. The first phase uses a gene selection method to select genes, while in the phase stage; a classifier is implemented to perform classification process. Figure 1.2 shows the model of cancer classification.
Fig. 1.2. The model of cancer classification.
Most previous works widely used two manners for measuring the accuracy of cancer classification. The manners are the leave-one-out-cross-validation (LOOCV) procedure to obtain LOOCV accuracy, and test accuracy measurement to produce test accuracy. For the LOOCV procedure, one sample from the training set is excluded, and the rest of training samples, N-1 are used to build a classifier. Then, the built classifier is used to predict the class that has been left out, and this process is repeated for each sample in the training set. The LOOCV accuracy is obtained by the overall number of correct classifications, divided by the number of samples in the training set, N. For the test accuracy measurement, the final
Phase 1: Gene selection
Phase 2: Classification Gene expression
data Selected genes
classifier is built using all the training samples, and the classes of test samples from the testing set are classified one by one using the built classifier. The test accuracy is estimated by the number of the correctly classified test samples, divided by the number of samples in the testing set. In this research, the LOOCV procedure is used for measuring classification accuracy on the training set due to the small number of samples in gene expression data, and most previous works also used it; whereas for the calculation of classification accuracy on the testing set, the test accuracy measurement is used.
1.3 Gene Selection from Gene Expression Data
The selection of a small subset of informative genes from thousands of genes is a critical step for accurate cancer classification. Usually, a gene selection method is used to select a subset of informative genes that maximizes the classifier’s ability to classify samples more accurately [24]. In pattern recognition domain, gene selection is called feature selection. The gene selection has several advantages:
• Maintain or improve classification accuracy. • Reduce the dimensionality of data.
• Yield a small subset of genes. • Remove irrelevant and noisy genes. • Decrease computational times. • Reduce the cost in a clinical setting.
In the context of cancer classification, gene selection methods can be classified into two categories [24]. Figure 1.3 shows the difference between the categories. If a gene selection method is carried out independently from a classification procedure, it belongs to the filter method. Otherwise, it is said to follow a hybrid (wrapper) method. Signal to noise ratio [9],[10], threshold number of misclassification scores [4], cosine coefficient, information gain, and euclidean distance [7] are some of the widely known the filter method. The hybrid method is performed dependently on classifiers and conducted in search space for selecting and evaluating subsets of genes. In this approach, a classifier is included as a part of its
evaluation function. Furthermore, it performs some form of state space searches to select genes in order to maximize the evaluation function. This evaluation process is repeated until a condition has been satisfied.
Fig. 1.3. The categories of gene selection methods.
In the early era of microarrays analyses, most previous works have used the filter method to select genes since it is computationally more efficient than the hybrid method [3],[11],[19],[36]. Many filter methods are normally mentioned as individual gene-ranking methods. Usually, they evaluate a gene based on its discriminative power for the target classes without considering its correlations with other genes. This mechanism may result in inclusion of irrelevant and noisy genes in a gene subset for the cancer classification. These genes increase the dimensionality of the gene subset, and in turn affect the classification performance. A few years ago, several hybrid methods, especially a hybrid of genetic algorithms (GAs) and classifiers, have been implemented to select informative genes [8],[23],[26],[31]. Recently, several gene selection methods based on particle swarm optimization (PSO) have been proposed to replace GA in the hybrid method. PSO is a new population based stochastic optimization technique proposed by Kennedy and Eberhart [14]. It is motivated from the simulation of social behaviors of organisms such as bird flocking and
Genes selection
Gene expression data Gene expression data
Genes subset generation
Classifier Classifier
Gene subset Near-optimal gene subset
Genes Evaluation Gene selection
fish schooling. The hybrid methods usually provide greater accuracy than the filter methods since genes are selected by considering and optimizing correlations among genes.
1.4 Problem Statements
Although the mechanism of cancer classifications has improved over the past 30 years, there has been no general and perfect approach for identifying new cancer classes or assigning tumors to known classes [10]. It is because there can be so many pathways causing cancer. The traditional methods of cancer classifications are mostly dependent on the morphological appearance of tumors and their applications are limited by existing uncertainties [10]. Moreover, the methods also have various limitations especially in discriminating between two similar types of cancers. Therefore, microarrays technology has been introduced to solve the limitations of the methods by offering ability to measure the gene expression levels of thousands of genes simultaneously in biological organisms such as human and animal. Due to the large amount of gene expression data generated by the microarrays technology, computational intelligence approaches are needed to analyze and process the data.
Almost all the computational intelligence approaches for the cancer classification of gene expression data started with gene selection methods [7]. Thus, there is a need to firstly select informative genes that contribute to a cancerous state by using gene selection methods [26] in order to maximize the classifier’s ability to classify samples more accurately. An informative gene is a gene that is useful for cancer classification. However, the gene selection process poses a major challenge because of the following characteristics of gene expression data: The huge number of genes compared to the small number of samples (high-dimensional data), irrelevant genes, and noisy data.
1.5 Goal and Objectives of the Research
The ultimate goal of this research is to propose intelligent approaches based on GAs and PSO for selecting a small (near-optimal) subset of informative genes from gene expression data for cancer classification. In order to reach the goal, several objectives need to be achieved:
• To propose a multi-objective strategy in GASVM for improving the performance of GASVM that uses a single-objective approach.
• To propose an approach using two hybrid methods in order to reduce the complexity of data and optimize genes subsets.
• To propose a cyclic hybrid method based on GASVM-II for repeatedly reducing the dimensionality of data and producing potential gene subsets.
• To propose an iterative approach based on MOGASVM in order to decrease the complexity of data.
• To propose a two-stage method using a filter method and a hybrid method for preselecting and optimizing gene subsets, respectively.
• To propose a three-stage method that includes frequency analysis in its third stage in order to identify the most frequently selected genes in near-optimal gene subsets. • To propose a modification of binary particle swarm optimization based on introduced
particle's speed and a novel rule in order to overcome the limitations of the conventional version of binary PSO.
• To propose an enhancement of binary PSO with the constraint of particle’s velocities for increasing the probability of genes to be unselected for cancer classification.
• To propose an improvement of binary particle swarm optimization based on a modified sigmoid function and introduced particle's speed in order to solve the weaknesses of the conventional version of binary PSO and previous PSO-based methods.
1.6 Scopes of the Research
Since the goal of this research is to introduce and propose intelligent approaches in selecting a small subset of informative genes for cancer classification, the scopes of this research are stated as follows:
• Focusing on the modifications and enhancements of GASVM-based methods and PSO-based methods for selecting genes from gene expression data.
• Using and applying SVMs to classify samples from genes subsets that produced by GASVM-based methods and PSO-based methods.
• Conducting experiments on 12 public and benchmark gene expression data sets that contain binary classes and multi-classes: Colon, leukemia (Leukemia1), lung, MLL (Leukemia2), SRBCT, 11_Tumors, 9_Tumors, Brain_Tumor1, Brain_Tumor2, Lung_Cancer, Prostate_Tumor, and DLBCL. These data sets can be freely accessed by online and will be explained in the next chapters.
1.7 Organization of the Thesis
This thesis is organized into 11 chapters. The general information of each chapter is given as follows:
• Chapter 1 introduces main keywords that used in this research such as GAs, PSO, gene selection, microarrays, gene expression data, and cancer classification. It also describes about problem statements, goal, and scopes of this research.
• Chapter 2 describes a multi-objective strategy in GASVM (MOGASVM) for gene selection. It is proposed to improve the performance of GASVM that uses a single-objective approach. In this strategy, multi-single-objective problems have been accommodated by using a specialized fitness function in GAs.
• Chapter 3 discusses an approach using two hybrid methods. These hybrid methods are MOGASVM and GASVM-II. It was developed to overcome the limitations of MOGASVM and GASVM-II that developed separately before.
• Chapter 4 describes a cyclic hybrid method based on GASVM-II. Generally, this method repeats the process of GASVM-II to produce potential gene subsets and reduce the dimensionality of data repeatedly.
• Chapter 5 concerns on the discussion of an iterative approach based on MOGASVM. Basically, it is almost completely the same with the proposed cyclic hybrid, but it uses MOGASVM to replace GASVM-II.
• Chapter 6 discusses a two-stage method. It is proposed by using a filter method and a hybrid method to surmount the drawbacks of GASVM-based methods in previous related works.
• Chapter 7 describes a three-stage method that includes frequency analysis as an extra process in the last stage. This frequency analysis is implemented to identify the most frequently selected genes in near-optimal gene subsets.
• Chapter 8 introduces a modification of binary PSO. A scalar quantity called particle’s speed and a novel rule for updating particle’s positions are introduced in this modified binary PSO.
• Chapter 9 discusses an enhancement of binary PSO. The constraint of particle’s velocities is introduced in the enhanced binary PSO to increase the probability of genes to be unselected for the classification.
• Chapter 10 describes a modification of binary PSO. A modified sigmoid function and the particle’s speed are implemented in this modified binary PSO. Both the implementations decrease the probability of genes to be selected for the cancer classification.
• Chapter 11 gives the conclusion remarks of obtained results of all the proposed intelligent approaches, and suggests interesting ideas for the future research.
Chapter 2
A Multi-Objective Genetic Algorithm
2.1
Introduction
Multi-objective optimization (MOO) is an optimization problem that involves multiple objectives or goals. Generally, the objectives estimate different aspects of solutions. It is necessary to be aware that gene selection is a MOO problem in the sense of classification accuracy maximization and gene subset size minimization. Therefore, Chapter 2 describes and proposes a multi-objective strategy in GASVM for gene selection and the classification of gene expression data. This is known as MOGASVM.
2.2
A Multi-Objective Strategy in GAs
MOGASVM was developed to improve the performance of GASVM that uses a single-objective [23]. All information about GASVM such as flowcharts, algorithms, chromosome representations, fitness functions, and parameter values are available in Mohamad et al. [23].
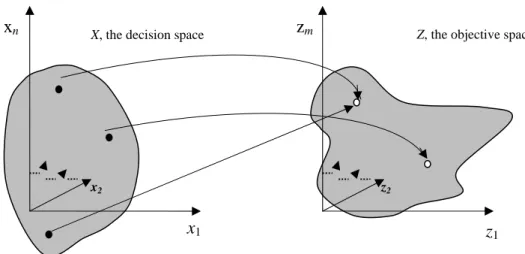
In the sense of classification accuracy maximization and gene subset size minimization, gene selection can be viewed as an MOO problem. Formally, each gene subset (a solution) is represented by x (an n-dimensional decision vector). It is associated with a vector objective function f x : ( )
1 2
( ) ( ( ), ( ),..., m( ))
f x = f x f x f x (2.1)
with x=( ,x x1 2,...,xn)∈X where X is the decision space, i.e., the set of all expressible solutions. The vector objective function f x maps ( ) X into ℜ , where m ℜ is the objective
space and m≥2 is a number of objectives. f is the i ith objective. The vector z= f x( ) is an
objective vector. The image of X in the objective space is the set of all attainable points z (Fig. 2.1). If all objective functions are for maximization, a subset x is said to dominate another x ( x∗) if and only if:
x> if x∗
{1,..., }, i( ) i( ) {1,..., }, j( ) j( )
i m f x f x∗ j m f x f x∗
∀ ∈ ≥ ∧ ∃ ∈ >
Fig. 2.1. The n-dimensional decision space maps to the m-dimensional objective space.
A solution (gene subset) is said to be Pareto optimal if it is not dominated by any other solutions in the decision space. A Pareto optimal solution cannot be improved with respect to any objective without worsening at least one other objective. The set of all feasible nondominated solutions in X is referred to as the Pareto optimal set, and for a given Pareto optimal set, the corresponding objective function values in the objective space are called the Pareto front [12].
The Pareto front in this research is defined as the set of nondominated gene subsets. MOGASVM is one promising approach to find or approximate the Pareto front. The roles of this approach are guided by the search towards the Pareto front while keeping the nondominated solutions as diverse as possible. Therefore, the original GASVM is customized
z1
x1
xn X, the decision space zm
x2 z2
to accommodate multi-objective problems by using specialized fitness functions. The ultimate goal of MOGASVM is to identify a nondominated gene subset Pareto front. This subset (individual) is evaluated by its accuracy on the training data and the number of genes selected in it. These criteria are denoted as f and 1 f separately, and are used in a fitness 2 function. Therefore, the fitness of individuals is calculated by Eq.(2.4) as follows:
1 1 ( ) f =w ×A x (2.2) 2 2 (( ( )) / ) f =w × M −R x M (2.3) 1 2 ( ) fitness x = + f f (2.4)
where ( ) [0,1]A x ∈ is the leave-one-out-cross-validation (LOOCV) accuracy of the training data using only the expression values of the selected genes in a subset x where ( ), R x is the number of selected genes in x. M is the total number of genes, w and 1 w are two priority 2 weights corresponding to the importance of the accuracy and the number of selected genes, respectively, where w1∈[0.1, 0.9] and w2 = − , and 1 w1 f is calculated as above in order to 2 support the maximization function of the minimization of gene subset size. In this research, the accuracy is more important than the number of selected genes (gene subset size).
Ambroise and McLachlan [2] have indicated that because of “selection bias”, the test results could be over-optimistic if the test samples were not excluded from the classifier building process in a hybrid approach. Therefore, the proposed MOGASVM totally excludes the test samples from the classifier building process in order to avoid the influence of the bias.
2.3
Experimental Results
2.3.1 Data sets
Two benchmark gene expression data sets are used to evaluate the proposed approach; leukemia cancer, colon, lung cancer, and mixed-lineage leukemia (MLL) cancer. Table 2.1 summarizes the data sets.
Table 2.1. The summary of gene expression data sets.
Data set No. classes
No. samples in the training set
No. samples in the test set
No. genes Source Leukemia 2 (ALL and AML) 38 (27 ALL and 11 AML) 34 (20 ALL and 14 AML) 7,129 http://www.broad.mit. edu/cgi-bin/cancer/datasets.cgi Lung 2 (MPM and ADCA) 32 (16 MPM and 16 ADCA) 149 (15 MPM and 134 ADCA) 12,533 http://chestsurg.org/pu blications/2002-microarray.aspx. MLL 3 (ALL, MLL, and AML) 57 (20 ALL, 17 MLL, and 20 AML) 15 (4 ALL, 3 MLL, and 8 AML) 12,582 http://www.broad.mit. edu/cgi-bin/cancer/datasets.cgi Colon 2 (Normal and tumor) 62 (22 normal
and 40 tumor) Not available 2,000
http://microarray.princ eton.edu/oncology/aff ydata/index.html Note:
MPM = malignant pleural mesothelioma. ADCA = adenocarcinoma.
ALL = acute lymphoblastic leukemia.
MLL = mixed-lineage leukemia. AML = acute myeloid leukemia.
For the leukemia, Lung, and MLL cancer data set, the LOOCV procedure is applied on the training set to obtain LOOCV accuracies, and the accuracy test measurement is applied on the testing set to measure test accuracy. However, for the colon cancer data set, only the LOOCV procedure is used because this data set only has the training set.
2.3.2 Experimental setup
Three important criteria are used to evaluate the MOGASVM performances; test accuracy, LOOCV accuracy, and the number of selected genes.
The experimental results presented in this section pursue two objectives. The first objective is to show that gene selection using MOGASVM is needed in order to reduce the number of genes and achieve better classification of the gene expression data. The second objective is to show that MOGASVM is better than the original version of GASVM that used a single-objective approach. To achieve these objectives, several experiments were conducted, 10 times each, for both data sets using different values of w and 1 w (2 w1∈[0.1, 0.9] and
2 1 1
w = − ). The subset that produces the highest LOOCV accuracy with the lowest number w of selected genes is chosen as the best subset. SVM, GASVM (single-objective), and GASVM version 2 (GASVM-II) were also used in this research as a comparison with MOGASVM. GASVM-II has been proposed by Mohamad et al. [23].
2.3.3 Result analysis and discussion
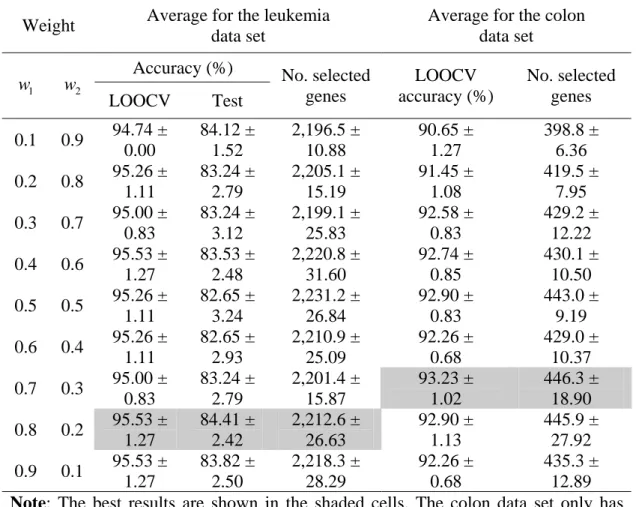
Table 2.2 and Table 2.3 show the results of the experiments for all the data sets using different values of w and 1 w A value of the form x2. ± represents an average value y x with a standard deviation .y Overall, the classification accuracy and the number of selected genes for both data sets fluctuated because of the diversity of the solutions based on adjusted weights (w and 1 w ). Moreover, multiple objectives search simultaneously in a run, and 2 consequently populations tend to converge to the solutions which are superior in one objective, but poor at others. The highest averages of LOOCV and test accuracies for classifying leukemia samples were 95.53% and 84.41%, respectively, using w1=0.8 and
2 0.2,
w = while 93.23% LOOCV accuracy was obtained for the colon data set using w1=0.7 and w2 =0.3. The highest averages of LOOCV accuracy and test accuracy for classifying the
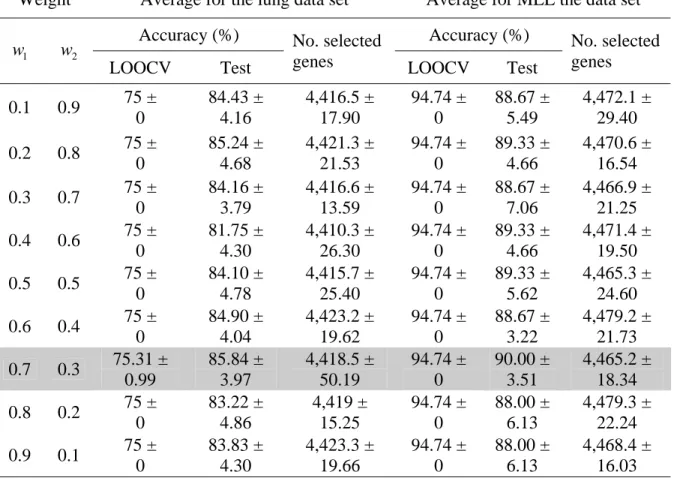
the MLL data set. The highest averages of the accuracies of both the data sets were obtained by using w1=0.7 and w2 =0.3.
Table 2.2. Classification accuracies for different gene subsets using MOGASVM on the leukemia and colon data sets (10 runs on average).
Weight Average for the leukemia data set
Average for the colon data set Accuracy (%) 1 w w 2 LOOCV Test No. selected genes LOOCV accuracy (%) No. selected genes 0.1 0.9 94.74 ± 0.00 84.12 ± 1.52 2,196.5 ± 10.88 90.65 ± 1.27 398.8 ± 6.36 0.2 0.8 95.26 ± 1.11 83.24 ± 2.79 2,205.1 ± 15.19 91.45 ± 1.08 419.5 ± 7.95 0.3 0.7 95.00 ± 0.83 83.24 ± 3.12 2,199.1 ± 25.83 92.58 ± 0.83 429.2 ± 12.22 0.4 0.6 95.53 ± 1.27 83.53 ± 2.48 2,220.8 ± 31.60 92.74 ± 0.85 430.1 ± 10.50 0.5 0.5 95.26 ± 1.11 82.65 ± 3.24 2,231.2 ± 26.84 92.90 ± 0.83 443.0 ± 9.19 0.6 0.4 95.26 ± 1.11 82.65 ± 2.93 2,210.9 ± 25.09 92.26 ± 0.68 429.0 ± 10.37 0.7 0.3 95.00 ± 0.83 83.24 ± 2.79 2,201.4 ± 15.87 93.23 ± 1.02 446.3 ± 18.90 0.8 0.2 95.53 ± 1.27 84.41 ± 2.42 2,212.6 ± 26.63 92.90 ± 1.13 445.9 ± 27.92 0.9 0.1 95.53 ± 1.27 83.82 ± 2.50 2,218.3 ± 28.29 92.26 ± 0.68 435.3 ± 12.89 Note: The best results are shown in the shaded cells. The colon data set only has LOOCV accuracy since it only has the training set.
A total of 2212.6 average genes in a subset were finally selected to obtain the highest accuracies (LOOCV and test) of the leukemia data set, whereas 446.3 average genes were selected of the colon data set. The averages genes of the lung and MLL data sets were 4418.5 and 4465.2 genes, respectively. Hence, the subsets were chosen as the best subsets. The best subsets are called the best-known Pareto front because it is close to the true Pareto front.
MOGASVM has found the best subsets since it distributed successfully diverse gene subsets over a solution space.
Table 2.3. Classification accuracies for different gene subsets using MOGASVM on the lung and MLL data sets (10 runs on average).
Weight Average for the lung data set Average for MLL the data set
Accuracy (%) Accuracy (%)
1
w w 2
LOOCV Test
No. selected
genes LOOCV Test
No. selected genes 0.1 0.9 75 ± 0 84.43 ± 4.16 4,416.5 ± 17.90 94.74 ± 0 88.67 ± 5.49 4,472.1 ± 29.40 0.2 0.8 75 ± 0 85.24 ± 4.68 4,421.3 ± 21.53 94.74 ± 0 89.33 ± 4.66 4,470.6 ± 16.54 0.3 0.7 75 ± 0 84.16 ± 3.79 4,416.6 ± 13.59 94.74 ± 0 88.67 ± 7.06 4,466.9 ± 21.25 0.4 0.6 75 ± 0 81.75 ± 4.30 4,410.3 ± 26.30 94.74 ± 0 89.33 ± 4.66 4,471.4 ± 19.50 0.5 0.5 75 ± 0 84.10 ± 4.78 4,415.7 ± 25.40 94.74 ± 0 89.33 ± 5.62 4,465.3 ± 24.60 0.6 0.4 75 ± 0 84.90 ± 4.04 4,423.2 ± 19.62 94.74 ± 0 88.67 ± 3.22 4,479.2 ± 21.73 0.7 0.3 75.31 ± 0.99 85.84 ± 3.97 4,418.5 ± 50.19 94.74 ± 0 90.00 ± 3.51 4,465.2 ± 18.34 0.8 0.2 75 ± 0 83.22 ± 4.86 4,419 ± 15.25 94.74 ± 0 88.00 ± 6.13 4,479.3 ± 22.24 0.9 0.1 75 ± 0 83.83 ± 4.30 4,423.3 ± 19.66 94.74 ± 0 88.00 ± 6.13 4,468.4 ± 16.03 Note: The best results are shown in the shaded cells.
Table 2.4. The results of the best subsets in 10 runs (w1=0.8 and w2 =0.2 of the leukemia
data set, w1 =0.7and w2 =0.3 of the colon, lung, and MLL data sets).
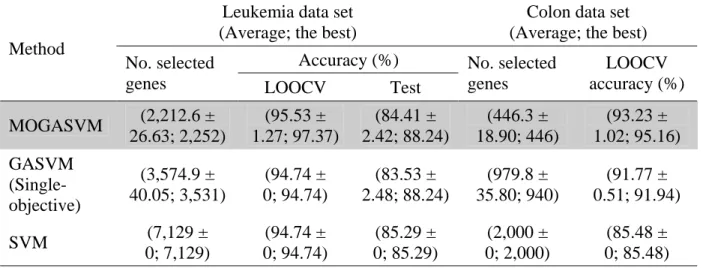
Table 2.5. The benchmark of MOGASVM with GASVM (single-objective) and SVM on the leukemia and colon data sets.
Leukemia data set (Average; the best)
Colon data set (Average; the best) Accuracy (%)
Method
No. selected
genes LOOCV Test
No. selected genes LOOCV accuracy (%) MOGASVM (2,212.6 ± 26.63; 2,252) (95.53 ± 1.27; 97.37) (84.41 ± 2.42; 88.24) (446.3 ± 18.90; 446) (93.23 ± 1.02; 95.16) GASVM (Single-objective) (3,574.9 ± 40.05; 3,531) (94.74 ± 0; 94.74) (83.53 ± 2.48; 88.24) (979.8 ± 35.80; 940) (91.77 ± 0.51; 91.94) SVM (7,129 ± 0; 7,129) (94.74 ± 0; 94.74) (85.29 ± 0; 85.29) (2,000 ± 0; 2,000) (85.48 ± 0; 85.48) Note: The best results are shown in the shaded cells.
Data set LOOCV (%) Test (%) Experiment no. No. selected genes
Leukemia 97.37 88.24 4 2,252
Colon 95.16 - 7 446
Lung 78.13 93.29 7 4,433
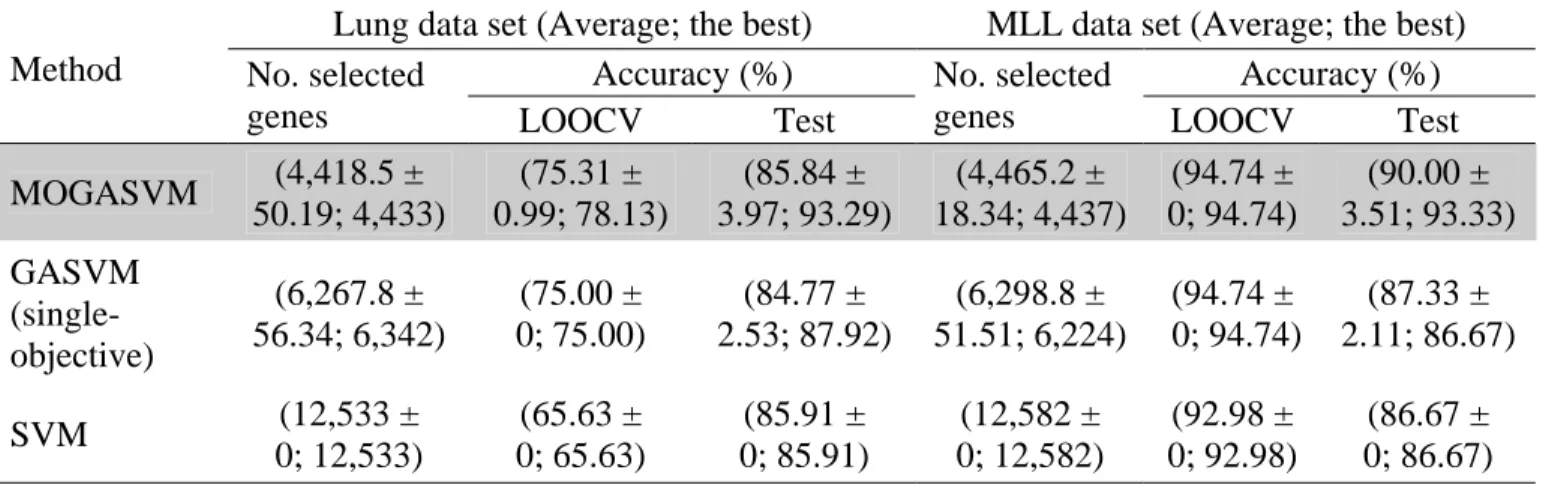
Table 2.6. The benchmark of MOGASVM with GASVM (single-objective) and SVM on the lung and MLL data sets.
Lung data set (Average; the best) MLL data set (Average; the best)
Accuracy (%) Accuracy (%)
Method No. selected
genes LOOCV Test
No. selected
genes LOOCV Test
MOGASVM (4,418.5 ± 50.19; 4,433) (75.31 ± 0.99; 78.13) (85.84 ± 3.97; 93.29) (4,465.2 ± 18.34; 4,437) (94.74 ± 0; 94.74) (90.00 ± 3.51; 93.33) GASVM (single-objective) (6,267.8 ± 56.34; 6,342) (75.00 ± 0; 75.00) (84.77 ± 2.53; 87.92) (6,298.8 ± 51.51; 6,224) (94.74 ± 0; 94.74) (87.33 ± 2.11; 86.67) SVM (12,533 ± 0; 12,533) (65.63 ± 0; 65.63) (85.91 ± 0; 85.91) (12,582 ± 0; 12,582) (92.98 ± 0; 92.98) (86.67 ± 0; 86.67) Note: The best results are shown in the shaded cells.
All LOOCV results of the leukemia data set were much higher than the test results due to the problem of over-fitting. The data set properties, i.e., thousands of genes with less than a hundred samples in the training sets, probably cause the over-fitting, where a decision surface of the classifier performs well on the training set, but poorly on the test set.
Table 2.4 shows that the best performances (LOOCV and test accuracies) were 97.37% and 88.24%, respectively, for the leukemia data set using 2252 genes. For the colon data set, the highest LOOCV accuracy was 93.55% using 446 genes. The best performances for the leukemia and colon data sets were found in the fourth and seventh experiments, respectively, while for the lung and MLL data sets, the best performances have been found in the seventh experiments.
In Tables 2.5 and 2.6, the LOOCV accuracy, the test accuracy, and the number of selected genes are given in parentheses. The average results are given in the parentheses and the best results are highlighted in the shaded cells. This table shows that the performances of MOGASVM were better than that of GASVM and SVM in terms of the LOOCV accuracy, the test accuracy, and the number of selected genes on average and for the best results. In general, MOGASVM reduces the number of genes to about a quarter of the total, whereas GASVM reduces the number to about a half of the total. This is due to the ability of MOGASVM to search different regions of a solution space simultaneously, and therefore, it is possible to find a diverse set of solutions in a high-dimensional space. Moreover, it may
also exploit the structures of good solutions with respect to different objectives to create new nondominated solutions in unexplored parts of the Pareto optimal set. This suggests that gene selection using the multi-objective approach is needed for disease classification of gene expression data.
2.4
Summary
In this chapter, MOGASVM has been designed, developed, and analyzed to solve gene selection problems. By performing experiments on MOGASVM, the present work found that the classification accuracy and the number of selected genes for both data sets fluctuated and were not equal when using different values of w and 1 w . This result shows that there are 2 many irrelevant genes in gene expression data, and some of them act negatively on the accuracy acquired by the relevant genes. Generally, MOGASVM achieved significant LOOCV accuracy, test accuracy, and the number of selected genes, and was better than GASVM (single-objective) and SVM because its multi-objective strategy could find a diverse solution in a Pareto optimal set. MOGASVM can also be extended to other applications such as pattern recognitions, computer visions, and cognitive sciences. However, MOGASVM did not achieve the greatest accuracy, and the number of selected genes was still high. Therefore, the next chapter (Chapter 3) will propose GASVM-II+MOGASVM to reduce the number of selected genes and increase classification accuracy.
Chapter 3
An Approach Using Two Hybrid Methods
3.1
Introduction
Mohamad et al. [23] have reported that a hybrid of GAs and SVMs (GASVM), and also an improved GASVM called GASVM-II which has both advantages and disadvantages. This present work proposes a new approach called GASVM-II+MOGASVM which utilizes the advantages of MOGASVM and GASVM-II. The advantage of MOGASVM is that it can automatically select and optimize a number of genes to produce a gene subset. However, it performs poorly with high-dimensional data. In contrast, GASVM-II performs well with high-dimensional data. It can also reduce the complexity of search spaces, and may be able to evaluate all possible subsets of genes. Nevertheless, the drawback of GASVM-II is that it selects a number of genes manually to yield a gene subset. Therefore, this chapter proposes and describes an approach using two hybrid methods for selecting informative genes. It is developed to improve the performances of MOGASVM and GASVM-II.
3.2
The Proposed Approach
Figure 3.1 shows that the flowchart of GASVM-II+MOGASVM involves two phases. In the first phase, GASVM-II is applied to manually select genes from the overall gene expression data in order to produce a subset of genes. It is used to reduce the dimensionality of the data, and therefore, the complexity of the search or solution spaces can also be decreased.
Fig.3.1. The flowchart of GASVM-II+MOGASVM.
In the second phase, MOGASVM is used to select and optimize a small subset of informative genes from the subset that is produced by the first phase. If the size of the subset is small and the combination of genes is not complex, MOGASVM can easily find and optimize the subset. MOGASVM is applied because it can automatically select a number of
Phase 2 (MOGASVM)
Generate initial population based on the total number of genes in the subset produced by the phase 1.
Chromosomes (genes subsets) with binary representations
1 2
( ) ( ) ( ( ( )) / )
fitness x =w ×A x + w × M−R x M
Selection method (roulette wheel selection)
Crossover (two-point) and mutation (flip) A near-optimal subset of genes Yes No Final generation?
Classify the near-optimal subset using SVMs
Choose a number of selected genes
Generate initial population based on the number of selected genes
Chromosomes (genes subsets) with integer representations
Gene expression data
1 2
( ) ( ) ( ( ( )) / )
fitness x =w×A x + w × M−R x M
Selection method (roulette wheel selection)
Crossover (two-point) and mutation (gaussian) Final generation? A subset of genes Yes No Phase 1 (GASVM-II)
genes and finally produce an optimized gene subset. This second phase can also remove noisy genes because the first phase has reduced the size and complexity of the search spaces. The fitness of individuals is calculated as follows:
1 2
( ) ( ) ( ( ( )) / )
fitness x =w ×A x + w × M −R x M (3.1)
in whichA x( ) [0,1]∈ is the LOOCV accuracy on the training data using only the expression values of the selected genes in a subset x, and ( )R x is the number of selected genes in x. M is the total number of genes, and w and 1 w are two priority weights corresponding to the 2 importance of accuracy and the number of selected genes, respectively, where w1∈[0.1, 0.9] andw2 = −1 w1. In this chapter, the accuracy is more important than the number of selected genes.
3.3
Experimental Results
3.3.1 Data set
Four benchmark gene expression data sets are used to evaluate the proposed approach, i.e., those for leukemia cancer, colon cancer, lung, and MLL. The summary of the data sets has been shown on Table 2.1 in Chapter 2. For the leukemia cancer, lung cancer, and MLL cancer data sets, LOOCV is applied on the training set, and an accuracy test measurement is carried out on the test set to measure the classification accuracy. However, for the colon cancer data set, only the LOOCV procedure is used because this data set only has the training set.
3.3.2 Experimental Setup
Table 3.1 contains the parameter values for GASVM-II+MOGASVM. These values are chosen based on the results of preliminary runs. In order of importance, three criteria are considered to evaluate the performances of the proposed approach; test accuracy, LOOCV accuracy, and the number of selected genes.
Table 3.1. Parameters of the proposed approach (GASVM-II+MOGASVM). Data Set
Parameters Leukemia Colon Lung MLL
No. populations 100 100 100 100
No. generations 1000 1000 1000 1000
Replacement rate (Roulette wheel
selection) 0.8 0.8 0.8 0.8
Crossover rate (Two-point) 0.7 0.7 0.7 0.7 Mutation rate (Flip & gaussian) 0.01 0.01 0.01 0.01
1
w 0.8 0.7 0.7 0.7
2
w 0.2 0.3 0.3 0.3
Cost for generalization of SVMs 100 100 0.7 100
The experimental results presented in this section pursue two objectives. The first objective is to show that gene selection using GASVM-II+MOGASVM is needed for better classification of the gene expression data. The second objective is to show that II+MOGASVM is better than GASVMs (single-objective and multi-objective) and GASVM-II. To achieve these objectives, several experiments are conducted on the proposed approach, 10 times on each data set. In the first stage, different numbers of preselected genes are chosen (10, 20, 30,..., 600). Furthermore, in the second stage, GASVM chooses a number of the final selected genes automatically. Lastly, it produces an optimized gene subset that contains the final selected genes. The subset that produces the highest LOOCV accuracy with the least possible number of selected genes is chosen as the best subset. SVM, GASVMs, and GASVM-II were also experimented for comparison with GASVM-II+MOGASVM.
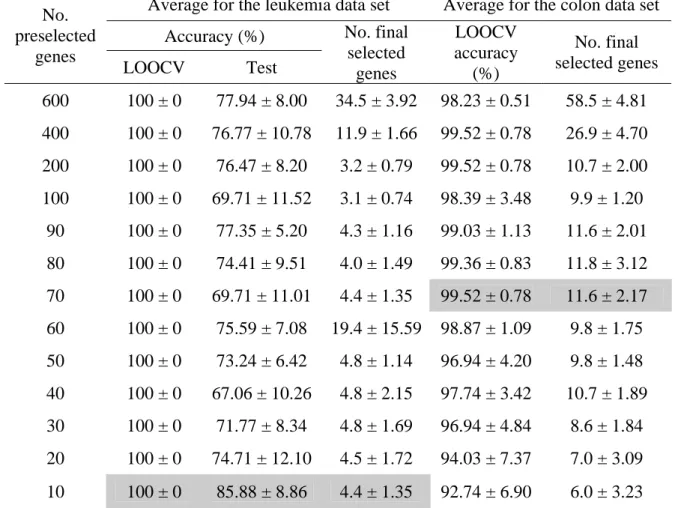
Table 3.2. Classification accuracies for different gene subsets using GASVM-II+MOGASVM (10 runs on average).
Average for the leukemia data set Average for the colon data set Accuracy (%) No. preselected genes LOOCV Test No. final selected genes LOOCV accuracy (%) No. final selected genes 600 100 ± 0 77.94 ± 8.00 34.5 ± 3.92 98.23 ± 0.51 58.5 ± 4.81 400 100 ± 0 76.77 ± 10.78 11.9 ± 1.66 99.52 ± 0.78 26.9 ± 4.70 200 100 ± 0 76.47 ± 8.20 3.2 ± 0.79 99.52 ± 0.78 10.7 ± 2.00 100 100 ± 0 69.71 ± 11.52 3.1 ± 0.74 98.39 ± 3.48 9.9 ± 1.20 90 100 ± 0 77.35 ± 5.20 4.3 ± 1.16 99.03 ± 1.13 11.6 ± 2.01 80 100 ± 0 74.41 ± 9.51 4.0 ± 1.49 99.36 ± 0.83 11.8 ± 3.12 70 100 ± 0 69.71 ± 11.01 4.4 ± 1.35 99.52 ± 0.78 11.6 ± 2.17 60 100 ± 0 75.59 ± 7.08 19.4 ± 15.59 98.87 ± 1.09 9.8 ± 1.75 50 100 ± 0 73.24 ± 6.42 4.8 ± 1.14 96.94 ± 4.20 9.8 ± 1.48 40 100 ± 0 67.06 ± 10.26 4.8 ± 2.15 97.74 ± 3.42 10.7 ± 1.89 30 100 ± 0 71.77 ± 8.34 4.8 ± 1.69 96.94 ± 4.84 8.6 ± 1.84 20 100 ± 0 74.71 ± 12.10 4.5 ± 1.72 94.03 ± 7.37 7.0 ± 3.09 10 100 ± 0 85.88 ± 8.86 4.4 ± 1.35 92.74 ± 6.90 6.0 ± 3.23 Note: The results of the best subsets are shown in the shaded cells.
3.3.3 Result analysis and discussion
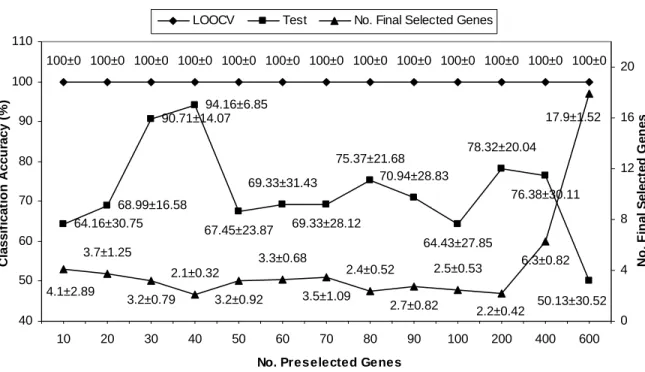
Table 3.2 shows that the highest averages of LOOCV and test accuracies for classifying leukemia cancer samples are 100% and 85.88%, respectively, while 99.52% LOOCV accuracy is obtained for the colon data set. Figure 3.2 shows that GASVM-II+MOGASVM has produced 100% LOOCV accuracy and 94.16% test accuracy for the lung data set, while Fig. 3.3 displays the highest averages of LOOCV accuracy and test accuracy for the MLL data set are 100% and 92%, respectively. In Table 3.2, Fig. 3.2, and Fig. 3.3, the values of the form x± represent an average value y x with a standard deviation y .
100±0 100±0 100±0 100±0 100±0 100±0 100±0 100±0 100±0 100±0 100±0 100±0 100±0 50.13±30.52 64.16±30.75 68.99±16.58 69.33±31.43 90.71±14.07 94.16±6.85 67.45±23.87 69.33±28.12 75.37±21.68 70.94±28.83 64.43±27.85 78.32±20.04 76.38±30.11 17.9±1.52 6.3±0.82 2.2±0.42 2.5±0.53 2.7±0.82 2.4±0.52 3.5±1.09 3.3±0.68 3.2±0.92 2.1±0.32 3.2±0.79 3.7±1.25 4.1±2.89 40 50 60 70 80 90 100 110 10 20 30 40 50 60 70 80 90 100 200 400 600
No. Preselected Genes
C lass if icat io n A ccu ra cy ( % ) 0 4 8 12 16 20 N o . Fi na l S e le c te d G e ne s
LOOCV Test No. Final Selected Genes
Fig. 3.2. A relation between the classification accuracies and the numbers of selected genes on the lung data set (10 runs on average).
100±0 100±0 100±0 100±0 99.65±0.74 99.65±0.74 99.3±01.23 99.47±0.85 99.82±0.55 100±0 99.65±1.11 99.65±0.74 100±0 85.33±6.89 92±8.2 74±9.66 77.33±14.47 75.33±8.92 83.33±9.56 80±9.43 74±12.35 72.67±11.53 79.33±11.95 79.33±12.35 76±10.52 86.67±7.7 6.7±1.16 29.1±1.79 13.5±1.08 7.4±1.9 8.4±1.9 8.2±2.25 8.6±2.12 8.4±1.78 8.7±1.57 8.3±1.49 7.7±2.31 8.1±2.33 6.5±0.71 60 70 80 90 100 110 10 20 30 40 50 60 70 80 90 100 200 400 600
No. Preselected Genes
C lassi fi cat io n A ccu racy ( % ) 5 10 15 20 25 30 N o . F in a l S e lect ed G e n e s
LOOCV Test No. Final Selected Genes
Fig. 3.3. A relation between the classification accuracies and the numbers of selected genes on the MLL data set (10 runs on average).
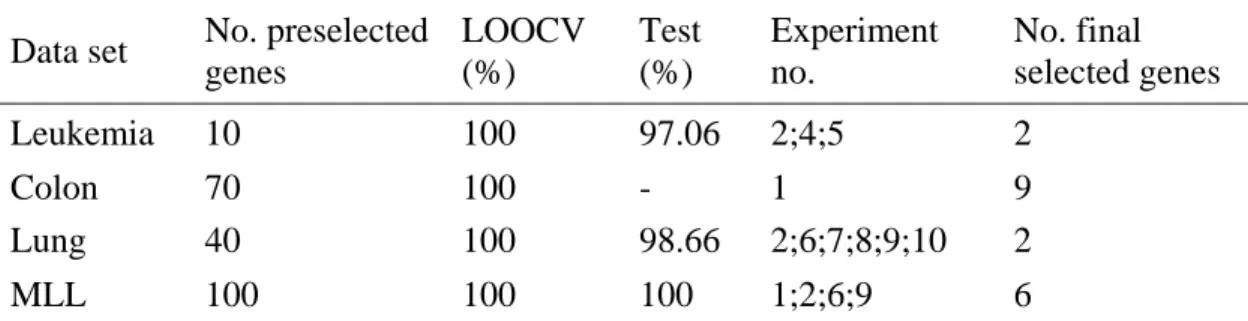
Table 3.3. The result of the best gene subsets in 10 runs.
Data set No. preselected genes LOOCV (%) Test (%) Experiment no. No. final selected genes Leukemia 10 100 97.06 2;4;5 2 Colon 70 100 - 1 9 Lung 40 100 98.66 2;6;7;8;9;10 2 MLL 100 100 100 1;2;6;9 6
Table 3.4. The benchmark of GASVM-II+MOGASVM with GASVMs and SVM on the leukemia and colon data sets.
Leukemia data set (Average; the best)
Colon data set (Average; the best) Accuracy (%)
Method No. final selected
genes LOOCV Test
No. final selected genes LOOCV Accuracy (%) GASVM-II+MOGASVM (3.4 ± 1.35; 2) (100 ± 0; 100) (85.88 ± 8.86; 97.06) (11.6 ± 2.17; 9) (99.52 ± 0.78; 100) GASVM-II (10 ± 0; 10) (100 ± 0; 100) (81.18 ± 10.21; 94.12) (30 ± 0; 30) (99.03 ± 0.83; 100) MOGASVM (2,212.6 ± 26.63; 2,252) (95.53 ± 1.27; 97.37) (84.41 ± 2.42; 88.24) (446.3 ± 18.90; 446) (93.23 ± 1.02; 95.16) GASVM (single-objective) (3,574.9 ± 40.05; 3,531) (94.74 ± 0; 94.74) (83.53 ± 2.48; 88.24) (979.8 ± 35.80; 940) (91.77 ± 0.51; 91.94) SVM (7,129 ± 0; 7,129) (94.74 ± 0; 94.74) (85.29 ± 0; 85.29) (2,000 ± 0; 2,000) (85.48 ± 0; 85.48) Note: The best results are shown in the shaded cells.
Only 4.4 and 11 genes (the values of averages) were finally selected to obtain the highest averages of the accuracies of the leukemia and colon data sets, whereas 2.1 and 6.5 average genes were selected in the lung and MLL data sets. Almost all the different numbers of preselected genes and the final selected genes have obtained 100% LOOCV accuracy on the leukemia, lung, and MLL data sets. This result has proven that the proposed approach searches and selects the near-optimal solution (the best gene subset) in the solution space
successfully. However, the LOOCV accuracies on the three data sets were much higher than the test accuracy due to over-fitting of these data sets. Over-fitting is a major problem in the classification of gene expression data when the LOOCV accuracy is much higher than the test accuracy. This problem happens because the number of training samples is smaller than the number of test samples, and many expression values of the test samples may be different from those of the training samples. Table 3.3 shows that the best performance of the best subsets of all the data sets.
Table 3.5. The benchmark of GASVM-II+MOGASVM with GASVMs and SVM on the lung and MLL data sets.
Lung data set (Average; the best)
MLL data set (Average; the best) Accuracy (%) Accuracy (%) Method No. final
selected
genes LOOCV Test
No. final selected
genes LOOCV Test GASVM-II+MOGASVM (2.1 ± 0.32; 2) (100 ± 0; 100) (94.16 ± 6.85; 98.66) (6.5 ± 0.71; 6) (100 ± 0; 100) (92 ± 8.20; 100) GASVM-II (10 ± 0; 10) (100 ± 0; 100) (59.33 ± 29.32; 97.32) (30 ± 0; 30) (100 ± 0; 100) (84.67 ± 6.33; 93.33) MOGASVM (4,418.5 ± 50.19; 4,433) (75.31 ± 0.99; 78.13) (85.84 ± 3.97; 93.29) (4,465.2 ± 18.34; 4,437) (94.74 ± 0; 94.74) (90 ± 3.51; 93.33) GASVM (single-objective) (6,267.8 ± 56.34; 6,342) (75 ± 0; 75) (84.77 ± 2.53; 87.92) (6,298.8 ± 51.51; 6,224) (94.74 ± 0; 94.74) (87.33 ± 2.11; 86.67) SVMs (12,533 ± 0; 12,533) (65.63 ± 0; 65.63) (85.91 ± 0; 85.91) (12,582 ± 0; 12,582) (92.98 ± 0; 92.98) (86.67 ± 0; 86.67) Note: The best results are shown in the shaded cells.
The benchmark of the proposed approach comparing GASVM-II, GASVMs (single-objective and multi-(single-objective), and SVM is summarized in Table 3.4 and Table 3.5. The LOOCV accuracy, the test accuracy, and the number of selected genes are written in
![Table 4.4. The benchmark of C-GASVM with other experimental methods. Data set Experiment Evaluation C-GASVM GASVM-II [23] MOGASVM [25] GASVM [23] SVM [25] LOOCV (%) (100 ± 0; 100) (100 ± 0; 100) (95.53 ± 1.27; 97.37) (94.74 ± 0; 94.7](https://thumb-ap.123doks.com/thumbv2/123deta/8512333.1805573/63.918.105.843.152.1021/table-benchmark-gasvm-experimental-methods-experiment-evaluation-mogasvm.webp)
