Effect of Sand Flow on Overturn of Column
Standing on Sand Surface
著者
MOCHIZUKI Hiroaki, UTOGUCHI Ryoko
journal or
publication title
鹿兒島大學農學部學術報告=Bulletin of the
Faculty of Agriculture, Kagoshima University
volume
62
page range
73-81
別言語のタイトル
砂面に立てられた円柱の転倒に及ぼす砂流の影響
Global warming is the continuing rise in the average temperature of the Earth’s atmosphere and oceans. It is caused by increased concentrations of greenhouse gases in the atmosphere, resulting from hu-man activities such as deforestation and the burning of fossil fuels. One of effective means to combat global warming is to is to plant trees in deserts, which account for one-third of the Earth’s land sur-face. Though tree-planting has progressed in many desert regions, desertification is accelerated more. This is due to the fact that seedlings are blown down due to sand scoured by strong winds, making tree-planting ineffective.
The effect of sand flow on the stability of obstacles such as seedlings and posts in arid areas is very important for the stability of civil structures and desert plantations, where it is known to have a signifi-cant effect on survival rates and the uprooting of trees. The flow of sand particles in the wind in arid ar-eas is affected by several factors: primarily, wind velocity, the inclination of the deposited sand, the size
Hiroaki MOCHIZUKI†and Ryoko UTOGUCHI
(Laboratory of Environmental Informatics)
Received for Publication, October ,
In the present study, the sand flow around a column is investigated using a wind tunnel and a cam-era for optical observation. The thickness of the sand bed in the test section is kept at . m. It is ob-served that the sand from upstream and also from both sides of the obstacle (the column) moves faster, due to accelerated sand-driving wind, as compared to those away from the column or downstream. This caused visible erosion of the sand layers in the upstream and also from sides of the column. These eroded sands are scoured deeper than those at the initial horizontal surface. The sand, which lies just be-fore and to the side of the column”, slides down in the scoured ditch and moves downstream along the bottom of the ditch. Behind the column, the sand gradually rises up in the ditch and moves down-stream with the horizontal level. Furthermore, the sand flow becomes gradually slower with increase in the scoured depth. The scoured area around the column fans out from the column with time. The col-umn begins to oscillate as the sand below the bottom of the colcol-umn begins to be scoured, and finally, it overturns windward. In the present investigation, the relation between the scoured depth around the column and the time the wind blows, also the relation between the depth of the buried column and the time required until the column overturns are clarified in detail.
Key words: sand flow, column, scour, wind tunnel
†:Correspondence to: H. M OCHIZUKI
of sand particles and most importantly, the position and geometrical nature of the obstacle. For exam-ple, when wood, stakes and seedlings, etc. are standing on flat sand surfaces, sand particles in the sur-face creep are scoured or deposit around them in a very unique way. The sand flow patterns have been widely investigated and documented by Bagnold ( , ), who studied experimentally the relation be-tween wind velocity and the sand flow. Later, the creep motion in aeolian sand transport was studied us-ing two granular flow models, the Saint-Venant model and the Navier-Stokes type equations (Wang, etc., ). Also, a method for measuring sand creep flow have been experimentally developed using a high-speed digital camera (Wang, etc., ). Patterns and dynamics of desert dunes have been simu-lated by computer (Hatano, etc. ). The hillslope evolution by nonlinear creep and landsliding has been investigated (Joshua, ). Modeling and simulation methods have been proposed to synthesize sandy terrain with vegetation cover (Wang, ). However, the phenomenon of sand pattern construc-tion and small flow around the obstacles on the sand surface has not yet been clarified in detail. The rea-son why the column in wind overturns windward is due to the fact that the sand on the upstream side of the column is scoured faster than the downstream side as has been investigated experimentally (Hayashi, etc., ) and numerically (Kawamura, et al. ). The sand flow around a cube on a flat sand surface has been experimentally and numerically investigated regarding sand erosion and deposi-tion (Tominaga, ), but the sand flow around obstacles has not yet been totally clarified from previ-ous investigations. So, in the present investigation, the detailed mechanism of sand flow around a col-umn is experimentally clarified using a video camera and a laser distance meter. The present results are very important to optimize the strength required for civil construction and also for desert vegetation sur-vival, etc.
A wind tunnel is schematically shown in Figure . Air from two blowers enters into the test sec-tion through a convergent secsec-tion. The test secsec-tion is . m in length, . m in width, . m in height and has a flat sand bed with a thickness of . m to ensure that the sand flow in the experiment is simi-lar that in deserts. Air is put into the atmosphere through the air-flow channel with a height of . m in the test section. The test section has a transparent side wall and an upper wall made of acrylic acid resin to enable observation of the sand flow from the side and top. The shape of the column is shown in Fig. and Table . The outer and inner diameters of the column are mm and mm, respectively.
Hiroaki MOCHIZUKIand Ryoko UTOGUCHI
The column is positioned at . m upstream of the exit of the test section and . m from the side wall. The height of the column over the sand surface is kept at a constant of . cm to give the same wind power and heights below the sand surface are , , , and mm to estimate the effect of the depth buried in the sand as shown in Table. . Furthermore, the sand flow around the column is ob-served by the camera (Casio Digital Camera, EX-F ). The upper and lower surfaces of the column are made of transparent acrylic acid resins with a thickness of mm to observe the sand flow below the col-umn. Sand particles are sifted through several screens and weighted using an electronic balance (Type BL-H). Wind velocity in the test section is measured by an Anemometer (Type SK- F). The depth of the scoured sand layer around the column is measured by a laser distance meter (Type LS- ) at four po-sitions as shown in Fig. . The four points are mm in distance from the column wall.
Table 1. Length of column and depth below sand surface
L, mm B, mm B/L, %
. . . .
Figure 2. Size and arrangement of column
The distributions of the sand particles are shown in Fig. for two sands used in the present experi-ment collected in the Sahara. In the distribution, Sahara means sand collected in Sahara desert in a sub-urb of Douz, Tunisia. % of sand particles for the two distributions are smaller than µm in diame-ter. The peaks are between µm and µm. Therefore, the two distributions are almost the same though they differ little by little for each value. The mean value of the wind velocity in the test section is m/s at . m distance upstream of the column. The direction of the wind was checked by measuring growth and propagation of sand ripples. The formation pattern of the sand ripples was taken by the cam-era before all experiments. As a result, their directions were almost perpendicular to the side wall of the test section in the region between cm and cm upstream of the column. While measuring the sand flow, since sand moves downstream in the test section, the height of the flat sand bed decreases little by little in the upstream region of the test section. For that reason, the experiment is stopped every min-utes, and after new sand was supplied on the sand bed, the experiment was started again.
Photographs and diagrams of the upper views of the sand flow around the column are shown in Fig. . In the figures, the buried depth of the column is mm. Fig.(a) indicates the sand flow at sec af-ter commencement of air flow. As shown in Fig.(a), sand is scoured for the first time at ~ de-grees from point A (which corresponds to the dead-air one). Figures (b)~(d) show the sand flow at sec, sec and sec, respectively. The sand is scoured inside the curved solid lines in the figures. The sand moves in almost a parallel direction outside the solid line.
In Fig. (b), the scoured width is about mm at point A. The scoured width gradually becomes wider in the downstream direction from A. The sand moves along the column wall as shown by the thick solid arrows. The sand slides down the slope as shown by the dotted arrows. The sand which slides down at the scoured bottom rises on the slope till the height indicated by the solid line in the down-stream of BC and moves in the same level downdown-stream after the solid line.
In Fig. (c), the scoured width at position A spreads to about . mm. The black ellipsoids between positions A and B indicate sand sliding down in group on the slope. The sand flow downstream of the po-sition B is almost the same as in Fig. (b), but the scoured area increases.
In Fig. (d), the scoured width at position A increases to about . mm. The scoured area around the column becomes wider than in Fig. (c). In the scoured region between positions A and C, the sand
Hiroaki MOCHIZUKIand Ryoko UTOGUCHI
flow is almost the same as in Fig. (C).
In the downstream region of position C, the sand moves in a different way to the case in Fig. (c). The sand in the behind position C reverses toward the column due to the effect of the reversing air flow, so sand accumulates at position C causing the maximum height of the sand surface in contact with the column. In the region with the throat drawn by the dots downstream of this reversing region, the sand almost does not move because of air in stagnation. Furthermore, in the downstream region, the sand rises till a thin solid line. The pattern of the sand flow shown in Fig. (d) enlarges the size with a similar form with time until the column overturns.
In this way, the sand layer is gradually scoured around the column with time, and though the
scoured depth attains the level of the column bottom, the column does not overturn windward differ-ent from previous investigations. The reason can be explained in the following way.
The sand flow below the bottom of the column is shown in four photos and a diagram in Fig. . The outer black circle is the upper surface of the column. The inner circle with crescents is the bottom of the column. The black colors on the left of the photographs are the shadows of the column wall. The width between the outer diameter and the crescents is the thickness of the column side wall. In Fig.(a), two white thin crescents at about degrees from the center of the circle with respect to the hori-zontal line show scoured sand layers on the bottom. The crescents increase the size as shown in Fig.(b) and increase furthermore in Fig.(c) and (d). In the diagram, the sand layer is scoured toward the direc-tion shown by arrows from the outside of the bottom. As the boundary of the scoured area moves to the left side as shown by dotted lines with time, the scoured area gradually becomes larger with time. A few seconds later from Fig.(d), since the scoured area becomes larger than that of the non-scoured area, the column overturns windward since the balance of the column is lost. In this way, since the sand layer below the bottom of the column is scoured from the upstream region of the bottom, the umn overturns windward. In previous investigations, since the sand flow below the bottom of the col-umn had not been detailed experimentally and numerically, they would not lead to a correct result.
Figure shows the scoured depth for the time the wind blows at four points at the distance mm
Hiroaki MOCHIZUKIand Ryoko UTOGUCHI
Figure 6. Sand flow below the bottom of the column
from the column as shown in Figure . The depth at point ① is less that at points ②~④. This reason is due to the fact that the sand at position ① reverses and accumulates behind the column as explained in Fig. . The scoured depth decreases quickly at first and then slowly with time. This reason comes from the fact that the sand in the ditch scoured around the column flows slowly out from the shallow ditch at first, and as the slope angle of the ditch becomes larger with time, the velocity of the sand flow de-creases.
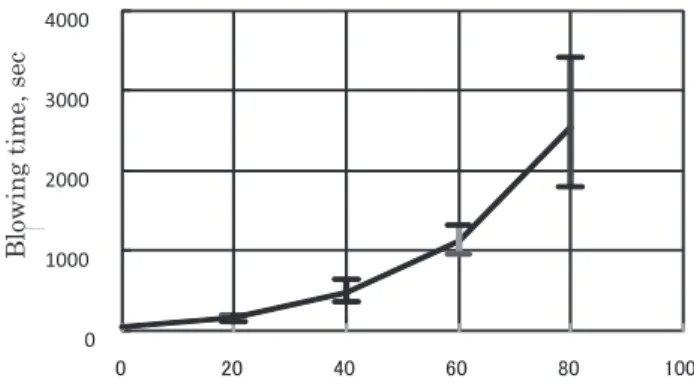
Figure shows the relation between the buried depth of the column below the horizontal sand sur-face and the time it took for the column to overturn. The vertical lines on each depth show the maxi-mum and minimaxi-mum values of the time it took to overturn. The column overturned quickly for a buried depth shallower than about mm, but with increasing buried depth, the time increases quickly.
From the present results, it has been clarified that when woods and seedlings are planted and stakes are stood in the dry sandy areas, the buried depth and the direction of wind are the most impor-tant factors in stabilizing them.
In the present experiment, the wind velocity was about m/s and the outer diameter of the col-umn was mm, so it is necessary to practice experiments and clarify detailed results for different wind ve-locities and column diameters.
In the present investigation, the mechanism of the sand flow around a column was clarified in de-tail. When the sand below the column is scoured and the column loses balance, it overturns windward. The sand layer around the column is scoured quickly in the initial stage of scouring, but slows down with time. The sand layers, which spread at the front and side wall surfaces of the column, are scoured more quickly than at the rear of the bottom. The time it takes for the column to fall increases with as the buried depth of the column is increased.
[ ] Bagnold R.A.: The measurement of sand storms. Proceedings of the Royal Society of London. Series A, Mathematical and Physical Sciences, , - ( ).
[ ] Bagnold R.A.: The physics of blown sand and desert dunes. - ( )
[ ] Wang, Z.T. and Zheng, X.J.: Theoretical prediction of creep flux in aeolian sand transport.
Powder Technology, , - ( )
[ ] Wang, Y., Wang D., Wang L. and Zhang, Y.: Measurement of sand creep on a flat sand bed using a high-speed digital camera. Sedimentology, , - ( )
[ ] Hatano, Y. and Hatano, N.: Dune Morphology and Sand Transport. Forma, , - ( ). [ ] Joshua, J., Roering, J.W., Kirchner, L.S. and Sklar, W.E.D.: Hillslope evolution by nonlinear
creep and landsliding. An experimental study, Geology, ( ), - ( ).
[ ] Ning Wang, and Bao-Gang Hu,: Aeolian the sand flow and interacting with vegetation: A GPU, Based Simulation and Visualization Method. Third International Symposium on Plant Growth, Modeling, Simulation, Visualization and Applications, - ( ).
[ ] Hayashi, T., Waka R. Kamichika M.: Studies on environmental problem in arid land. Proc. MIE, International Forum Symposium, Global Environment, Friendly Energy Technol., - ( ) [ ] Kawamura, T., Kan M. and Hayashi T.: Numerical Study of the flow and the sand flow around a
circular cylinder standing on the sand. Trans. of the Japan Society of Mechanical Engineers. B, , - ( ) (in Japanese with an English summary)
[ ] Tominaga, Y.: Wind tunnel experiment and CFD analysis of sand erosion/deposition around an ob-stacle. Nagare, , - ( ) (in Japanese with an English summary)