INTRODUCTION
The patients with liver cirrhosis (LC) frequently show postprandial hyperglycemia. From 10 to 40%
of them fall into diabetes mellitus (DM) and about 40% of them become impaired glucose intolerance (IGT), whereas 30% of them have kept normal glu-cose tolerance (NGT) (1, 2). It is supposed that
ORIGINAL
Insulin resistance as early sign of hepatic dysfunction in
liver cirrhosis
Kayo Taguchi
1, Hisami Yamanaka-Okumura
1, Akira Mizuno
2, Taki Nakamura
1,
Mitsuo Shimada
3, Toshio Doi
2, and Eiji Takeda
1 1Department of Clinical Nutrition, Institute of Health Biosciences, University of Tokushima Graduate School, Tokushima, Japan, 2
Department of Clinical Biology and Medicine, Institute of Health Bio-sciences, University of Tokushima Graduate School, Tokushima, Japan, 3
Department of Digestive and Pediatric Surgery, Institute of Health Biosciences, University of Tokushima Graduate School, Tokushima, Japan
Abstract : Glucose intolerance characterized by postprandial hyperglycemia and hyper-insulinemia is commonly seen in patients with liver cirrhosis (LC). The aim of this study is to clarify the relation between glucose intolerance and disorder of liver function in patients with LC. The 75 g oral glucose tolerance test (75 g OGTT) and the hyperinsuline-mic euglycehyperinsuline-mic clamp combined with 0.2 g/kg oral glucose load (HECGL) were conducted in 61 patients with LC. Based on the results of 75 g OGTT, the 61 patients with LC were di-vided into groups, 21 (34.4%%) patients with normal glucose tolerance (LC-NGT), 12 (19.7%%) patients with impaired glucose tolerance (LC-IGT) and 28 (45.9%%) patients with diabetes mellitus (LC-DM). Fasting plasma glucose (FPG) level was normal in 50 (82.0%%) patients with LC. All patients with LC showed insulin resistance in both peripheral (skeletal and adipose) and hepatic tissues evaluated by HECGL, although significant correlation between the degree of glucose intolerance and the severity of hepatic dysfunction was not observed. Insulin resistance in both liver and peripheral tissues is the early sign in the patients with LC. This fact indicates that nutritional care from early stages of LC would be necessary in the patients. J. Med. Invest. 61 : 180-189, February, 2014
Keywords :nutritional assessment, liver cirrhosis, hyperinsulinemic euglycemic clamp combined with oral glucose load, indirect calorimetry, diabetes mellitus
Abbreviations :
LC : liver cirrhosis, OGTT : oral glucose tolerance test, HECGL : hyperinsulinemic euglycemic clamp combined with 0.2 g/kg oral glucose load, NGT : normal glucose tolerance, IGT : impaired glu-cose tolerance, DM : diabetes mellitus, LC - NGT : liver cirrhosis patients with normal glucose tolerance, LC - IGT : liver cirrhosis patients with impaired glucose tolerance, LC - DM : liver cirrhosis patients with diabetes mellitus, FPG : Fasting plasma glucose, IRI : immunoreactive insulin, CPR : C peptide immunoreactiv-ity, HBV : hepatitis B virus, HCV : hepatitis C virus, PG : plasma glucose, OGL : oral glucose load, IFG : impaired fasting glucose,
GIR : glucose infusion rate, HGU : hepatic glucose uptake, REE : resting energy expenditure, npRQ : non - protein respiratory quo-tient, NEFA : non - esterified fatty acids, AUC : area under the curve Received for publication December 9, 2013 ; accepted January 22, 2014.
Address correspondence and reprint requests to Mrs. Hisami Yamanaka- Okumura, Department of Clinical Nutrition, Institute of Health Biosciences, University of Tokushima Graduate School, Tokushima 770 - 8503, Japan and Fax : +81 - 88 - 633 - 7094.
insulin resistance may contribute to postprandial hyperglycemia since plasma immunoreactive insulin (IRI) and C peptide immunoreactivity (CPR) levels are increased in patients with LC (3). Irrespective of etiology, insulin resistance is observed in the pa-tients with LC even before occurring glucose intol-erance (4). Furthermore, diabetes (5, 6) or obesity (5, 7) characterized by insulin resistance increases cancer risk in cirrhosis.
It has been reported that hepatic glucose pro-duction in the patients with LC is normal and de-creased (8), however, insulin-induced glucose up-take in the peripheral tissue is markedly decreased (9). In contrast, hepatic insulin resistance is seen in cirrhotic patients with DM but not in patients with LC alone (9-11). Thus, the role of insulin resistance on hepatic glucose uptake in the patients with LC has remained unclear.
There was no clear evidence that etiology, dura-tion and degree in the patients with LC would be related to glucose intolerance (12). Furthermore, disorder in glucose metabolism is not always seen in a comparative number of cirrhotic patients and the patients with advanced LC is not always devel-oped IGT and DM (12).
In this study, the relation between glucose uptake of peripheral and liver tissue evaluated by the hyper-insulinemic euglycemic clamp combined with 0.2 g/kg oral glucose load (HECGL), and the biochemi-cal and metabolic parameters of liver function was examined in the patients with LC divided into groups
by World Health Organization criteria in 75 g oral glucose tolerance test (OGTT) (13). HECGL (14-16) which enabled us to measure the peripheral and hepatic glucose uptake simultaneously and precisely was conducted in 61 patients with LC.
SUBJECTS AND METHODS
Subjects
Sixty-one patients with LC (16 hepatitis B virus (HBV)-infected LC, 35 hepatitis C virus (HCV)-infected LC, 3 HBV- and HCV-(HCV)-infected LC, 2 alco-holic LC and 5 LC with unknown etiology) and 34 age matched control without liver disease (Control) were enrolled for this study. None of the patients received any medication affecting glucose tolerance, including oral hypoglycemic agents or insulin injec-tions. All patients with LC were diagnosed by liver biopsy, laboratory tests and ultrasound sonography ; alcoholic liver disease was diagnosed in habitual drinkers who consumed more than 30 g of ethanol daily. None of the patients had ascites, jaundice or hepatic encephalopathy. 48 and 13 patients in 61 LC patients were classified as Child-Pugh A and B, re-spectively. The clinical and laboratory data are sum-marized in Table 1. The levels of white blood cell, platelet, albumin, cholinesterase, total cholesterol and triglyceride in the patients with LC were signifi-cantly lower than those in Control ; body mass index and the levels of serum aspartate aminotransferase,
Table 1. Clinical and laboratory data of age matched control and patients with liver cirrhosis
Control Patients (n = 34) LC - total (n = 61) LC - NGT (n = 21) LC - IGT (n = 12) LC - DM (n = 28) Age (y) 61.7"2.1 64.4"1.3 65.9"2.6 61.9"2.5 64.4"1.9 Body mass index (kg/m2) 21.8"0.6 23.3"0.4 1 22.6"0.7 23.6"1.0 23.5"0.7
White blood cell (/μL) 6872"442 5275"319 1 4645"336 1 5700"548 5557"586
Red blood cell (!106/μL) 4.18"0.10 4.03"0.07 4.00"0.11 4.30"0.11 3.95"0.12
Platelet (!104/μL) 22.5"1.2 15.1"1.5 1 13.6"2.2 1 17.4"2.4 15.2"2.7
Prothrombin time (sec) 12.3"0.5 13.9"0.2 1 13.8"0.3 1 13.7"0.2 1 14.0"0.4 1
Aspartate aminotransferase (IU/L) 34"5 65"5 1 67"8 1 67"13 63"8 1
Alanine aminotransferase (IU/L) 36"6 56"4 1 53"6 54"8 58"5 1
Total bilirubin (mg/dl) 0.9"0.3 1.0"0.1 0.8"0.1 1.3"0.2 1.1"0.1 Albumin (g/dl) 3.9"0.1 3.7"0.1 1 3.7"0.1 3.6"0.2 3.6"0.1 Cholinesterase (IU/L) 262"20 188"11 1 169"15 1 192"26 201"18 Total cholesterol (mg/dl) 173"9.5 149"4.9 1 146"6.9 168"13.1 144"7.3 1 Triglyceride (mg/dl) 137"22.2 88"4.6 1 84"5.2 1 88"11.3 90"8.0 1 Ammonia (μg/dl) 34.8"2.4 45.0"3.5 1 47.2"5.7 37.1"3.2 46.9"6.2
Indocyanine green retention rates
at 15 minutes (%) 9.2"1.5 25.4"1.9 1 25.3"2.6 1 26.2"4.4 1 25.1"3.2 1 All values are mean"SE.1p!0.05 vs. Control
alanine aminotransferase and ammonia, prothrombin time, and indocyanine green retention rates at 15 minutes were significantly higher than those in Con-trol .
The purpose of the study was fully explained to all subjects, and their informed and written consent were obtained. The study confirmed to the 1975 Helsinki Declaration on ethical guidelines for clini-cal investigations.
Oral glucose tolerance test
After overnight fasting for 12 h, the patients in-gested 75 g of dextrose (Torelan G 75, Shimizu Co., Japan) within 5 min. Venous blood was drawn for measuring plasma glucose (PG), IRI and CPR lev-els before, and at 15, 30, 60 and 120 min after the oral glucose load (OGL). The definition of DM, im-paired fasting glucose (IFG), IGT and NGT were based on World Health Organization criteria (13). In brief, patients were classified as LC-DM when fasting plasma glucose (FPG) level was!126 mg/ dl or when PG level at 2-hour OGTT was!200 mg/ dl. LC-IGT was defined as FPG level of!126 mg/ dl and 2-hour OGTT PG level of 140 to 199 mg/dl. Thus, patients with LC-IFG had FPG level of 110 to 125 mg/dl and 2-hour OGTT PG level of!140 mg/ dl. Patients with LC-NGT had FPG level of!110 mg/dl and 2-hour OGTT PG level of!140 mg/dl.
Hyperinsulinemic euglycemic clamp combined with oral glucose load
Subjects were admitted to the laboratory at 8 : 00AM after an overnight fast. They voided, were weighed, and then remained supine for the duration of the procedure. The details of HECGL have been described previously (14-16). In short, a polyethyl-ene catheter was inserted into an antecubital vein in a retrograde manner to administer glucose (20% of glucose) and insulin infusion. A second catheter was inserted into a dorsal hand vein on the contra-lateral arm in the retrograde fashion and kept in a warming device to arterialize the venous blood. Blood samples were drawn at baseline to determine Fasting PG levels, serum IRI levels and CPR levels. Insulin-mediated whole body glucose uptake was measured using an artificial pancreas (Model STG-22 Nikkiso, Tokyo, Japan), according to DeFronzo’s method (17). An infusion of 20% of glucose solution was started at baseline, and the rate was adjusted to clamp the glucose level at 100 mg/dl during the clamp study. PG levels were checked at 30-second intervals throughout the investigation. Data on total
body glucose uptake represented the mean values for the glucose infusion rate (GIR) during the final 30 minutes of infusion. After determining the base-line GIR during the hyperinsubase-linemic euglycemic clamp described above, glucose was orally admin-istered at a dose of 0.2 g/kg body weight. Thereaf-ter, the hyperinsulinemic euglycemic clamp was continued and the extent of decrease in GIR was monitored for 90 min in order to evaluate hepatic glucose uptake (HGU), which was used as a pa-rameter of insulin sensitivity in the liver.
Calculation of hepatic glucose uptake
After an OGL during hyperinsulin emiceuglyce-mic clamp, the glucose appearance rate (Ra(t)) is calculated by the formula,
Ra(t)=[OGL(t)-HGU(t)]+GIR(t) [1]
where OGL(t), the rate of absorption of OGL by the intestine at time t ; HGU(t), the rate of HGU of OGL at time t ; and GIR(t), GIR at time t. Glucose disap-pearance rate from the systemic circulation (RdT(t)) is calculated by the formula,
RdT(t)=RdP(t)+RdS(t) [2]
where RdP(t) and RdS(t) are extra-splanchnic and splanchnic glucose disappearance rates from sys-temic circulation at time t, respectively. Under hyper-insulinemic euglycemic clamp conditions, Ra(t) is equal to RdT(t), therefore
RdP(t)+RdS(t)=[OGL(t)-HGU(t)]+GIR(t) [3] HGU can be calculated from the difference between the amount of ingested glucose and the summation of GIR decrements after glucose ingestion.
Σ(HGU(t)+RdS(t))=ΣOGL(t)-Σ(RdP(t)-GIR(t)) [4] Total hepatic glucose uptake was expressed as a per-centage of OGL.
Assessment of energy metabolism
To maintain the resting energy expenditure (REE) and substrate oxidation, in preprandial and postprandial thermogenesis after an overnight fast, the patients and Control were asked to maintain a supine position throughout the study period, and to avoid activity during the indirect calorimetry (Chest MI, Tokyo, Japan). The measurements of O2
con-sumption and CO2production were computed and
printouts obtained at 1 min intervals ; the measure-ments were continued until steady-state equilibrium was achieved. The average O2consumption and CO2
production were used in calculating the energy ex-penditure ; the mean values during the last 10 min of the measurement interval were used for calculation.
5 30 60 120 TIME (min) *†‡ *† * *† * * * * * *† *† 0 50 100 150 200 0 15 30 60 120 TIME (min) Plasma insurin ( U/ml ) (B) * * * * † 0 5 10 15 20 0 15 30 60 120 TIME (min) Plasma C-peptide ( ng/ml ) (C) * * * ! * * † 0 100 200 300 0 15 30 60 120 TIME (min) Plasma glucose ( mg/dl ) (A) *†‡ *† * †‡ *† * * * * * *† *† 0 50 100 150 200 0 15 30 60 120 TIME (min) Plasma insurin ( U/ml ) (B) * * * * † 0 5 10 15 20 0 15 30 60 120 TIME (min) Plasma C-peptide ( ng/ml ) (C) * * * ! * * † Plasma insulin ( U/ml )
The machine was calibrated before each study and at intervals throughout the experiment. The basal energy expenditure was estimated according to the equation reported by Harris and Benedict (18), and the ratio of REE to basal energy expenditure is ex-pressed as the %REE. The %REE was used as the ac-tual index of energy expenditure to compare the val-ues of energy expenditure among different individu-als. The non-protein respiratory quotient (npRQ) was calculated from measurements of daily urinary nitrogen excretion. Measurements were taken at 8 : 30AM, 11 : 30AM and 2 : 30PM. The patients were asked to stay in bed for at least 30 minutes before each measurement, but some mobility was allowed between each set of measurements. Break-fast and lunch were given at 9 : 00AM and 12 : 00 noon, respectively, and consumed within 30 min. Pa-tients received standard hospital food, and their die-tary intake was recorded and the amounts of energy, protein, fat, and carbohydrate were calculated using Japanese standard tables of food composition (19). The energy and nutritional intake was not signifi-cantly different among the groups. Blood samples were taken to determine the PG and non-esterified fatty acids (NEFA) just before the indirect calorime-try measurements.
Measurement and statistical analysis
Glucose was measured by the glucose oxidase method (Hitachi 736 Auto Analyser, Hitachi Co.,
Tokyo, Japan). IRI and CPR were analyzed by radio-immunoassay (Eiken, Tokyo, Japan). Serum NEFA concentrations were assayed using an acyl-CoA oxidase-based colorimetric kit (Wako NEFA-C, Wako Chemicals, Osaka, Japan). All data were pre-sented as mean!SE, unless otherwise specified. Statistical comparisons were assessed, where appro-priate, using one-way ANOVA and unpaired t-test analysis. P values!0.05 were considered statistically significant.
RESULTS
1) Classification of the patients with LC by 75 g OGTT
By 75 g OGTT, the 61 patients with LC were di-vided into 21 (34.4%) in NGT, 12 (19.7%) in LC-IGT, 28 (45.9%) in LC-DM, but there were no pa-tients in LC-IFG (Figure 1). FPG level was normal in 50 (82.0%) patients with LC. PG in LC-total pa-tients was higher than that in Control at 15, 30, 60 and 120 min. There was not significant difference between Control and LC-DM patients, but PG in LC-DM patients was higher than that in LC-NGT patients and LC-IGT patients at fasting state. Post-prandial PG in LC-DM patients was higher than that in LC-NGT patients at 30, 60, 120 min and that in IGT patients at 120 min, respectively. IRI in LC-total patients was higher than that in Control at 60
Figure 1. Plasma glucose (A), insulin (B), and C - peptide (C), levels during 75 g oral glucose tolerance test in control ( ) and
pa-tients with liver cirrhosis (LC) total ( ), NGT : normal glucose tolerance ( ), IGT : impaired glucose tolerance ( ), DM : diabetes mellitus ( ). All values are mean!SE. *p!0.05 vs. Control, p!0.05 vs. LC-NGT, p!0.05 vs. LC-IGT.
0 5000 10000 15000 20000 25000 30000 35000
Control LC-total LC-NGT LC-IGT LC-DM
AUC PG (mg min/dl) * †‡ † * * 0 2000 4000 6000 8000 10000 12000 14000 16000 18000 20000
Control LC-total LC-NGT LC-IGT LC-DM
AUC IRI ( U min/ml) * 0 200 400 600 800 1000 1200 1400 1600 1800 2000
Control LC-total LC-NGT LC-IGT LC-DM
AUC CPR (ng min/ml) * * 0 1 2 3 4 5 6 7 8 9 10 Control LC-total LC-NGT L AUC IRI / AUC CPR LC-IGT LC-DM 0 1 2 3 4 5 6 7 8 9
Contorol LC-total LC-NGT LC-IGT LC-DM
Glucose infusion rate
0 10 20 30 40 50 60 70
Contorol LC-total LC-NGT LC-IGT LC-DM
Hepatic glucose uptake
LC patients LC patients
†
(%)
mg/kg/min
and 120 min. There was not significant difference between Control and LC-total patients at fasting state. The Insulin level at fasting state tended to be higher with insulin resistance, but it was not signifi-cant. IRI in LC-DM patients was lower than that in NGT patients at 30 min. Similarly, CPR in LC-DM patients was lower than that in LC-NGT pa-tients at 30 min. CPR in LC-total papa-tients was higher than that in Control at 0 and 120 min. The values of area under the curve (AUC) of PG, IRI and CPR levels in LC-total patients were significantly higher than those in Control. The AUC of PG in LC-DM patients higher than that in Control, LC-NGT pa-tients and LC-IGT papa-tients. That in LC-IGT papa-tients higher than that in Control and LC-NGT patients.
The AUC of CPR in LC-IGT patients higher than that in Control (Figure 2).
The ratios of AUC of IRI to AUC of CPR (AUC IRI/AUC CPR), a rough measurement for porto-sys-temic shunting of insulin, in total patients, LC-NGT patients, LC-IGT patients and LC-DM patients tended to be higher than those in Control, but not significant.
2) Evaluation of insulin sensitivity
Comparable and stable PG levels, clamped at 1.00 g/L, were achieved over the last 30 min in patients with LC and Control with HECGL. Both GIR and HGU in LC-total patients were significantly lower than those in Control (Figure 3). GIR in LC-NGT,
Figure 2. Area under the curve of plasma glucose (PG), immunoreactive insulin (IRI) and C - peptide immunoreactivity (CPR) for
120 min after 75 g oral glucose tolerance test in control and patients with liver cirrhosis. All values are mean!SE. AUC : area under the curve, LC : liver cirrhosis, NGT : normal glucose tolerance, IGT : impaired glucose tolerance, DM : diabetes mellitus. *p!0.05 vs. Control, p!0.05 vs. LC-NGT, p!0.05 vs. LC-IGT.
Figure 3. Glucose infusion rate and hepatic glucose uptake by hyperinsulinemic euglycemic clamp combined with oral glucose load
in control and patients with liver cirrhosis. All values are mean!SE. LC : liver cirrhosis, NGT : normal glucose tolerance, IGT : impaired glucose tolerance, DM : diabetes mellitus. *p!0.05 vs. Control, p!0.05 vs. LC-NGT.
LC-IGT and LC-DM patients showed significantly lower than that in Control. Furthermore, GIR in LC-DM patients showed significantly lower than that in LC-NGT patients. Thus, GIR levels proportionally became lower with the severity of glucose intoler-ance. HGU in LC-DM patients showed significantly lower than that in Control.
3) Comparison of biochemical and metabolic fea-tures in LC patients
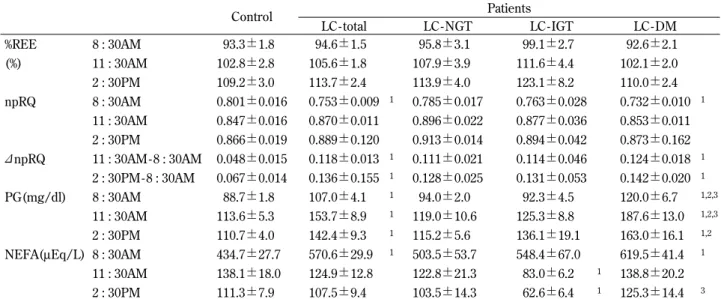
Age was not significant differences among each group. Blood chemistry data exhibited significant differences between Control and LC patients (Table 1). In energy metabolism, the %REE values in the patients with LC and those groups were similar to those of Control under fasting and postprandial con-ditions (Table 2). Fasting npRQ in LC-total patients was significantly lower than that in Control, and the value tended to decrease according to the severity of glucose intolerance in the patients with LC. Fur-thermore, Fasting npRQ in LC-DM patients showed significantly lower than that in Control. Such find-ings were not observed after food ingestion. There-fore, the increased npRQ levels after meal, desig-nated as npRQ, in the patients with LC were higher than those in Control, and the value tended to in-crease according to the severity of glucose intoler-ance in the patients with LC. Furthermore,"npRQ in LC-DM patients showed significantly higher than that in Control. Fasting and postprandial glucose
concentrations in LC-total patients were significantly higher than those in Control. PG in LC patients, at 11 : 30AM and 2 : 30PM, were elevated with the se-verity of glucose intolerance, which was similar to those of 75 g OGTT. The serum fasting NEFA con-centrations in LC-total patients were significantly higher than those in Control and tended to increase with the severity of impaired glucose metabolism in patients with LC. Furthermore, fasting NEFA in LC-DM patients showed significantly higher than that in Control.
DISCUSSION
In this study, we did not find that there were cer-tainly correlation between degree of glucose intol-erance and severity of liver dysfunction in the pa-tients with LC. It has been reported that incidence of glucose intolerance in the patients with LC was 60-80% and defined DM was 10-60% (1, 2, 20).
To verify how many prevalence of glucose intol-erance was observed in the patients with LC, 75 g OGTT was firstly conducted in this study. The data in OGTT were compared with those in Control. In this study, the prevalence of NGT, IGT and DM was 34%, 20% and 46%, respectively. Hepatic glucose up-take and peripheral glucose upup-take were measured simultaneously using HECGL. The validity of this method for evaluating HGU had been ascertained
Table 2. Effects on meal ingestion on %REE, npRQ,"npRQ and the concentration of plasma glucose (PG) and serum NEFA in
control and patients with liver cirrhosis
Control Patients LC - total LC - NGT LC - IGT LC - DM %REE 8 : 30AM 93.3!1.8 94.6!1.5 95.8!3.1 99.1!2.7 92.6!2.1 (%) 11 : 30AM 102.8!2.8 105.6!1.8 107.9!3.9 111.6!4.4 102.1!2.0 2 : 30PM 109.2!3.0 113.7!2.4 113.9!4.0 123.1!8.2 110.0!2.4 npRQ 8 : 30AM 0.801!0.016 0.753!0.009 1 0.785!0.017 0.763!0.028 0.732!0.010 1 11 : 30AM 0.847!0.016 0.870!0.011 0.896!0.022 0.877!0.036 0.853!0.011 2 : 30PM 0.866!0.019 0.889!0.120 0.913!0.014 0.894!0.042 0.873!0.162 "npRQ 11 : 30AM- 8 : 30AM 0.048!0.015 0.118!0.013 1 0.111!0.021 0.114!0.046 0.124!0.018 1 2 : 30PM- 8 : 30AM 0.067!0.014 0.136!0.155 1 0.128!0.025 0.131!0.053 0.142!0.020 1 PG(mg/dl) 8 : 30AM 88.7!1.8 107.0!4.1 1 94.0!2.0 92.3!4.5 120.0!6.7 1,2,3 11 : 30AM 113.6!5.3 153.7!8.9 1 119.0!10.6 125.3!8.8 187.6!13.0 1,2,3 2 : 30PM 110.7!4.0 142.4!9.3 1 115.2!5.6 136.1!19.1 163.0!16.1 1,2
NEFA(μEq/L) 8 : 30AM 434.7!27.7 570.6!29.9 1 503.5!53.7 548.4!67.0 619.5!41.4 1
11 : 30AM 138.1!18.0 124.9!12.8 122.8!21.3 83.0!6.2 1 138.8!20.2
2 : 30PM 111.3!7.9 107.5!9.4 103.5!14.3 62.6!6.4 1 125.3!14.4 3
All values are mean!SE. %REE : % of resting energy expenditure to basal energy expenditure, npRQ : nonprotein respiratory quotient, "npRQ : changes of npRQ, BG : blood glucose, NEFA : non esterified fatty acid
NGT : normal glucose tolerance, IGT : impaired glucose tolerance, DM : diabetes mellitus
by the hepatic vein catheterization procedure in hu-mans (15) and in dogs (21). In the present study, GIR in the patients with LC was significantly lower than that in normal subjects. Furthermore, HGU in them was about 70% of that in Control. GIR de-creased depend on severity of glucose intolerance. But HGU did not show significant differences among LC groups. i.e., severity of glucose intolerance was seen to correlate with GIR but not HGU.
Recent studies using the hyperinsulinemic eu-glycemic glucose clamp technique have reported that peripheral insulin sensitivity in the patients with LC was about 30-60% of that in healthy volunteers (9, 10). The study using a positron-emission to-mography study has clarified that in the patients with LC impaired insulin action in the peripheral tissues is characterized by both marked decrease in glucose transport and nonoxidative glucose metabo-lism under euglycemic state, however, glucose phos-phorylation and glucose oxidation have been kept to be intact (22). In addition, decreased insulin-in-duced glycogen synthase activity was demonstrated in isolated muscle samples from the patients with LC (23).
More than 65% of the patients with LC show pro-tein-energy malnutrition because of their increased fat oxidation and decreased glucose oxidation (24). It was reported that fat oxidation rate measured in starved state after an overnight fast was increased because glycogen stores in the patients with LC was depleted in this condition (24). The nutritional condition is frequently reduced and about 70% of the patients with LC show some signs of malnutrition (25). It is well recognized that malnutrition contrib-utes to insulin resistance in the patients with LC (4, 26). Furthermore, lipotoxicity by NEFA cause in-sulin resistance (27, 28). With respect to REE, there was no significant difference in REE between Con-trol and LC patients. As patients with LC have been reported to have either increased (29), normal (30, 31), or decreased (32) resting metabolic rates, this issue remains controversial. The variability observed in the patients with LC, although there was no sig-nificant difference in REE between Control and the patients with LC. Whenever available, indirect calo-rimetry should be used to measure REE in the pa-tients with LC.
The mass and function of hepatocytes is reduced in the cirrhotic liver. Collagen accumulation in the Disse’s space may disturb glucose permission from endothelial cell of portal vein to hepatocytes (33, 34). It also reported that insulin resistance is associated
with more rapid fibrosis progression in chronic HCV infection (35, 36). Therefore, it is supposed that complication with DM indicates the advance in liver damage. The relation between glucose intolerance and the biochemical parameters in liver dysfunc-tion, degree of cirrhosis and energy metabolism in the patients with LC was not observed. The aver-age of estimated HGU in the patients with LC and normal subjects were 41.4% and 58.3% in HECGL study, respectively. Previous paper showed HGU was lower in LC patients than in chronic active hepa-titis patients and healthy volunteers (37). HGU did not decrease depend on severity of glucose intol-erance among LC groups. Thinking about severity of glucose tolerance in LC, but HGU showed sig-nificantly lower in LC patients than that in Control. Therefore, our data indicated that postprandial glu-cose uptake of the liver has already decreased in the patients with LC.
The characteristics of glucose intolerance in the patients with LC are unusual. Although some LC pa-tients exhibit fasting hypoglycemia, they also have postprandial hyperglycemia and continuous hy-perinsulinemia (37). Our results also showed that postprandial hyperglycemia was observed in the patients with LC despite fasting glucose levels were normal. In general, insulin resistance is considered to be composed of the following three metabolic de-fects : 1) reduced glucose uptake by the peripheral tissues ; 2) decreased splanchnic glucose uptake ; 3) overproduction of glucose by the liver. Several studies showed that peripheral and splanchnic glu-cose utilization is known to be impaired as a result of reduced nonoxidative glucose metabolism in the patients with LC (i.e., glycogen synthesis) (22, 37). Therefore, the main factor that contributes to postprandial hyperglycemia may be associated with insulin resistance.
It seemed that postprandial hyperinsulinemia may overcome peripheral insulin resistance in the patients with LC (38) so that NGT in OGTT was observed in 30% of patients with LC. Therefore, postprandial hyperglycemia might be one of other compensatory mechanism to disorders in glucose metabolism in the patients with LC, so that the over-all glucose disposal is normal in some patients with LC. These findings suggest that glucose intolerance may be initiating event for indicating liver dysfunc-tion and/or altered hepatic circuladysfunc-tion in the patients with LC at early stage.
Peripheral insulin resistance characterized by de-creased glucose transport and reduced glycogen
synthesis in skeletal muscle, whereas the insulin-induced increases in glucose phosphorylation, gly-colysis and glucose oxidation the patients with LC were reported (4, 22, 23, 39). Though, increased insulin level cannot ameliorate disturbed glycogen synthesis and disproportional increase in lactate pro-duction in the patients with LC (39). However, glu-cose transport, gluglu-cose phosphorylation, glycolysis, glucose oxidation and glycogen synthesis are all impaired in the patients with type 2 DM (40). Fur-thermore, it has been reported that further elevation of insulin level can normalize glycogen synthesis and glycolysis but not glucose oxidation and anaero-bic glycolysis in the patients with DM (40). Thus, changes in metabolic characteristics in the cirrhotic patients complicated with DM were obvious. In contrast, impaired insulin extraction and impaired counter regulation based on reduced glycogen store in liver tissue and abnormal glucagon secretion (41). These facts suggest that the cirrhotic patients complicated with DM will be fallen into hypoglyce-mia.
We concluded from the present study that insulin resistance in both liver and peripheral tissues is the early etiology of metabolic abnormality in the patients with LC and precious nutritional care will be needed at early stage of LC.
CONFLICT OF INTEREST
None of the authors have any conflicts of interest to declare.
ACKNOWLEDGEMENTS
This publication is based on work supported by Grant-in-Aid for Scientific Research from the Min-istry of Education, Science, and Culture, Japan. We wish to thank the doctors and nurses in the Depart-ment of Digestive and Pediatric Surgery, Tokushima University Hospital, for their help and cooperation during the study.
REFERENCES
1. Megysi C, Samols E, Marks V : Glucose tol-erance and diabetes in chronic liver disease. Lancet 2 : 1051-1055, 1967
2. Müller MJ, Böker KH, Selberg O : Metabolism
of energy-yielding substrates in patients with liver cirrhosis. Clin Investig 72 : 568-579, 1994 3. Nygren A, Adnev N, Sundblad L : Insulin up-take by the human alcoholic liver. Metabolism 34 : 48-52, 1985
4. Muller MJ, Willmann O, Rieger A, Fenk A, Selberg O, Lautz HU, Bürger M, Balks HJ, von zur Mühlen A, Schmidt FW : Mechanism of in-sulin resistance associated with liver cirrhosis. Gastroenterology 102 : 2033-2041, 1992 5. Muto Y, Sato S, Watanabe A, Moriwaki H,
Suzuki K, Kato A, Kato M, Nakamura T, Higuchi K, Nishiguchi S, Kumada H, Ohashi Y, Long-Term Survival Study (LOTUS) Group : Overweight and obesity increase the risk for liver cancer in patients with liver cirrhosis and long-term oral supplementation with branched-chain amino acid granules inhibits liver carcino-genesis in heavier patients with liver cirrhosis. Hepatol Res 35 : 204-217, 2006
6. Kasuga M, Ueki K, Tajima N, Noda M,
Ohashi K, Noto H, Goto A, Ogawa W, Sakai R, Tsugane S, Hamajima N, Nakagama H, Tajima K, Miyazono K, Imai K : Report of the Japan Diabetes Society/Japanese Cancer As-sociation Joint Committee on Diabetes and Can-cer. Cancer Sci 104 : 965-976, 2013
7. Calle EE, Rodriguez C, Walker-Thurmond K, Thun MJ : Overweight, obesity, and mortality from cancer in a prospectively studied cohort of U.S. adults. N Engl J Med 348 : 1625-38, 2003
8. Cavallo-Perin P, Cassader M, Bozzo C, Bruno A, Nuccio P, Dall’Omo AM, Marucci M, Pagano G : Mechanism of insulin resistance is human in human liver cirrhosis. J Clin Invest 75 : 1659-1665, 1985
9. Shmueli E, Walker M, Alberti G, Record CO : Normal splanchnic but impaired peripheral in-sulin-stimulated glucose uptake in cirrhosis. Hepatology 18 : 86-95, 1993
10. Petrides AS, Groop LC, Riely CA, De Fronzo RA : Effect of physiologic hyperinsulinemia on glucose and lipid metabolism in cirrhosis. J Clin Invest 88 : 561-570, 1991
11. Petrides AS, Vogt C, Schulze-Berge D, Matthews D, Strohmeyer G : Pathogenesis of glucose intolerance and diabetes mellitus in cirrhosis. Hepatology 19 : 619-627, 1994 12. Muller MJ, Pirlich M, Balks HJ, Selberg O :
Glucose intolerance in liver cirrhosis : Role of hepatic and non-hepatic influences. Eur J
ClinChemClinBiochem 32 : 749-758, 1994 13. Alberti KG, Zimmet PZ : Definition, diagnosis
and classification of diabetes mellitus and its complications. Part1 : diagnosis and classifica-tion of diabetes mellitus provisional report of a WHO Consultation. Diabet Med 15 : 539-553, 1998
14. Kawamori R, Morishima T, Ikeda M, Kubota M, Kishimoto M, Shiba Y, Matsuhisa M, Kodama M, Watarai T : Effect of strict meta-bolic control on glucose handling by the liver and peripheral tissues in non-insulin-depend-ent diabetes mellitus. Diabetes Res ClinPract 23 : 155-161, 1994
15. Ludvik B, Nolan JJ, Roberts A, Baloga J, Joyce M, Bell JM, Olefsky JM : A noninvasive method to measure splanchnic glucose uptake after oral glucose administration. J Clin Invest 95 : 2232-2238, 1995
16. Imano E, Kanda T, Ishigami Y, Kubota M, Ikeda M, Matsuhisa M, Kawamori R, Yamasaki Y : Interferon induces insulin resistance in pa-tients with chronic active hepatitis C. J Hepatol 28 : 189-193, 1998
17. DeFronzo RA, Tobin JD, Andres R : Glucose clamp technique : a method for quantifying in-sulin secretion and resistance. Am J Physiol 237 : E214-E223, 1979
18. Harris JA, Benedict FG : In : A biometric study of basal metabolism in man Carnegie Institute of Washington, Publication No, Washington DC, 1919, 279
19. Yamaguchi M : Japanese standard tables of food composition, 5th ed. In : Tokyo : Ishiyaku Publishers Inc, 1997
20. Gercia-Compean D, Jaquez-Quintana JO, Gonzalez JA, Maldonado-Garza H : Liver cir-rhosis and diabetes : risk factors, pathophysi-ology, clinical implications and management. World J Gastroenterol 15 : 280-288, 2009 21. Matsuhisa M, Shi ZQ, Wan C, Lekas M,
Rodgers CD, Giacca A, Kawamori R, Vranic M : The effect of pioglitazone on hepatic glucose uptake measured with indirect and direct meth-ods in alloxan-induced diabetic dogs. Diabetes 46 : 224-231, 1997
22. Selberg O, Burchert W, vd Hoff J, Meyer GJ, Hundeshagen H, Radoch E, Balks HJ, Müller MJ : Insulin resistance in liver cirrhosis. Posi-tron-emission tomography scan analysis of skeletal muscle glucose metabolism. J Clin Invest 91 : 1897-1902, 1993
23. Kruszynska Y, Williams N, Perry M, Home P : The relationship between insulin sensitivity and skeletal muscle enzyme activities in hepatic cirrhosis. Hepatology 8 : 1615-1619, 1988 24. Yamanaka H, Genjida K, Yokota K, Taketani Y,
Morita K, Miyamoto KI, Miyake H, Tashiro S, Takeda E : Daily pattern of energy metabolism in cirrhosis. Nutrition 15 : 749-754, 1999 25. Lautz HU, Selberg O, Korber J, Bürger M,
Müller MJ : Protein-calorie malnutrition in liver cirrhosis. ClinInvestig 70 : 478-486, 1992 26. Marchesini G, Pacini G, Bianchi G, Patrono D,
Cobelli C : Glucose disposal, beta-cell secre-tion, and hepatic insulin extraction in cirrhosis : a minimal model assessment. Gastroenterology 99 : 1715-1722, 1990
27. Lee Y, Hirose H, Ohneda M, Johnson JH, McGarry JD, Unger RH : Beta-cell lipotoxicity in the pathogenesis of non-insulin-dependent diabetes mellitus of obese rats : impairment in adipocyte-beta-cell relationships. ProcNatl Acad Sci U S A91 : 10878-10882, 1994
28. Yu C, Chen Y, Cline GW, Zhang D, Zong H, Wang Y, Bergeron R, Kim JK, Cushman SW, Cooney GJ, Atcheson B, White MF, Kraegen EW, Shulman GI : Mechanism by which fatty acids inhibit insulin activation of insulin re-ceptor substrate-1 (IRS-1)-associated phos-phatidylinositol 3-kinase activity in muscle. J Biol Chem 277 : 50230-50236, 2002
29. Müller MJ, Böker KH, Selberg O : Are patients with liver cirrhosis hypermetabolic? Clin Nutr 13 : 131-44, 1994
30. Sugihara K, Yamanaka-Okumura H, Teramoto A, Urano E, Katayama T, Mori H, Utsunomiya T, Shimada M, Takeda E : Recovery pattern of non-protein respiratory quotient and non-es-terified fatty acids after liver resection. Nutri-tion. 2013 Epub
31. Teramoto A, Yamanaka-Okumura H, Urano E, Nakamura-Kutsuzawa T, Sugihara K, Katayama T, Miyake H, Imura S, Utsunomiya T, Shimada M, Takeda E : Comparison of measured and predicted energy expenditure in patients with liver cirrhosis. Asia Pac J Clin Nutr. 2014 in press
32. Merli M, Riggio O, Romiti A, Ariosto F, Mango L, Pinto G, Savioli M, Capocaccia L : Basal en-ergy production rate and substrate use in stable cirrhotic patients. Hepatology 12 : 106-12, 1990 33. Sotaniemi EA, Keinänen K, Lahtela JT, Arranto AJ, Kairaluoma M : Carbohydrate intolerance
associated with reduced hepatic glucose phos-phorylating and releasing enzyme activities and peripheral insulin resistance in alcoholics with liver cirrhosis. J Hepatol 1 : 277-290, 1985
34. Nielsen MF, Caumo A, Aagaard NK,
Chandramouli V, Schumann WC, Landau BR, Schmitz O, Vilstrup H : Contribution of defects in glucose uptake to carbohydrate intolerance in liver cirrhosis : assessment during physiologi-cal glucose and insulin concentrations. Am J Physiol Gastrointest Liver Physiol 288 : 1135-1143, 2005
35. Hui JM, Sud A, Farrell GC, Bandara P, Byth K, Kench JG, McCaughan GW, George J : Insulin resistance is associated with chronic hepatitis C and virus infection fibrosis progression. Gas-troenterology 125 : 1695-1704, 2003
36. Fartoux L, Poujol-Robert A, Guéchot J, Wendum D, Poupon R, Serfaty L : Insulin resis-tance is a cause of steatosis and fibrosis pro-gression in chronic hepatitis C. Gut 54 : 1003-8, 2005
37. Imano E, Kanda T, Nakatani Y, Motomura M, Arai K, Matsuhisa M, Yamasaki Y, Hori M : Imapaire splanchnic and peripheral glucose up-take in liver cirrhosis. J Hepatol 31 : 469-473, 1999
38. Kruszynska YT, Meyer-Alber A, Darakhshan F, Home PD, McIntyre N : Metabolic handling of orally administered glucose. J Clin Invest 91 : 1057-1066, 1993
39. Meyer-Alber A, Hartmann H, Stumpel F, Creutzfeldt W : Mechanism of insulin resis-tance in CCl4-induced cirrhosis of rats. Gas-troenterology 102 : 223-229, 1992
40. Del Prato S, Bonadonna RC, Bonora E, Gulli G, Solini A, Shank M, De Fronzo RA : Characteri-zation of cellular defects of insulin action in type 2 (non-insulin-dependent) diabetes mel-litus. J Clin Invest 91 : 484-493, 1993
41. Petrides AS, DeFronzo RA : Failure of gluca-gon to stimulate glycogenolysis in well-nour-ished patients with mild cirrhosis. Metabolism 43 : 85-89, 1994