Article
Bull. Volcanol. Soc. JapanVol. 58 (2013) No. 1, pp. 59-76Comparative Study of Proximal Eruptive Events in the Large-scale
Eruptions of Sakurajima Volcano: An-ei Eruption vs. Taisho Eruption
Maya Y
ASUI*, Masaki T
AKAHASHI*, Jun S
HIMADA*,
Daisuke M
IKI**and Kazuhiro I
SHIHARA*** (Received January 4, 2011; Accepted December 4, 2012)The An-ei eruption (1779-1782 A.D.) and Taisho eruption (1914-1915 A.D.) were large-scale eruptions of Sakurajima Volcano. The latter, the largest eruption in Japan during the 20thcentury, produced about 1.5 km3DRE of andesitic magma. In both cases, flank eruptions from two sides of the volcano caused pumice fall and lava flows. The An-ei eruption occurred on the northeastern and southern flanks (An-ei NE and An-ei S eruptions, respectively) and the Taisho eruption occurred on the western and eastern flanks (Taisho W and Taisho E eruptions, respectively).
In the An-ei NE, two fissures are recognized from the alignments of craters: the main fissure (5 km long) and a minor fissure (1 km long). A large pyroclastic cone consisting of welded pyroclastic materials was formed along these fissures on the upper to middle flank slopes. Old drawings of the An-ei eruption show that a large amount of pyroclastic materials fell from the eruption column in the proximal area. Thus, the cone was considered to have formed simultaneously with the Plinian eruption. The presence of many cracks and a horse-shoe shaped depression on the cone is attributed to the deformation and collapse of the pyroclastic cone due to gravitational instability on the flank slope of the volcano. A stratigraphy of the eruption products shows that many lava lobes were formed after the initial Plinian eruption. In the An-ei S, the existence of a deformed pyroclastic cone sticking on the steep upper slope below the summit crater and clastogenic lava flows on the downslope indicate the syn-Plinian deposition of pyroclasitc materials on the steep slope. After then, effusion of lavas and some explosions occurred from the chains of craters on the middle flank slope.
The An-ei eruption progressed continuously in three stages. The initial Plinian eruption for up to two days on the upfissure (Stage 1) was followed by lava flows on the downfissure (Stage 2). Then, submarine eruption occurred intermittently for about two years on the NE offshore (Stage 3). In the case of the Taisho eruption, initial Plinian eruption (Stage 1) was followed by lava flows associated with the intermittent Vulcanian eruptions (Stage 2) and then, gentle lava outflow continued for more than 1.5 years in the Taisho E in Stage 3. In both eruptions, progress from an explosive pyroclastic eruption at a higher flank in Stage 1 to the effusion of lava at a lower flank in Stage 2 could be explained by the propagation of a radial dyke.
Although the pyroclastic cone of the An-ei NE and Taisho W are large in scale, the syn-Plinian clastogenic flow and cone collapse of the Taisho W were extensive. On the other hand, the cone of the An-ei S and Taisho E are small in scale. The cone of the An-ei S was deformed on the steep slope. From these variations, the intensity and duration of the Plinian eruption and the gradient of the flank slope would result in the various morphologies of the resultant cone. Concerning the growth of the edifice of Sakurajima Volcano, the proximal process in which the pyroclastic materials plaster the flank slope in Stage 1 does not contribute to the growth of the summit area, but to that of the flank slopes. The intense proximal deposition of pyroclastic materials during the initial vigorous Plinian eruption and the following lava flow mean that a rapid response against fires caused by pyroclast fallout and lava flows from multiple craters on eruptive fissures is needed to minimize damage in future eruptions.
Key words: Plinian eruption, proximal deposition, pyroclastic cone, clastogenic lava
1.Introduction
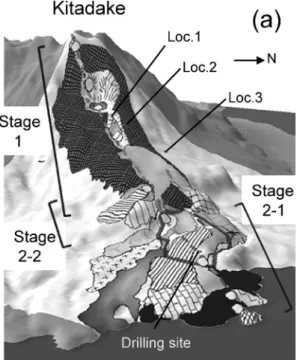
Sakurajima Volcano is located in southern Kyushu. It is composed of two volcanic edifices, Kitadake (1117 m a.s.l.)and Minamidake (1040 m) (Fig. 1). There have been
Yokoyama, Kagoshima-shi, Kagoshima 891-1419, Japan. 2-1-34, Nanryo-cho, Uji, Kyoto 611-0028, Japan. Corresponding author: Maya Yasui
e-mail: [email protected]
***
Department of Geosystem Sciences, College of Humanities and Sciences, Nihon University, 3-25-40, Sakura-josui, Setagaya-ku, Tokyo 156-8550, Japan.
Sakurajima Volcano Research Center, Disaster Preven-tion Research Institute, Kyoto University,
Sakurajima-*
many large-scale eruptions of Sakurajima Volcano. In historic times, four large-scale eruptions occurred, i.e., in 764-766 A.D. (Tenpyo era), 1471-1476 (Bunmei era), 1779-1782 (An-ei era), and 1914-1915 (Taisho era) (Kobayashi, 1982, 2009). In particular, in the case of the Taisho eruption, lava spread extensively, causing Sakura-jima island to become connected to the Osumi Peninsula in 1914 (Fig. 1). In 1946, lava issued from the eastern upper flank slope of Minamidake in 1946 (Kobayashi, 1982). Ash-emitting eruptions with or without detonations have been occurring from the crater of Minamidake since 1955 (Kobayashi et al., 1988). This type of eruption has been frequently observed in the 1946 crater since 2008 (Iguchi
et al., 2010).
Generally, near-vent processes are crucial for under-standing eruption phenomena. Geologic investigations of eruption products in a proximal area give us detailed information on how eruption phenomena progressed along an eruptive activity. In this study, we focus on the pro-ximal products of the An-ei and Taisho eruptions. In both cases, flank eruptions occurred on two sides of the volcano generating pumice fall and lava flows (Fig. 1). They are both documented eruptions and their eruption products are well-preserved. Furthermore, drilling core samples from lava fields for both eruptions enable us to investigate the
stratigraphy of deposits. Therefore, the two eruptions are good examples for the case study of the large-scale erup-tion of Sakurajima Volcano.
Geologic features of the eruption products, eruption sequence and eruption style of the Taisho eruption have already been summarized by Yasui et al. (2007). Thus, we will present those of the An-ei eruption. Then, we will compare the eruption sequences and styles of the two eruptions. In particular, we will examine the phenomena in a proximal area in the initial phase and discuss their implications in detail. Hereafter, we will call the flank slopes in the An-ei and Taisho eras An-ei NE and An-ei S, and Taisho W and Taisho E, respectively.
2.Previous studies of the two large-scale eruptions 2-1 Eruption sequence and eruption style of the
Taisho eruption
The Taisho eruption of Sakurajima Volcano was the largest eruption in Japan in the 20thcentury, which pro-duced andesitic magma of about 1.5 km3DRE (dense rock equivalent) (Ishihara et al., 1981). Many previous studies of the eruption have been reported. Studies based on eyewitness accounts of the eruption are important for re-constructing the eruption sequence (e. g., Koto, 1916; Omori, 1914, 1916a, b, 1920a, b, 1922; Yamaguchi, 1967,
Fig. 1. Index map of Sakurajima Volcano and the distributions of the eruption products of the An-ei and Taisho eruptions. Isopach maps of pyroclastic fall deposits of the two eruptions by Kobayashi (1986) are shown. Thickness in cm. Based on the bathymetric map (Japan Coast Guard, 1990) and Ishihara et al. (1981), the areas of submerged lava flows are also shown. The squares on the map show the areas in Figs. 2 and 3. Abbreviation of the place-names are as follows; FJ: Fujino, T: Take, KO: Koike, H: Hakamagoshi, Y*: Yokoyama, A* Akobaru, K: Karasu-jima (buried island), F: Furusato, AR*: Arimura, WK*: Waki, ST*: Seto, KR: Kurokami, SJ: Shinjima, SO: Sonoyama. *: Buried villages in 1914.
1975). Yasui et al. (2006) compiled these records and Yasui et al. (2007) gave a geological description of the eruption products and established a stratigraphy of the deposits. The following is a summary of their results.
The uppermost crater in the Taisho W locates at an altitude of approximately 450 m (C1 in Fig. 2a) and that in the Taisho E at an altitude of 400 m (C1 in Fig. 2c). The length of the fissure in the Taisho W is estimated to be approximately 2 km and that on the Taisho E is 2.3 km. The eruption products of the Taisho eruption are composed of many eruptive units of pyroclastic deposits and lava flows. Thick pyroclastic materials formed pyroclastic cones in the proximal area on both sides. 17 units of lava
flow on the western side and 21 units on the eastern side can be defined.
Yasui et al. (2007) showed that the eruption style of the Taisho eruption changed with time, and they divided the activity into three stages (Fig. 2e). Fig. 2 shows the dis-tributions of pyroclastic cones and lava flows that formed in each stage. The eruption occurred from eruptive fissures on the western and eastern flanks (Fig. 1). The initial, vigorous Plinian eruption started at approximately 10 am on January 12th, 1914 and lasted for about 36 h (Stage 1). The photographs taken at that time show that a large amount of pyroclastic materials from the Plinian eruption column fell into the proximal area. Several villages (KR,
Comparative Study of Proximal Eruptive Events in the Large-scale Eruptions of Sakurajima Volcano:
An-ei Eruption vs. Taisho Eruption 61
Fig. 2. Distributions of eruption products of the Taisho eruption. (a) Stage 1 on the western side. (b) Stage 2 on the western side. (c) Stages 1 and 2 on the eastern side. (d) Stage 3 on the eastern side. (e) Duration and eruption styles of each stage (modified from Fig. 18 of Yasui et al., 2007). For details of the stratigraphy, see Yasui et al. (2007). Lava units are labeled as W1 and E1. Craters are labeled as C1 and C2. Assumed fissures are shown in Figs. 2a and 2c.
ST, AR, and WK in Fig. 1) were burnt by falling pyroclasts within several hours from the onset of the Plinian eruption (Omori, 1916a). According to the records, minor pyro-clastic flows occurred on several occasions, setting houses of several villages (Y, KO, A, T, and FJ in Fig. 1) on fire in Stage 1. Thereafter, lava extruded for about 20 days on both sides (Stage 2). Lava spread widely on the seafloor on the Taisho E in Stage 2 (Fig. 2c). Intermittent ash-emitting eruptions with or without detonations occurred in Stage 2 indicating occasional Vulcanian eruptions simul-taneous with lava flows. Subsequently, the number of ash-emitting eruptions decreased and a gentle lava outflow continued for more than 1. 5 years on the eastern side (Stage 3). Consequently, vast lava fields, which consisted of a number of flow units, formed on both sides of the volcano. Small-scale lava deltas also developed on the eastern side (Fig. 2d). Eyewitness accounts reported that lava entered the ocean at several points starting from several months after the start of Stage 3. On the basis of the descriptions of the eruption and the topographic features, Yasui et al. (2007) deduced that lava tube systems were formed to feed lava and lava deltas formed on the southern coast (Fig. 2d).
Yasui et al. (2007) discussed the type of lava of the Taisho eruption mainly on the basis of petrographic fea-tures. In particular, they focused on the broken crystal content that is useful for distinguishing coherent lava from clastogenic lava. Since broken crystals are dominant in free crystals of pumice fall deposits (Yasui and Suganuma, 2003), they are probably formed during explosive erup-tions such as a Plinian eruption (Yasui, 2012). To investi-gate the type of lava of the Taisho eruption, the proportion of broken plagioclase phenocrysts [volume of broken pla-gioclase phenocrysts/total volume of plapla-gioclase pheno-crysts×100 (refered to as BPL hereafter)] was measured for 81 thin sections of lava samples from the Taisho eruption (Figs. 16 and 17 in Yasui et al., 2007).
The following features indicate that the lava flows in Stage 1 on both sides are of clastogenic origin. The lava (e.g. W4 and W10 in Fig. 2a, and E4 in Fig. 2c) shows a high BPL content of approximately 70 % and a distinct eutaxitic texture under a microscope. It is the same as a drilling core sample that represents a 30-m-thick lava (open circle in Fig. 2a). The surface blocks of the lava flows consist of pyroclastic materials. Various degrees of welding are recognized even within a single block. The nonwelded part of a single block consists of porous, reddish-brown, oxidized pyroclasts that are reasonably well sorted. Some of the flow units on the western side can be traced upstream to a collapsed pyroclastic cone that is indicated by a depression surrounded by a horse-shoe shaped scarp (Fig. 2a). From these facts, it is considered that cone growth, partial collapse of the cone, and generation of the clastogenic lava occurred simultaneously with Plinian eruption in Stage 1 in the Taisho W.
In contrast to the lava in Stage 1, the lava in Stage 3 contains much smaller amounts of broken crystals, with a BPL of approximately 20 % and shows no eutaxitic texture, indicating a gentle outflow of coherent lava.
The lava in Stage 2 contains broken crystals with a BPL of approximately 50 %. Its flows show a distribution that resembles ginkgo leaves (Figs. 2b and 2c) suggesting that they are coherent flows that overflowed from the craters. Since these lava flows were associated with frequent ash-emitting eruptions, magma in the conduit was thought to have experienced repeated fragmentation and coalescence due to intermittent explosions prior to the outflow.
2-2 Eruption sequence of the An-ei eruption
The distribution of eruption products of the An-ei eruption has been described in previous studies (e. g., Fukuyama, 1978; Kobayashi et al., 1988). Imura (1998a) examined historical records of the An-ei eruption in detail and reconstructed its eruption sequence. According to Imura (1998a), a Plinian eruption started at around 2 pm on November 8th, 1779 on the southern flank of Minamidake and on the northeastern flank of Kitadake in succession (Fig. 1). The Plinian eruption on both flanks became intense, reaching its climax from the evening of November 8thto the following morning. On the night of November 10thor the following morning, the eruption on the southern side ceased and lava reached the southern coast of Sakurajima. The eruption on the northeastern side ceased at around 2 pm on November 10thand lava reached the ocean on that day. Aramaki and Kobayashi (1986) pointed out that the lava flows were generated from a chain of craters on both sides. However, it is not clear when the lava started flowing on both sides. According to Kobayashi (2009), submarine eruption started on the northeastern offshore just before the lava reached the ocean on the northeastern coast. Intermittent submarine eruptions con-tinued for more than a year and eight islands collectively named the An-ei islets (Fig. 1) had appeared by 1782. These islands are on a plateau-like rise with a diameter of about 4 km on the sea floor (Fig. 2 in Kobayashi, 2009). These islands are composed of lava or uplifted sediments on the sea floor. Kobayashi (2009) also examined old documents and concluded that a submarine cryptodome first intruded below the seafloor and then phreatomagmatic eruptions continued in the shallow waters. Takahashi et
al. (2011) discussed the difference between the
whole-rock chemical compositions of terrestrial deposits and subaqueous drilled lava samples. They concluded that magma that erupted into Sakurajima and the magma that intruded below the seafloor were not derived from the same parental magma. Thus, the magma with a different chemical composition is thought to have intruded to form a submarine cryptodome after the generation of lava flows on the northeastern flank in Stage 2. According to Aramaki and Kobayashi (1986), the volume of the terrestrial de-posits including the lava and pumice fall is about 0.83 km3
DRE. Ishihara et al. (1981) estimated the total volume of the An-ei eruption as about 1. 7 km3 DRE including subaqueous lava.
3.Description of the eruption products of the An-ei eruption
For convenience, we divide the flank slope into three: upper, middle, and lower flanks (Figs. 3a and 3b). The upper flank corresponds to the steep slope below the crater rim of summit craters and the gradient of this slope is between 20 and 30 degrees. The altitude between the upper and middle flanks is about 500 meters and that between the middle and lower flanks is about 100 several meters. The gradient of the middle-flank slope is between 10 and 20 degrees and that for the lower flank slope is less than 10 degrees. The lower flank on the southern side is narrow (Fig. 3b), indicating that the average gradient of the slope is steeper on the southern side than on the northeastern side.
3-1 Eruption products of An-ei eruption on the northeastern side
3-1-1 Topographic features
Pyroclastic cones, craters, and lavas are observed in aerial photographs in the An-ei NE (Fig. 3a).
Pyroclastic cones
Three pyroclastic cones are recognized: X, Y, and Z (Fig. 3a). Cone X is the largest extending from the upper to the middle flank slope. Many cracks develop on its surface on the middle flank slope (labeled A in Fig. 3a). Similar cracks also exist on the eastern edge of the cone (labeled B in Fig. 3a). Cone Y is the medium-sized one, distributing the boundary part of the middle to lower flank slopes (labeled Y in Fig. 3a). Although a large area is covered by lava flows, the scattered flat areas and a cliff indicate a plateau-like morphology. Cone Z is the smallest; it has a semicircular ridge suggesting it to be a remnant of a conical body.
Comparative Study of Proximal Eruptive Events in the Large-scale Eruptions of Sakurajima Volcano:
An-ei Eruption vs. Taisho Eruption 63
Fig. 3. Topographic features of the eruption products of the An-ei eruption.
(a) Northeastern side. Solid square shows the cliff mentioned in section 3-1-1. Spatial distribution of the cone X, Y, and Z is also shown.
Craters
Many depressions with diverse shapes are observed, most of which are bowl-shaped craters. They are labeled 1 to 12 (Fig. 3a). Crater 3 on the upper flank slope at the altitude of about 610 m is the largest circular crater with a diameter of 600 m (Fig. 3a). Mortar- and bowl-shaped craters (5, 6, 8, 9, and 10-12) with diameters between 60 and 130 m are scattered on the middle to lower flanks. Since their localities continue to lava lobes, they are possible sources of lava flows. This will be discussed in detail in section 4-1-2. Crater 7 is a tiny crater on the lava lobe. There is a deep gully (labeled D1 in Fig. 3a) connecting two bowl-shaped craters, i.e., craters 1 and 2 (Fig. 3a). D2 is a long and narrow depression that corresponds to the present valley bottom. D3 is a shallow depression surrounded by a horse-shoe shaped scarp (Fig. 3a). From their shapes and localities, D1 and D2 may represent eruptive fissures and D3 may represent a collapsed topography. Origin of D3 will be discussed in section 4-1-2.
Lava
Lava is subdivided into lava lobes and depression-filled lava. Most of the lava shows lobelike distribution.
Multiple lava lobes (e.g., a, g, i, and o in Fig. 3a) are observed on the middle to lower flank slopes. The lengths of lobes range from several hundred meters to 1 km. A circular arclike folded texture that is concave in the downward direction developed on the surface of the lava lobes, indicating the flow direction of each lobe. Distinct lava levees are observed on lobes (a, g, and i in Fig. 3a). Mounds are present on the surface of lobes h, l, m, and o (Fig. 3a). A cliff, shown by a solid square in Fig. 3a, is observed midstream of g and i. It appears that these flows crept down the cliff and spread downstream. The cliff corresponds to the edge of cone Y. In the coastal area, lobe
c spread to form a lava delta (Fig. 3a). The distribution of
the lava shown by the bathymetric map (Japan Coast Guard, 1990) indicates that some of the lava entered the ocean and spread on the ocean floor less than 1 km from the present coastline (Fig. 1). Although the ocean entry sites are unclear from the aerial photographs, lobes a, c, e and f are possible candidates of the submerged flows, judging from their distributions on-land.
Lavas n, p and q are depression-filled lavas (Fig. 3a). Lava n fills D3. Circular arclike cracks that are concave in the upward direction develop on the smooth surface of lava
n. Lava q is dome-shaped and occupies the bottom of
crater 3. This is clearly recognized in the aerial photo-graph taken in 1974. Lava p is a massive lava with a flat surface burying D2.
3-1-2 Geological features
The geological features of the An-ei eruption products on the upper flank were observed in this study on the northeastern side. A thick pyroclastic deposit composed of many units with various occurrences is seen on the upper flank. However, it was difficult to observe the surface features on the middle to lower flank because of thick vegetation and cultivation.
A section of the thick pyroclastic materials consisting of cone X is observed at localities 1 and 2 (Fig. 4a). At locality 1 (Fig. 3a), nonwelded pyroclastic materials of 18 m thickness overlie a welded part of more than 45 m thickness (Fig. 4b). The main constituents are reddish-brown to grayish vesicular pyroclasts with glassy lithic fragments. The deposits are mostly matrix-supported. However, clast-supported parts and layers are sometimes observed in the deposit. The pyroclastic deposit often contains many coarse grains, suggestive of proximal ballistic origin. Fractured surface of the welded part is exposed on the valley bottom (labeled C in Fig. 4b).
Welded pyroclastic materials are exposed on the northern wall of D2 at locality 2 (Fig. 4c). The degree of welding changes within a single outcrop. The occurrence is sometimes chaotic, containing a patchy massive part and a nonwelded well-sorted part (Fig. 4d). A distinct eutaxitic texture and many broken crystals are observed in the densely welded rock under a microscope (Fig. 5).
Stratified pyroclastic deposits with a total thickness of
Fig. 3. Continued.
(b) Southern side. The contact relationship between lava flows was determined using aerial photographs.
about 180 cm are exposed on the gully wall at locality 3 (Fig. 4e). About five layers with scoriaceous and pumi-ceous components are observed (Fig. 6). Some layers are lenticular, becoming thin in the horizontal direction. Layers 1 and 3 are composed of scoriaceous blocks and are clast supported. Angular scoriaceous blocks with a diameter of about 20 cm comprise layer 1. Glassy lithic fragments are found in layer 3. Layers 2, 4, and 5 are not well-sorted. Large scoriaceous blocks concentrate in the upper part of layer 4 and are densely welded. Layer 5 contains
charcoal. Most of the layers are assumed to be small-scale pyroclastic flow deposits.
The pyroclastic deposits described above consist of vesicular pyroclastic materials, suggesting that they were related to a pyroclastic eruption of Plinian style.
3-1-3 Drilling core samples
A drilling core exists in the area of lobe g (Fig. 3a). It was drilled by the Sakurajima Volcano Research Center of Kyoto University (SVO) to install devices for monitoring the volcano. The drilling site is located at an altitude of
Comparative Study of Proximal Eruptive Events in the Large-scale Eruptions of Sakurajima Volcano:
An-ei Eruption vs. Taisho Eruption 65
Fig. 4. Photographs showing the proximal pyroclastic materials of the An-ei eruption at localities 1, 2, and 3 on the northeastern side. For localities, see Fig. 3a. (a) Upper flank slope seen from locality 2. (b) Thick pyroclastic deposit at locality 1. (c) Thick welded pyroclastic deposit at locality 2. (d) Closeup view of the chaotic occurrence at locality 2. Flattened blocks are seen. Scale: 33 cm. (e) Lower half of the pyroclastic deposit at locality 3. Layers [2] to [5] are seen. For details, see the columnar section in Fig. 6. Scale: 1 m.
126 m above sea level. The total depth of the core is 122 m. Vertical changes in the occurrence, apparent density, grain size of the groundmass and chemical composition are observed throughout the core.
The core from the surface up to a depth of 2 m is composed of ash (Fig. 7a) mostly derived from the recent Vulcanian activity. Below 2 m, a lava continues up to a depth of about 100 m. It is reddish gray from depths of 2 m to 30 m, and dark-gray and glassy from depths of 30 m to 45 m and 82 m to 100 m. The core between 45 and 82 m is pinkish, pale-gray lava with platy joints. Porous breccias with approximately 5 cm long are intercalated at depths of 34, 36, 41, 42.5 and 46 m. The cores at depths between 6 and 14 m and between 52 and 58 m are reddish, suggesting oxidation. No core samples were recovered at depths between 102 and 109 m. Miki et al. (2003) showed the paleomagnetic features of the core samples, indicating that the core below 109 m is made up of the products of Kitadake Volcano. This is also confirmed in this study on the basis of the chemical composition. Four lava frag-ments 20 to 40 cm long were recovered at depths between 92 and 96 m. These fragments also have a chemical com-position identical to that of Kitadake Volcano.
Samples at depths greater than 20 m have apparent densities of approximately 2. 5 g/cm3, whereas those at depths less than 20 m have smaller densities (Fig. 7b).
The drilling core samples are heterogeneous to the naked eye regardless of depth. In particular, at depths of approximately 8 and 21 m, reddish-brown lenses are randomly distributed in the gray matrix. A eutaxitic texture and broken crystals are observed under a micro-scope. BPL varies from 35 to 87 % for nine core samples and samples with a high BPL content more than 60 % are
dominant (Fig. 7c).
The phenocryst contents of 32 thin sections show a narrow range of approximately 16 vol.% throughout the depth (Fig. 7d). The grain size of the groundmass changes with depth. From the surface, the average grain size gradually increases toward the center and then decreases with depth (Fig. 7e).
The SiO2content of the drilling core samples (Takahashi
et al., 2011) has a wide vertical variation and changes
systematically with depth. The SiO2contents range from 63.3 to 66.6 wt.%. From the bottom, the SiO2content increased sharply from approximately 63.8 to 66.6 wt.% and then decreased to 63.6 wt.% (Fig. 7f).
3-2 Eruption products of An-ei eruption on the southern side
The area covered by the eruption products is small on the southern side compared with that on the northeastern
Fig. 5. Photomicrograph of the densely welded part of the pyroclastic materials at locality 2. For locality, see Fig. 3a. A markedly eutaxitic texture can be observed. Lines denote the broken surfaces of plagioclase. Open nicol.
Fig. 6. Columnar section of the eruption products ob-served in locality 3. For locality, see Fig. 3a. Details are described in section 3-1-2.
side (Fig. 1). A pyroclastic cone (cone A) is on the upper flank slope (Fig. 3b). Many cracks develop on the surface of the cone and the talus deposit covers the foot of cone. A smaller cone (cone B) is on the lower edge of cone A.
The uppermost bowl-shaped crater, crater I, is located on the steep slope of 27 degrees at an altitude of about 760 m a.s.l., which is just below the crater rim of Minamidake. This crater I is surrounded by cone A, whereas crater III is surrounded by cone B. A chain of small craters, i. e., craters V, VI, and VII, are on the lava field, forming en
echelon alignments (Fig. 3b). They extend to the
NNE-SSW directions. Craters II, III, and IV also make an alignment in the same direction.
At least five lava lobes are recognized: lobes 1〜4, and
6. Their contact relationships are shown in Fig. 3b. The
upstream regions of lobes 1 and 2 continue to cone A. The source craters of each lobe are assumed as follows: crater II for lobes 3 and 6, and crater IV for lobe 4 (Fig. 3b). Lava 5 seems to be a small-scale dome. The preservation of the surface morphology is ideal for lobe 4 and dome 5, indicating that their effusion occurred last among the products described above. On the other hand, the surface of lobe 3 is flat suggesting that it was buried by ash.
A sample from lobe 1 (locality a in Fig. 3b) shows a distinct eutaxitic texture and a high BPL of 68 %, indicating its origin to be a densely welded pyroclastic rock.
3-3 Bulk-rock chemistry of An-ei eruption products
Here, bulk-rock chemical compositions are compared among the eruption products from the pumice fall deposit, proximal pyroclastic materials, on-land lava (Fig. 8) and drilling core samples. The data are from Takahashi et al. (2011). The SiO2contents of the overall eruption products of the An-ei eruption range from 63.3 to 66.6 wt.%. These data show a single trend on a variation diagram (Fig. 9). The SiO2content of the on-land lava has an intermediate composition range from 64.9 to 65.7 wt.%; that of the proximal pyroclastic materials of cone X has a range from 64.7 to 66.6 wt.%. The SiO2content of pumice grains of the An-ei pumice fall deposit has a rather narrow range centered at approximately 65 wt.%. On the other hand, the SiO2content of the drilling core samples has a wide range from 63.3 to 66.6 wt.%. (Fig. 9).
4.Discussion
Regarding the An-ei eruption, the erupted volume on the
Comparative Study of Proximal Eruptive Events in the Large-scale Eruptions of Sakurajima Volcano:
An-ei Eruption vs. Taisho Eruption 67
Fig. 7. Columnar section and down-hole variations of the drilling core at the Shirahama observation well in the An-ei NE. The drilling site is shown in Fig. 3a. (a) Columnar section and lithology. A: volcanic ash, RG: reddish-gray lava, DG: dark-gray lava, PG: pinkish, pale-gray lava, BR: breccia, LF: lithic fragment, N: no core sample, open circle: vesicle concentrated zone, solid square: lithic fragment of Kitadake lava, arrow: oxidized zone. (b) Density (g/cm3). To measure
the apparent density, drilling core samples were cut into columns whose volume and weight were measured. (c) Broken plagioclase (BPL) content (%). (d) Phenocryst content (vol.%). (e) Average grain size of groundmass plagioclase (μm). The length of the long axis of groundmass plagioclase was measured for 28 thin sections. Here the average groundmass size was determined by measuring the long axis of ten grains of plagioclase here. (f) Bulk SiO2content (wt.%).
northeastern side is larger than that on the southern side, as determined from the areas of the lava flows (Fig. 1). Since much information is available from the An-ei NE, we discuss the activity on the northeastern side predominantly in the first half of this chapter. In the second half, we compare the An-ei eruption to the Taisho eruption and discuss the implication of the proximal deposition of pyroclastic materials.
4-1 Eruption sequence and eruption style of the An-ei eruption on the northeastern side 4-1-1 Stratigraphy of eruption products on the
An-ei NE
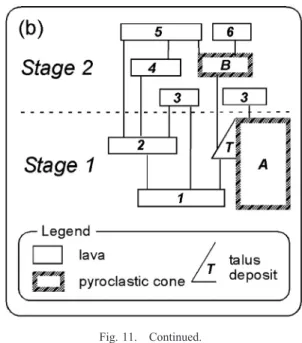
The eruption order in the An-ei NE is discussed from the stratigraphy in this section. On the basis of the contact relationship (Fig. 10), we deduced the stratigraphy of the An-ei eruption products on the northeastern side (Fig. 11a). The lobes on the middle flank slope (lobes j〜o) are at the upper level of the succession, while those on the lower flank slope (e.g., lobes a〜i) are at the lower level (Fig. 11a). This indicates that the lobes on the middle flank slope were formed in a later stage, while those on the lower flank were formed in an early stage.
Furthermore, the drilling core gives us important information on the stratigraphy beneath the surface. As described in section 3-1-3, an approximately 100-m-thick deposit from the An-ei eruption was confirmed at the drilling site (Fig. 7). The chemical composition of the deposit changes vertically throughout the core (Fig. 7f). This indicates that the whole deposit is not a single flow unit of lava but a pile of several units of lava and/or pyroclastic materials. The drilling site is in the area of lobe g (Fig. 3a). The thickness of lobe g is estimated to be approximately 20 m from its topography. The chemical composition of the upper 20 m of the drilling core is almost constant (Fig. 7f). Therefore, the upper 20 m of the drilling core corresponds to lobe g. Stratigraphically, core samples at depths between 20 and 50 m may correspond to
the underlying cone Y. The core samples at depths between 50 and 82 m correspond to lobe c because they have similar compositional ranges to the lava of lobe c (Figs. 7f and 8). Core samples at depths between 82 and 100 m hav e SiO2contents of less than 65 wt.%, indicating the presence of buried products (? in Fig. 11a) with a more mafic composition than lobe c.
4-1-2 Proximal processes on the An-ei NE
The An-ei NE craters distribute along two linear lines. Two distinct fissures are inferred; namely, the southern and northern fissures (Fig. 10) which we consider as the major and minor fissures, respectively. The main fissure is about 5 km long and the minor one is 1 km long. The long and narrow depressions D1 and D2 are also indicative of the main fissure (Figs. 3a and 10).
Upper to middle flank slopes
In some old drawings (Photos 2 and 7 in Imura 1998b), abundant pyroclasts falling from a vertical eruption column into a proximal area in the initial Plinian phase were shown. This is consistent with the existence of a thick proximal pyroclastic deposit along the fissure at localities 1 and 2. The existence of a thick, densely welded part of pyroclastic materials (Fig. 4c) suggests a continuous pyroclastic eruption. The stratification of the proximal deposit indicates intermittent eruptions and/or temporal variations in eruptive intensity during the continuous pyroclastic eruption. We conclude that co-Plinian proximal deposition played an important role in the formation of pyroclastic cones (hereafter referred to as the “co-Plinian fountain”). Cone X is considered to have formed throughout the initial Plinian eruption. Its elongated shape implies that the Plinian eruption occurred
Fig. 8. SiO2content of lava lobes in the An-ei NE. Units
and craters are the same as those in Fig. 10.
Fig. 9. SiO2vs. CaO diagram for the eruption products of
the An-ei eruption. The raw data are summarized in Table 1 (No.123-190) in Takahashi et al. (2011). See Appendix C, D, F, and G in Takahashi et al. (2011) for the localities. Drilling core samples and proximal pyroclasts are of in the An-ei NE. For on-land lava, samples are taken from the northeastern and southern side. Pumice fall deposits are taken from a locality about 1. 8 km ESE from locality 1. See Fig. 3a for locality 1.
from the fissure on the upper to the middle flank slopes. Imura (1998b) considered that the Plinian eruption started from a point directly below the summit of Minamidake on the southern side, and then the Plinian eruption on the northeastern side followed immediately after. Therefore, the upper half of the main fissure (Fig. 10) is thought to be the eruptive center of the initial Plinian eruption. A semicircular, large crater, crater 3 between D1 and D2 might be a point of the intense eruption on the fissure (Fig. 10).
Middle flank slope
Cracks develop on the smooth outer surface of cone X (labeled A in Fig. 3a). In particular, the development of cracks is distinct on the northeastern edge of cone X (label B in Fig. 3a) that covers the thick lava from Kitadake Volcano (Fig. 12a). It is considered that these cracks originated from the deformation of the inner, densely welded part of the cone due to gravitational instability. This is because the pyroclastic cone was formed on the flank slope of the volcano. The occurrence at the locality
1 that the fractured welded part hanging down (labeled C in Fig. 4b) is consistent with the deformation of the cone. Furthermore, circular arclike cracks that are concave in the upward direction develop in lobe n. The upstream region of lobe n corresponds to a shallow depression, D3, and a folded texture develops in the downstream region. These occurrences are similar to those observed in the collapsed pyroclastic cone shown by Sumner (1998) and Shimano and Koyaguchi (2001). It is concluded that the gravitational instability of cone X on the slope caused the partial collapse of cone X to form D3.
Crater 5 is surrounded by a semicircular ridge (cone Z in Fig. 10). Judging from its shape, it is a small-scale pyroclastic cone that developed around crater 5. Lobe o, one of the later flows in the An-ei NE (Fig. 11a), continues to crater 5. These facts suggest that a cone-building eruption occurred at crater 5 and that the cone was destroyed by the flow of lobe o. It is also possible to interpret that a syn-eruptive cone collapse occurred to generate lobe o.
Comparative Study of Proximal Eruptive Events in the Large-scale Eruptions of Sakurajima Volcano:
An-ei Eruption vs. Taisho Eruption 69
Fig. 10. Distribution of individual units of lava, pyroclastic cones and craters in the An-ei NE. The contact relationship between lava flows was determined using aerial photographs.
Lower flank slope
The existence of multiple craters and parallel flows on the lower flank slope indicates the activities on the fissure. There is a tendency for a lava lobe to continue to a certain crater (Figs. 3a and 10), indicating its source. For example, the source of lobes g and i is inferred to be crater
12 (Fig. 10). The following are correlations of lobes to
craters; lobe m to crater 10, lobe o to crater 5, lobe l to crater 11, lobe e to crater 8, and lobe f to crater 9. The sources of lobes a, b, c, d, and j are not known. Lobes a and b might have originated somewhere between craters 6 and 7. On the other hand, since crater 7 opens through lobe g, it is considered to have developed after the emplacement of the flow.
For the drilling core samples, the groundmass plagioclase is coarser in the central part of the drilling core than in the upper and lower parts (Fig. 7e). This fact implies that the drilling core samples correspond to a single cooling unit. In other words, the accumulation of the deposits at the drilling site on the lower flank is considered to have been completed within a short period. To discuss the origin of lava flows, Yasui et al. (2007) focused on the petrographic features of the eruption products including broken crystals, as reviewed in section 2-1. The core sample of lobe g has the nature of a welded pyroclastic rock with a eutaxitic texture and abundant broken crystals, meaning that lobe g is very likely to be clastogenic lava. Lava fragments with the chemical composition of Kitadake Volcano appear at depths greater than 80 m. Since such fragments are unlikely to be
entrained in coherent lava during the effusion, they were probably trapped throughout the pyroclastic eruption. Since the drilling site is nearly on the main fissure (Fig. 10), materials at the depths between 82 and 100 m may be pyroclastic deposits (label ? in Fig. 11a). This suggests that there is a buried pyroclastic cone. The timing of formation of the buried cone might have overlapped with that of the cone X (Fig. 11a).
4-1-3 Eruption sequence and eruption style in the An-ei NE
The eruption sequence on the An-ei NE can be divided into three stages mainly on the basis of the stratigraphy (Fig. 11a): Stage 1, syn-Plinian stage; Stage 2, post-Plinian stage; and Stage 3, subsequent subaqueous eruption. Stage 1: A vigorous Plinian eruption started at around 2 p.m. on November 8thand continued for up to 48 hours (Imura, 1998a). At the same time, co-Plinian fountaining generated an intense fallout of pyroclasts in the proximal area to form a large-scale pyroclastic cone (cone X) on the upper and middle flank slopes. Small-scale pyroclastic flows were generated on the middle flank slope in this stage from the occurrence of outcrop at locality 3 (Fig. 6). The Plinian eruption ceased on the evening of November 10th(Imura, 1998a).
Stage 2: Stage 2 is divided into two substages on the basis of the stratigraphy and the difference in the altitude of the flow field of lava. In Stage 2-1, many lava lobes were generated to form parallel flows on the lower flank (lobes a〜i). These flows were from chains of craters along the fissures (Figs. 10 and 12a). As discussed above, pyroclastic materials (cone Y and ? in Fig. 11a) are
inter-Fig. 11. Diagram showing stratigraphic relationships between the units of lava flows and pyroclastic cones of the An-ei eruption. The tie lines between blocks are stratigraphic relations based on aerial photos. (a) Northeastern side.
Fig. 11. Continued. (b) Southern side.
calated with lava lobes at the drilling site and the entire deposition at the drilling site is thought to have occurred within a short period. The eruption style in Stage 2-1 is thought to be a dominant lava flow associated with cone-building fountaining from the fissures. According to Imura (1998a), the lava reached the NE coast on November 10th. On the basis of the distribution, lobes a and c are thought to have entered the ocean. Therefore, the lava lobes (i.e., lobes d, g, and i) that overlie lobes a and c are considered to have flowed down after November 10th.
The following Stage 2-2 is characterized by lava flows on the middle flank slope (lobes j〜o) (Figs. 10 and 12a). These flows are shorter than those on the lower flank. They traveled less than 1 km and small mounds are there on their surface (Fig. 3a). These features are similar to those of rootless flows in Kilauea Volcano (Wolfe et al., 1988). Since these flows are on the steep slope of the terminal cliff of a thick lava from Kitadake Volcano (Fig. 12a), they are considered to be clastogenic flows derived from cone X due to gravitational instability. As discussed in 4-1-2, the partial collapse of cone X is evident from the existence of D3. The inner welded part of the cone was sufficiently hot and fluidal to flow, suggesting that Stage 2 immediately followed after Stage 1. A small-scale cone-building activity and a collapse also occurred at crater 5.
Some explosions occurred at crater 7 after the emplace-ment of lobe g. Crater 6 also opened in the area of the assumed pyroclastic cone Y (Fig. 10). These craters are reminiscent of the activity of the Vulcanian eruptions that occurred in Stage 2 of the Taisho eruption (Yasui et al., 2007). According to Kobayashi (2009), the explosive eruptions continued on the flank craters until 1785 and it is difficult to tell when the eruptive activity ended.
The existence and shape of lava q reveals that a lava dome has appeared on the bottom of crater 3. The lava p filled D2. Although there is no information on the timing of the extrusion of these lavas (q and p), they might have appeared in the later stage.
Stage 3: Kobayashi (2009) concluded that an intrusion of a submarine cryptodome and subsequent phreatomag-matic eruptions on the northeastern offshore formed the An-ei islets (Kobayashi, 2009). Lava appeared on the sea surface on November 12th. There is no information on the duration of Stage 2. The formation of the cryptodome might have overlapped with onland activity in Stage 2. As re-viewed in section 2-2, Takahashi et al. (2011) showed that
Comparative Study of Proximal Eruptive Events in the Large-scale Eruptions of Sakurajima Volcano:
An-ei Eruption vs. Taisho Eruption 71
Fig. 12. Birdʼs-eye views showing the distribution of the An-ei eruption products. To make these figures, the software “Kashmir 3D” was used. The vertical exaggeration is about two times.
(a) Northeastern side seen from the northeast.
Fig. 12. Continued.
(b) Southern side seen from the southwest. D3 in the An-ei NE is also seen.
the subaqueous drilled lava samples have a different chemical composition from the terrestrial deposits and con-cluded that they were derived from different magma systems. Examining the chemical composition of the magma erupted during Stages 1 and 2, we detected no systematic temporal variation. The SiO2 content of the erupted magma in Stage 1 is between 64. 5 and 66. 5 wt. % as determined from the compositions of the proximal pyro-clasts on the upper flank slope (Fig. 9). The SiO2content of the erupted magma in Stage 2 is between 63.2 and 66.6 wt. % including the compositions of the drilling core samples. Part of the temporal variation in the chemical composition of the erupted magma in Stage 2-1 is indicated by the vertical change in the SiO2content of the drilling core samples throughout the entire depth. From the bottom, the SiO2 content increased sharply from approximately 63.7 to 66.6 wt.% and then decreased to 63. 2 wt.% (Fig. 7f).
4-2 Eruption sequence and eruption style of the An-ei eruption on the southern side
Stratigraphy of the eruption products on the southern side is shown in Fig. 11b. The following eruption sequence is considered on the basis of the stratigraphy and topo-graphic features described in section 3-2.
Stage 1: Plinian eruption started at the uppermost crater (I in Fig. 3b) at approximately 2 pm on November 8thand continued for about 20 hours (Imura, 1998a). Co-plinian fountaining formed a pyroclastic cone, cone A, on the steep slope and syn-eruptive clastogenic lava flowed down to form lava lobes 1 and 2. Cone A deformed downward owing to the steepness of the slope resulting in cracks on its surface. A partial collapse of the edge of cone A possibly generated the upper part of lobe 2. Aramaki and Kobayashi (1986) described the pumice avalanche layers intercalating in the pyroclastic deposits on the An-ei southern side. There is a possibility of triggering such an avalanche from the cone built on a steep slope.
Stage 2: The eruption associated with an eruption cloud ceased in the afternoon on November 9th(Imura, 1998a). Lava lobe 3 was generated from crater II. Then, crater III was active to form cone B. Since the surface of lobe 3 is flat, pyroclastic fall material from crater III is considered to have paved the lava surface. Then, lobe 4 was generated from crater IV. It was followed by the effusion of lava dome 5. A small-scale lobe, lobe 6, might have generated from crater II at the same period. Although the exact timing is unclear, small-scale explosions occurred from the chain of craters V, VI, and VII on the lava field after emplacement of lobes 1, 2, and 3. There is no information on how long the activity on the southern side continued.
4-3 Similarities and differences between the An-ei and Taisho eruptions
With the aim of comparing the past two large-scale eruptions of Sakurajima Volcano, the similarities and
differences between the An-ei and Taisho eruptions will be shown in this section. Features of the two eruptions are summarized in Table 1. There are many similarities, espe-cially in the initial phase (Stage 1). Durations of Stage 1 for the two eruptions are similar, i.e., less than two days. Some old drawings of the An-ei eruption show abundant pyroclasts falling from an ascending Plinian eruption column in the proximal area (photos 2, 3, 5, and 7 in Imura, 1998b). In the case of the Taisho eruption, the intense fallout of pyroclasts from the Plinian eruption column also appears in photographs of the initial Plinian eruption. The pyroclastic cones develop along the eruptive fissures (Fig. 1). Therefore, the co-Plinian, pro-ximal deposition of pyroclastic materials characterizes Stage 1 of these eruptions. There are differences in detailed phenomena in Stage 1 (A〜E in Table 1). For the Taisho W, cone growth, partial cone collapse, and generation of the clastogenic lava occurred simultaneously with the Plinian eruption as reviewed in section 2-1. The cone growth and deformation might have continued after the generation of clastogenic flows in the An-ei S. A small-scale cone collapse occurred in Stage 2-2 in the An-ei NE. Small-scale pyroclastic flows occurred in the Taisho W and the An-ei NE.
The Plinian eruption in Stage 1 was followed by the fissure eruption associated with lava flows on the lower flank in Stage 2-1 in the An-ei NE. The small-scale cone-building eruption at crater 5 in Stage 2-2 is characteristic of the An-ei NE eruption and was not observed in the Taisho eruption. Stage 2 of the Taisho eruption is characterized by the dominance of lava flows, especially on the eastern side. In the same period, Vulcanian explosions from the craters on the fissure occurred repeatedly to generate a heavy ash fall in the Taisho eruption (Yasui et al., 2007). In the An-ei eruption, explosive activities like those in the Taisho eruption are indicated by the existence of craters. According to Kobayashi (2009), explosions have continued for long time until 1799 from the flank craters. He mentioned that it is difficult to determine when the activity ended.
The subsequent courses of the two eruptions were considerably different. That is, an on-land gentle effusion of lava in the Taisho E was the main event in Stage 3 of the Taisho eruption. On the other hand, on-land lava effusion might have ceased in the An-ei eruption. Instead, sub-marine eruptions took place on the northeastern offshore to form the An-ei islets. Takahashi et al. (this issue) concluded that the magma chamber subsystem of the present volcanic activity started with the An-ei subaqueous eruption on the basis of their comparative study of the chemical compositions of historical lava flows of Sakura-jima Volcano.
The magma composition of the Taisho eruption is more mafic than that of the An-ei eruption. The SiO2contents in Stages 1 and 2 are higher than 61 wt.%, whereas that in
Stage 3 is lower than 61 wt.% in the Taisho eruption (Fig. 12 in Yasui et al., 2007). On the other hand, there is no systematic temporal variation in magma composition in the An-ei eruption. Judging from the above results, there may be no relationship between the timing of the change in chemical composition of the erupted magma and the timing of the change in eruption style, at least for these two eruptions.
4-4 Features of the activities on individual eruptive fissures from the two eruptions
We compare the features of the activities on individual eruptive fissures and discuss the factors generating the
variation.
The area of the pyroclastic cone formed in Stage 1 in the An-ei NE is larger than that in the An-ei S (Fig. 1). The deformed pyroclastic cone in the An-ei S is stuck on the steep slope and clastogenic lava flows are distinct. Ac-cording to Imura (1998a), the duration of the Plinian eruption in the An-ei S was shorter than that in the An-ei NE. The shorter duration of the Plinian eruption and the steepness of the slope are considered to have prevented a stable cone building in the An-ei S. In the Taisho W, the syn-Plinian cone collapse and clastogenic flows were dominant in Stage 1. On the other hand, most of the
Comparative Study of Proximal Eruptive Events in the Large-scale Eruptions of Sakurajima Volcano:
An-ei Eruption vs. Taisho Eruption 73
Table 1. Summary and comparison of the An-ei and Taisho eruptions of Sakurajima Volcano.
*1: Vigorous Plinian eruption associated with various phenomena. A: Pumice fall, B: Formation of pyroclastic cone, C:
Collapse of pyroclastic cone, D: Clastogenic lava flow, E: Small-scale pyroclasitc flow*2: According to Kobayashi (2009),
small-scale eruptions from the flank craters continued for long period at least until 1785.*3: See Kobayashi (2009) for
pyroclastic cones were stable in the An-ei NE except in the area on the steep terminal cliff of lava from Kitadake Volcano. This indicates that the intensity and deposition rate of the co-Plinian fountain of the Taisho W were higher than those in the An-ei NE. Therefore, the intensity and duration of the Plinian eruption and the gradient of the slope are thought to be clues to cone growth and the generation of clastogenic lava in these cases.
The craters on the upper slope are larger than the others for both eruptions. In the case of the An-ei S, a semi-circular crater (Crater I) just below the summit remains (Figs. 1 and 12b). Such craters are inferred to be centers of the initial vigorous Plinian eruption. The altitudes of these craters are different between the two eruptions. They are higher than 600 m a.s.l. for the An-ei eruption, but lower than 450 m a.s.l. for the Taisho eruption. This means that the localities where the Plinian eruption started in the An-ei eruption were close to the summit area of Sakurajima Volcano compared with those in the Taisho eruption. In the case of the An-ei NE, the initial Plinian eruption from the upfissure and the following lava-dominated eruption from the downfissure are probably explained by the propagation of a radial dyke from a central conduit system. This is interpreted to mean that the initial pyroclastic explosive eruption on the upper flank became less explosive, corresponding to a downward dyke propagation to generate lava flows on the lower flank. In the Taisho E, a shorter duration of the Plinian eruption resulted in a smaller-scale pyroclastic cone. On the other hand, the effusion of lava in Stage 2 in the Taisho E was large in scale (Figs. 1 and 2c). There may a relationship between the altitude of the initial Plinian eruption and the volume of coherent lava. The altitude of crater of the initial Plinian eruption may be reflected by the volatile content of supplied magma which also controls the ratio of the coherent lava that appears on the downfissure. Relatively large-scale effusion of lava in the Taisho E suggests that degassed magma has supplied to the down-fissure in the Taisho E.
4-5 Implications of the proximal deposition of pyro-clastic materials in the large-scale eruptions of Sakurajima Volcano
It is revealed that there were large-scale proximal depositions of pyroclastic materials due to the co-Plinian fountaining during Stage 1 in the two eruptions of Sakurajima Volcano. We discuss the implication of such proximal depositions in this section.
Concerning the growth of the edifice of Sakurajima Volcano, the following are common to the two eruptions. For both eruptions, there are pyroclastic cones on the upper to middle flanks along eruptive fissures. There was almost no change in the topography in the summit area caused by the large-scale eruption, but the flank slope was extensively plastered and hardened by pyroclastic materials. In other words, proximal deposition in a
large-scale eruption does not contribute to the growth of the summit area, but to that of the flank slopes of Sakurajima Volcano. On the other hand, a pyroclastic cone was formed on the summit through a climactic Plinian stage in the 1783 eruption of Asama Volcano (Yasui and Koyaguchi, 2004). In the case of the 1929 eruption of Hokkaido Komagatake Volcano, it is reported that large amounts of pyroclastic materials fell into the proximal area, burying the pre-existing crater through the Plinian eruption (Katsui
et al., 1975). These cases suggest that the growth of a
volcanic edifice by co-Plinian fountaining is an important aspect of some andesitic eruptions.
In future large-scale eruptions of Sakurajima Volcano, fissures could propagate downward to the cultivated land and inhabited areas immediately after the onset of the eruption. The followings are expected to occur in areas close to eruptive fissures. First, the intense fallout of pyroclastic materials from the Plinian eruption column will occur in Stage 1, setting buildings on fire. Small-scale pyroclastic flows will also occur in this stage. Moreover, clastogenic lava will start to flow downward in Stage 1. This means that lava flows will appear immediately after the onset of the Plinian eruption. Second, repeated lava flows from multiple craters will continue after Stage 1. In the case of the Taisho eruption, the houses in the villages close to the fissure were burnt within several hours from the onset of the eruption and several villages were buried by lava within two days. In order to avoid serious disasters due to the fallout of pyroclastic materials and lava flows, a rapid evacuation is needed, especially for Sakurajima Volcano.
5.Summary
1) The eruption sequence of the An-ei and Taisho eruptions was divided into several stages. For both large-scale eruptions, the eruption styles were similar, at least in the initial stage of up to two days, characterized by a vigorous Plinian eruption with an intense proximal de-position of pyroclastic materials. Consequently, the forma-tion of pyroclastic cones along the eruptive fissures and generation of clastogenic lava flows occurred.
2) After the Plinian eruption, lava continued to flow from multiple craters on eruptive fissures to form vast lava fields for both eruptions. However, these two eruptions took different courses afterwards. Thus, forecasting an eruption sequence in a future eruption will be particularly difficult for a post-Plinian stage.
3) In the case of a large-scale eruption of Sakurajima Volcano, an intense co-Plinian proximal deposition of pyroclastic materials contributes to the considerable growth of the volcanic edifice. It occurs not on the summit area but on the flank slopes along the fissure system.
Acknowledgements
Aramaki for discussions in the field. Drilling core samples were analyzed in 2001 and 2002 by the interuniversity research of Sakurajima Volcano Research Center, Disaster Prevention Research Institute, Kyoto University. Construc-tive comments by the two anonymous reviewers and Dr. Masao Ban are greatly appreciated.
References
Aramaki, S. and Kobayashi, T. (1986) Chemical composition of the volcanic products from Aira caldera and Sakurajima volcano, with special reference to An-ei eruption. In Rep.
5thjoint obs. Sakurajima volcano, 115-129 (in Japanese).
Fukuyama, H. (1978) Geology of Sakurajima Volcano, southern Kyushu. J. Geol. Soc. Japan, 84, 309-316 (in Japanese with English abstract).
Iguchi, M., Tameguri, K. and Yokoo, A. (2008) Volcanic activity of Sakurajima volcano during the period from 1997 to 2007. In Report on 10thjoint obs. of Sakurajima volcano.
1-18 (In Japanese).
Imura, R. (1998a) Reconstruction of the sequence of the An-ei eruption of Sakurajima volcano (A.D.1779-1782) using the historical records. Bull. Volcanol. Soc. Japan, 43, 373-383 (in Japanese with English abstract).
Imura, R. (1998b) Paintings of the An-ei eruption of Sakura-jima volcano (A.D.1779-1782) in the Kagoshima prefec-tural library. Bull. Volcanol. Soc. Japan, 43, 419-421 (in Japanese with English abstract).
Ishihara, T., Takayama, T., Tanaka, Y. and Hirabayashi, J. (1981) Lava flows at Sakurajima volcano (I) -Volume of the historical lava flows- Annuals of Disas. Prev. Res. Inst.,
Kyoto Univ., 24B-1, 1-10 (in Japanese with English abstract).
Japan Coast Guard (1990) Northern part of Kagosima wan, Bathymetric chart, No. 6351, 1: 50,000, No.6351. Katsui, Y., Yokoyama, I., Fujita, T., Ehara, Y. (1975)
Komagatake, its volcanic geology, history of eruption, present state of activity and prevention of disasters. Committee for Prevention of the Natural Disaster of Hokkaido, Sapporo. 194 pp. (in Japanese).
Kobayashi, T. (1982) Geology of Sakurajima volcano: A review. Bull. Volcanol. Soc. Japan, 27, 277-292(in Japanese with English abstract).
Kobayashi, T. (1986) Volcanic history and pyroclastic flows of Sakurajima volcano. In Characteristics of dry high
concentration flows (pyroclastic flows) associated with volcanic eruption and their disasters (Aramaki, S. ed.),
137-163, Univ. Tokyo, Tokyo.
Kobayashi, T. (2009) Origin of new islets (An-ei islets) formed during the An-ei eruption (1779-1782) of Sakura-jima volcano, southern Kyushu, Japan. Bull. Volcanol. Soc.
Japan, 54, 1-13 (in Japanese with English abstract).
Kobayashi, T., Ishihara, K., Hirabarashi, J. and Ohsumi Work Office of Ministry of Construction (1988) Scientific guide for Sakurajima volcano. In: Kagoshima international
con-ference on volcanoes (A guide book for Sakurajima Vol-cano and Geological map of Sakurajima VolVol-cano. 1: 50,000), 1-73.
Koto, B. (1916) The great eruption of Sakura-jima in 1914. J.
Coll. Sci., Imp. Univ. Tokyo, 38, Art 3, 1-237.
Miki, D., Uto, K., Sudo, M. and Ishihara, K. (2003) Correlation of lavas on drilled cores from the Sakurajima volcano, inferred from paleomagnetic and chemical features.
Annuals of Disas. Prev. Res. Inst. Kyoto Univ., 46 B,
835-840 (in Japanese).
Omori, F.(1914, 1916a, b, 1920 a, b, 1922) The Sakura-jima eruptions and earthquakes I, II, III, IV, V and VI. Bull.
Earthq.Invest.Commun., 8, 1-34, 35-179, 181-321,
323-351, 353-466 and 467-525.
Shimano, T. and Koyaguchi, T. (2001) Eruption styles and degassing process of ascending magma of the 1813 eruption of Suwanose-jima volcano, southwest Japan. Bull. Volcanol.
Soc. Japan, 46, 53-70 (in Japanese with English abstract).
Sumner, J. M. (1998) Formation of clastogenic lava flows during fissure eruption and scoria cone collapse: the 1986 eruption of Izu-Oshima volcano, eastern Japan. Bull.
Vol-canol., 60, 195-212.
Takahashi, M., Otsuka, T., Kawamata, H., Sako, H., Yasui, M., Kanamaru, T., Otsuki, M., Shimada, J., Atsuchi, T., Umezawa, T., Shiroishi, T., Ichiki, Y., Satake, S., Kobayashi, T., Ishihara, K. and Miki, D. (2011) Whole-rock chemistry for eruptive products of the Sakurajima volcano and Aira caldera, southern Kyushu: summary of 583 analytical data.
Proceedings Inst. Natur. Sci. Nihon Univ., 46, 133-200 (in
Japanese with English abstract).
Takahashi, M., Otsuka, T., Sako, H., Kawamata, H., Yasui, M., Kanamaru, T., Otsuki, M., Kobayashi, T., Ishihara, K. and Miki, D. (2013) Temporal variation for magmatic chemistry of the Sakurajima Volcano and Aira caldera region, southern Kyushu, southwest Japan since 61 ka and its implications for the evolution of magma chamber system. Submitted to the special issue of Sakurajima Volcano, Bull. Volcanol. Soc. Japan, 58, 19-42. Wolfe, E. W., Neal, C. A., Banks, N. G. and Duggan, T. J.
(1988) Geologic observations and chronology of eruptive events. In The Pu`u`O`o eruption of Kilauea volcano,
Hawaii: Episodes 1 through 20, January 3, 1983, through June 8, 1984. (Wolfe, E.W. ed.), U.S. Geological Survey Professional Paper, 1463, 1-97.
Yamaguchi, K. (1967) On the pumiceous lava flow from Sakura-jima volcano. Rep. Rissho Women’s college, 1, 6-24 (in Japanese).
Yamaguchi, K. (1975) Study of Sakurajima volcano -Geological and petrological studies of regions around Kagoshima Bay and Sakurajima volcano. Jap. Earth Sci.
Educ. Soc. Tokyo, 128p (in Japanese).
Yasui, M. (2012) Degrees of fragmentation of crystals contained in andesitic pumice fall deposits and lava flows: case study of the eruptive products of Asama volcano and Sakurajima volcano. Bull. Volcanol. Soc. Japan, 57, 145-158 (in Japanese with English abstract).
Yasui, M. and Suganuma, Y. (2003) Broken texture of free crystals contained in pumice fall deposits. Bull. Volcanol.
Soc. Japan, 48, 221-227 (in Japanese with English abstract).
Yasui, M. and Koyaguchi, T. (2004) Sequence and eruptive style of the 1783 eruption of Asama volcano, central Japan: Comparative Study of Proximal Eruptive Events in the Large-scale Eruptions of Sakurajima Volcano:
A case study of an andesitic explosive eruption generating fountain-fed lava flow, pumice fall, scoria flow and forming a cone. Bull. Volcanol., 66, 243-262.
Yasui, M., Takahashi, M., Ishihara, K. and Miki, D. (2006) Records on the 1914-1915 eruption of Sakurajima volcano, Japan. Proc. Inst. Natural Sci, Nihon University, 41, 75-107 (in Japanese with English abstract).
Yasui, M., Takahashi, M., Ishihara, K. and Miki, D. (2007) Eruptive style and its temporal variation through the 1914-1915 eruption of Sakurajima volcano, southern Kyushu, Japan. Bull. Volcanol. Soc. Japan, 52, 161-186 (in Japanese with English abstract).
(Editorial handling Masao Ban)