Hydrologic modeling of the Gin River basin, Sri Lanka
in assessing the environmental effects due to catchment change
(スリランカ Gin 川の流域改変に伴う
環境影響評価のための水文モデリング)
山梨大学大学院
医学工学総合教育部
論文博士学位論文
2014 年 3 月
HYDROLOGIC MODELING OF THE
GIN RIVER BASIN, SRI LANKA
IN ASSESSING THE ENVIRONMENTAL
EFFECTS DUE TO CATCHMENT CHANGE
March 2014
Hydrologic modeling of the
Gin River basin, Sri Lanka in assessing the
environmental effects due to catchment change
A dissertation submitted in partial fulfillment of the requirements for the degree of Doctor of Philosophy in Engineering
Interdisciplinary Graduate School of Medicine and Engineering
University of Yamanashi
March 2014
i
ABSTRACT
Land use composition variation as well climate change has shown to bring variety of impacts on the river systems. Increased sediment and nutrient loading in rivers adversely affect the river water quality, however due to increasing population and industrialization, there exist an increasing demand for higher quality water.
Although there have been many assessments of the effects of climate change on river flows, impact assessments of land use change on flow regimes have been given lesser attention, and there have been only few published quantitative studies into combined climate change and land use impacts on water resource systems. Water quality and river flows are correlated and this correlation varies spatially as well as temporally. However, it is at present rather uncertain how these climate and land use changes are likely to affect the generation of river flow regime, and consequently the river water quality. Therefore, it is important to understand how the flow regime changes at catchment scale and regional scale will affect the river water quality subsequent to the combined effects of climate and land use change.
Gin catchment, situated in the Southern region of Sri Lanka, was chosen as the study area. The catchment encompasses about 932 km2 with a total population of about
600,000. Gin River’s water is extensively used for drinking water production, and in addition people living adjacent to the river use river water for their daily water consumptions. Significant changes in the catchment land use have been observed during past few decades and there have been indications of variations in runoff regime across the country resulted by the change in climate. Therefore, in the context of drinking water production, it is important to understand whether such changes would affect the quality of the water in Gin River.
The aim of this study was to ascertain the effects on future river water quality subsequent to the flow regime alterations caused by the anticipated climate and land use change in the Gin catchment. Specific research aspects addressed by the study included: generation of future climate (rainfall) and land use projections for Gin catchment; identification of the changes in future river flow regime; establishment of relationship between the river flow and constituent concentration at Baddegama (6°11'23" N, 80°11'53" E); assessment of constituent amounts present in the future river flow and comparison with the water quality standards. Constituents considered in this study included chloride, total alkalinity, total residue, total hardness, calcium, total iron, Total Suspended Solid (TSS) and turbidity. In addition, the study defined the relation between turbidity and TSS concentration in Gin River flow at Baddegama,
ii
based on measurements. Sri Lanka’s strategy for sustainable water supply development has given special emphasis on development and preservation of water resources in achieving 100% safe drinking water supply by year 2020. In supporting to achieve the set target by year 2020, this study assessed implications on future drinking water production due to varying water quality status at the catchment scale, giving special emphasis to Gin River.
Future climate change (year 2020 rainfall) was estimated from the PRECIS run using HadRM3P, 25 km x 25 km resolution Regional Climate Modeling (RCM) system developed by the UK Met Office Hadley Centre. Rainfall projection for year 2020 was conditioned by the Intergovernmental Panel on Climate Change (IPCC) Special Report on Emission Scenario (SRES) A2 and A1B groups. The two experiments were run by the UK Met Office Hadley Centre using ECHAM4: SRES A2 data, and HadCM3Q0: SRES A1B data. This study used a scaling method that considered daily patterns of rainfall change simulated by the RCM. The patterns of change of rainfall at the RCM scale were applied to the historical catchment rainfall to produce year 2020 rainfall.
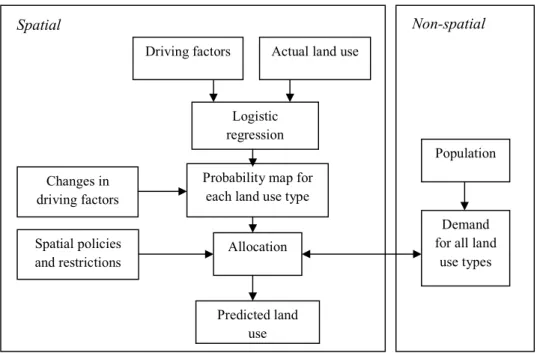
The study employed a spatially explicit land use change analysis across the Gin catchment in order to project year 2020 land use using a logistic regression approach based on Geographic Information System. In this study, probability of occurrence of a certain land use type was influenced by socioeconomic, proximity and biophysical driving factors. Allocation of land use change was made in an iterative procedure given the probability maps, spatial policies and restrictions in combination with the observed land use map in 1983, and future demand for the different land use types. Observed land use map in 1999 was used in validating the predictions. Validation of predicted land use change showed reasonable agreement between the observed and predicted land use in 1999. Moreover the spatial dynamic of land use change patterns was realistic. Validation of logistic regression analysis was tested using the Relative Operating Characteristic (ROC) analysis. The spatial distribution of all land use types were well explained by the selected driving factors as indicated by the comparatively high ROC test statistics.
University of Yamanashi Distributed Hydrological Model (YHyM) with block wise use of TOPMODEL and Muskingum Cunge method (BTOPMC) was applied in quantifying the impacts of climate and land use change on hydrology. Daily streamflow data from 1997 to 2001 and from 2002 to 2006 were used for calibrating and validating the model, respectively. Model performance was evaluated by the Nash-Sutcliffe efficiency and the volume ratio of total simulated discharge to total observed discharge. Nash-Sutcliffe efficiency values ranging between 48% and 66% indicated acceptable level of model performance. Measured and YHyM/BTOPMC simulated streamflow showed a good agreement and overall, the model was able to adequately simulate the major hydrological characteristics in Gin catchment including runoff
iii
volume, evapotranspiration and soil moisture states of the catchment. By driving the calibrated and validated YHyM/BTOPMC with RCM generated rainfall and projected land use, year 2020 daily streamflow was generated. Finally, year 2020 constituent loads were estimated by coupling the daily streamflow output by YHyM/BTOPMC with the LOADEST.
LOADEST, a load-discharge rating curve for estimating constituent loads in rivers was used in this study to develop regression models and estimate constituent loads. For each constituent, concentration observations during 2001-2009 were used in conjunction with corresponding observed streamflow data at Baddegama (6°11'23" N, 80°11'53" E) to develop and calibrate the regression model using Adjusted Maximum Likelihood Estimation (AMLE) method. The AMLE method was used after checking that regression residuals were normally distributed. The regression models developed for all constituents showed higher coefficients of determination values (ranging between 0.75-0.97) reflecting strong relationship between the estimated and measured constituent loads.
Gin catchment’s land use change can be summarized over the past thirty years as a result of change in agricultural practices and increase in population. The most obvious land use change observed was the decline of cultivated areas. From 1983 to 2020, drop from 51% to 34% was observed. Area covered by the homestead/garden is expected to rise from 18% in 1983 to 32% in 2020. This principally reflects the rapid expansion of homestead/garden to keep pace with population growth.
Analysis of HadRM3P RCM based climate scenarios for the Gin catchment indicated that total annual rainfall will decrease in the year 2020 by about 8% and 40% across the basin, compared to the baseline period 2001-2004, under the SRES A2 and SRES A1B scenarios, respectively. More pronounced rainfall events are projected to occur under the SRES A2. As expected, these changes would lead to significant changes in the hydrology of the Gin catchment. Pattern of change in streamflow has been largely determined by the changes in simulated rainfall.
Combined effects of climate change and land use change showed a trend of increasing (4%) and decreasing (50%) annual flows for the SRES A2 and SRES A1B, respectively during year 2020 with a projected shift in the monthly distribution of flows. In June and November, monthly streamflows were projected to increase under the both scenarios while in March, both scenarios resulted a decreased runoff compared to the baseline period. Under the SRES A2, remarkable increase of peak flow events has been noted. Analysis of hydrological budget components showed that the predicted reduction in rainfall results in a decrease of groundwater recharge in the basin; 12 % and 43% decrease for SRES A2 and SRES A1B, respectively. 25% decrease of year 2020 evapotranspiration was simulated for both scenarios compared to the baseline period.
iv
In responding to the alterations in timing and magnitude of flows, increase in constituent levels during June and November in year 2020 has been noted compared to the same months in the baseline period. Compared to other constituents, particularly total iron concentrations and turbidity levels have shown remarkable increase under the SRES A2 and shown to significantly exceed the water quality standards. 75th
percentile total iron load and turbidity value are expected to increase by 347% and 107%, respectively in June under the SRES A2. Analysis showed that, increases in streamflow by 90% will result in elevating the total iron load by 200%. Study revealed that, it will be challenging to deal with the total iron concentrations and turbidity levels projected to occur during the highest flows (>110 m3/s) in year 2020, requiring 92%
and 95% remarkable reductions to comply with the water quality standards, respectively.
The response of future water quality to river flow regime alterations heavily depends on the type of climate emission scenario being evaluated. It is also important to realize that the climate change projections and the modeling processes incorporated in the study are associated with uncertainties. Thus the findings of the study should be interpreted, taking into account the uncertainties addressed above, as indicative trends of future changes in the river water quality.
Findings of the study underscore the need to deserve necessary pro-active planning strategies for compensation of the negative effects anticipated in future river water quality. Moreover, the basic framework suggested in this study provides necessary guidance for similar assessments in other catchments.
v
ACKNOWLEDGEMENTS
This dissertation would not have been possible without the valuable guidance and the assistance extended by several individuals. Starting from the conception of this work, I am deeply indebted to Prof. A.W. Jayawardena (Honorary Professor, The University of Hong Kong) for recommending me to the Doctoral course of University of Yamanashi. His continues encouragement and constructive criticism lead this study to a success.
The debt that I owe to my main supervisor, Assoc. Prof. Hiroshi Ishidaira may not be easily described. His professional guidance, tireless dedication, understanding and patience always motivated me to think deeper and to be more productive in my research. I am very grateful and fortunate to have him as my supervisor. I also owe a sincere gratitude to Dr. T.M.N. Wijayaratna for his willingness to co-supervise my research and his invaluable guidance and comments throughout this study. My utmost gratitude is due to Asst. Prof. Jun Magome for his advice and valuable suggestions. This study would not have been possible without his invaluable assistance.
I am indebted to the members in my advisory committee: Prof. Yasushi Sakamoto, Prof. Tadashi Suetsugi, Prof. Futaba Kazama, Assoc. Prof. Yutaka Ichikawa, and Assoc. Prof. Kei Nishida for spending their valuable time on evaluating my thesis, and providing me with valuable comments and suggestions to improve my work. Also I would like to forward heartfelt thanks to all the professors of GCOE program and all the members of senior seminar for their valuable comments and inputs to my research. I would like to express my gratitude and appreciation to the staff at University of Yamanashi: particularly Ms S. Maruyama, Ms. M. Ishihara, Ms. W. Sano and Ms. M. Katou for their administrative support and caring.
My most profound gratitude is extended to the Japan Society for the Promotion of Science (JSPS) which made this research possible through financing. I owe special thanks to all those organizations that have provided the necessary data for this research, particularly the Met Office Hadley Centre, United Kingdom (Ms Grace Redmond) and National Water Supply and Drainage Board, Sri Lanka.
I very much enjoyed the friendly atmosphere in our lab and in University of Yamanashi. Thank you: Dr. J. Wang, Dr. K. Temur, Dr. M. Sujata, Dr. K. Kakizawa Mr. A. Deeptha, Ms. H. Bui, Mr. P. Udmale, Mr. S. Ning, Mr. N. Vuong, Ms. Y. Nhu and all other colleagues.
vi
Assistance extended by my employer, the Department of Civil and Environmental Engineering, University of Ruhuna, Sri Lanka, by granting me with necessary approvals and leave to carry out this research, is gratefully acknowledged.
Finally, I would like to thank my husband and my parents. Their understanding and constant inspiration kept me focused and motivated. It is to them I would like to dedicate this thesis.
vii
TABLE OF CONTENTS
Abstract ... i
Acknowledgements... v
Table of Contents ... vii
List of Figures ... xi
List of Tables ... xiii
List of Abbreviations ... xiv
CHAPTER I Introduction 1.1. General………1
1.2. Statement of the problem and research gap………..………...2
1.3. Research objectives………3
1.4. Organization of the dissertation………..………3
CHAPTER II Literature review 2.1 Effects of climate change and land use change on hydrological regimes………..…5
2.1.1 Climate change scenarios………..………..5
2.1.2 Climate change in humid tropical regions and South Asia……….6
2.1.3 Climate change studies in Sri Lanka……….………..7
2.1.4 Climate change and potential effects on runoff and water quality…...…10
2.1.5 Effects of catchment land use change on hydrologic responses………...12
2.2 Relationship between flow and water quality………..……13
2.3 Background to the present study………..………14
CHAPTER III Study area and methodology 3.1. Description of the study area………..17
3.2. Hydrological process modeling………..19
viii
3.2.2. Data sets and model set up………...……...….…………21
3.3. Land use change projection ………...……….25
3.3.1. Land use demand……….……….………26
3.3.2. Spatial policies and restrictions………27
3.3.3. Location characteristics (Driving factors of location)…….………27
3.3.4. Logistic regression analysis……….………28
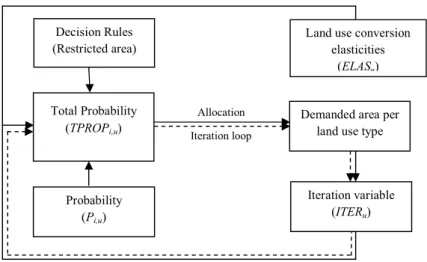
3.3.5. Allocation of land use change……….……….………29
3.4. Estimation of precipitation change under climate change………..……..………..30
3.4.1. PRECIS regional climate modeling system and emission scenarios...…30
3.4.2. Daily scaling method……….……..31
3.5. Estimation of constituents………..….33
3.5.1. Constituent concentration data and streamflow data………...……33
3.5.2. Turbidity and TSS measurements………...……….33
3.5.3. Turbidity and TSS correlation……….……….33
3.5.4. Constituent load-discharge model development……….………….35
CHAPTER IV Hydrological characteristics, land use dynamics and water quality status of Gin catchment 4.1. Simulation of major hydrological characteristics……….…..39
4.1.1. Model calibration and validation……….…39
4.1.2. Model performance……….……….40
4.1.3. Simulation of major hydrological characteristics………41
4.2. Spatially explicit land use change analysis……….42
4.2.1. Observed and predicted land use……….…42
4.3. Evaluation of water quality status……….…..44
4.3.1. Estimation of constituent loads………44
4.3.2. Temporal variations and annual trends in constituent loads…..…..……47
4.3.3. Flow weighted concentrations of the constituents……….……..48
4.3.4. Constituent comparison with the water quality standards…………...…49
4.3.5. Turbidity characteristics in Gin River flow……..………...…50
ix
CHAPTER VCatchment change induced flow regime variations
5.1. Change in catchment land use……….………53
5.1.1. Land use dynamics during 1983-2020……….…………53
5.1.2. Reliability of the projection - year 2020 land use...54
5.2. Change in climate (rainfall)..………..………55
5.2.1. Year 2020 catchment rainfall: changes in the rainfall amounts and rainfall pattern……….………55
5.3. Integrated impact of climate change and land use change on the river flow regime ……….………57
5.3.1. Modeling hydrological processes in the changed catchment-year 2020..57
5.3.2. Quantitative and temporal changes in the river flow regime……...59
5.3.3. Water balance analysis………...……..60
5.4. Summary……….62
CHAPTER VI Environmental effects resulted by the flow regime alterations 6.1. Flow regime induced changes in water quality………...……63
6.1.1. Fluctuation of constituents under changing flow regimes…...…………63
6.1.2. Total iron loads and turbidity characteristics in future river flow…...…64
6.2. Total iron and turbidity comparison with the water quality standards……….…..65
6.2.1. Comparison with Sri Lanka standards for potable water and proposed ambient water quality standards for inland waters of Sri Lanka……...65
6.2.2. Necessary reduction of constituents to comply with the water quality standards……….……….…66
6.3. Potential impacts on drinking water production……….67
6. 4. Summary………68
CHAPTER VII Conclusions and recommendations 7.1 Conclusions………..………69
7.2 Contributions………70
x
References………..…73
Appendix A……….…….87
xi
LIST OF FIGURES
Figure 2.1. SRES storylines and scenario families.…….………...……6
Figure 2.2. Annual average rainfall trends in Sri Lanka (1961-2000)………8
Figure 2.3. Precipitation anomaly in the (a) GCM and (b) RCM………...…8
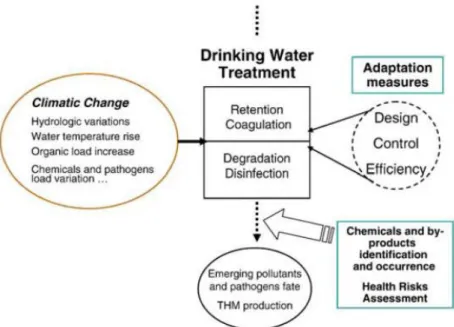
Figure 2.4. Climate change impacts and drinking water treatment issues………11
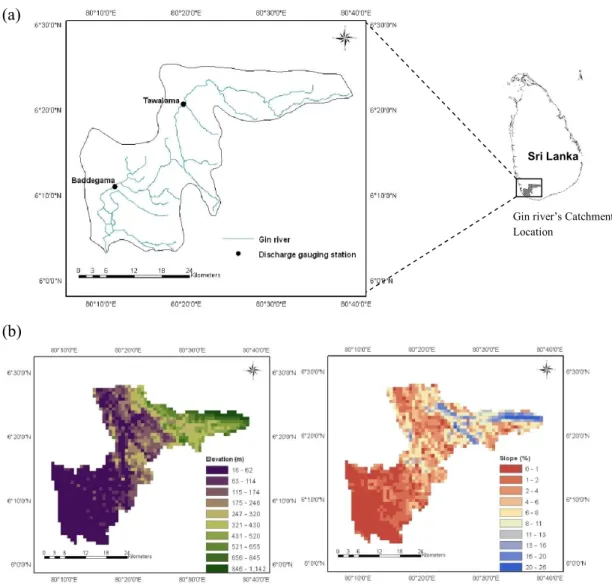
Figure 3.1. (a) Location - Gin River and its catchment, (b) Elevation and slope - Gin catchment...18
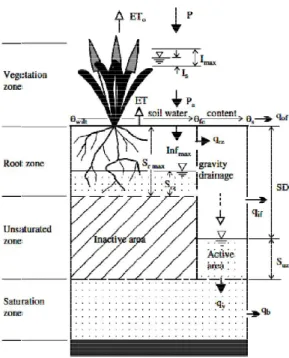
Figure 3.2. Runoff generation in a grid cell in the BTOP model………..……19
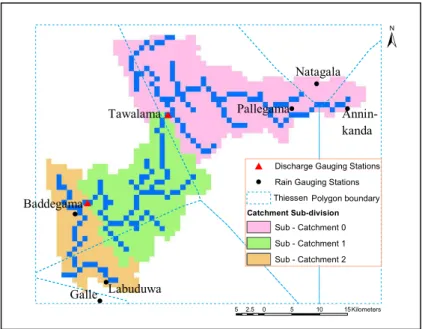
Figure 3.3. Locations of discharge and rain gauging stations, catchment sub divisions, stream network and Thiessen polygons generated by YHyM/BTOPMC………….….22
Figure 3.4. Soil map……….……….23
Figure 3.5. Land use map (1999)……….……….23
Figure 3.6. The schematic representation of land use change prediction...26
Figure 3.7. Representation of the iterative procedure for land use change allocation..30
Figure 3.8. Eleven grids (25 km x 25 km) that cover the Gin catchment…….………31
Figure 3.9. Illustration of the daily scaling method used in this study for SRES A2 rainfall at Baddegama station……….32
Figure 3.10. Linear regression of turbidity and TSS concentration including 95% prediction intervals……….34
Figure 3.11. Flow duration curve and concurrent water quality samples ……..……..37
Figure 3.12. (a) Constituent concentration vs. streamflow, (b) Total iron concentration vs. streamflow, (c) Turbidity vs. streamflow at Baddegama during 2001-2009…..….37
Figure 4.1. Model validation results at Baddegama discharge gauging station during 2002-2006………..………41
Figure 4.2. (a) 1983 observed land use, (b) 1999 observed land use, (c) 1999 predicted land use………..………43
xii
Figure 4.3. Relationship between measured instantaneous loads and estimated loads (a) Chloride, (b) Total alkalinity, (c) Total residue, (d) Total hardness, (e) Calcium, (f) Total iron………...………45 Figure 4.4. Streamflow, measured instantaneous loads and estimated loads of total residue………...………….46 Figure 4.5. Mean monthly load estimates and mean monthly streamflow of Gin River at Baddegama during 2001-2009………..…….47 Figure 4.6. FWC during 2001-2009 (a) Chloride, (b) Total alkalinity, (c) Total residue, (d) Total hardness, (e) Calcium, (f) Total iron………..…….48 Figure 4.7. Total iron concentration vs. streamflow exceedance probability…..…….50 Figure 5.1. Year 2020 projected land use……….54 Figure 5.2. Long term trends in daily rainfall at five stations covering Gin catchment during 1980-2009………...………55 Figure 5.3. Monthly rainfall………..56 Figure 5.4. Rainfall vs. percentage of time rainfall was equaled or exceeded…..……56
Figure 5.5. Year 2020 streamflow hydrographs………58 Figure 5.6. Flow duration curves: year 2020 and 2001-2004………..…….58 Figure 5.7. 90th percentile of monthly streamflows………..…59
Figure 5.8. Comparison of hydrological components (year 2020 and 2001-2004)…..60 Figure 5.9. Evapotranspiration change resulting from climate and land use change…61
Figure 6.1. Year 2020 (a) Total iron concentration, (b) Turbidity level…………...…64 Figure 6.2. Monthly constituent amounts (Year 2020 and 2001-2004) (a) Total iron load, (b) Turbidity level……….………64 Figure 6.3. Constituent concentration vs. streamflow exceedance probability (a) Total iron, (b) Turbidity………..………66 Figure 6.4. 90th percentile of year 2020 constituent amounts and percentage reductions
xiii
LIST OF TABLES
Table 3.1. Basic data input to run YHyM/BTOPMC and the sources of data….….…21
Table 3.2. Soil properties and distribution of soil textures……….……..23
Table 3.3. Distribution of different land use types according to re-classified IGBP classes and root depths………..……….………24
Table 3.4. Land use change driving factors………...………28
Table 3.5. Summary of the logistic regression analysis - regression coefficients and the ROC statistics...29
Table 3.6. Regression models developed for each constituent (2001-2009) using LOADEST and their coefficients of determination (R2)………36
Table 4.1. YHyM/BTOPMC calibrated parameter set………..39
Table 4.2. Model performance………..40
Table 4.3. Correlation matrix of validation……….………..43
Table 4.4. Mean measured loads and mean estimated loads during 2001-2009…...…44
Table 4.5. Annual trends in estimated constituent loads during 2001-2009…….……47
Table 4.6. Frequency distribution of the constituent concentrations during 2001 -2009 ………….………....49
xiv
LIST OF ABBREVIATIONS
AMLE Adjusted Maximum Likelihood Estimation CEA Central Environmental Authority
GCM General Circulation Model GHG Greenhouse Gas
GIS Geographic Information System
IGBP International Geo-sphere Biosphere Programme IPCC Intergovernmental Panel on Climate Change
IPCC AR Intergovernmental Panel on Climate Change Assessment Report MCM Million Cubic Meters
MLE Maximum Likelihood Estimation NTU Nephelometric Turbidity Unit RCM Regional Climate Model
SRES Special Report on Emission Scenario TSS Total Suspended Solid
USDA United States Department of Agriculture
1
CHAPTER I
INTRODUCTION
1.1. General
Land use dynamics and climate change have significant impacts on watershed hydrology and increasingly threatening water resources worldwide. IPCC technical paper on climate change and water (Bates et al., 2008) concludes that there is abundant evidence from observational records and climate projections that freshwater resources are vulnerable and have the potential to be strongly impacted by climate change. By the 2050s, freshwater availability in Central, South, East and Southeast Asia, particularly in large river basins, is projected to decrease (IPCC AR4, 2007a). According to IPCC AR4 (2007b), many non-climatic drivers including land use change affect freshwater resources both in quantity and quality.
In launching appropriate actions to minimize the plausible impacts on water resources, assessing the hydrological impact of land use and climate change has become an important research topic. Many studies explored the potential impacts of future climate changes on water resources (Hamlet and Lettenmaier, 1999; Christensen et al., 2004; Hay and McCabe, 2010; Kerkhoven and Gan, 2013). Also an adequate amount of research has been conducted on consequences of land use changes on hydrology (Fohrer et al., 2001; Ott and Uhlenbrook, 2004; Wijesekara et al., 2012; Öztürk et al., 2013). In few studies, integrated climate change and land use change effects on the future flow regime configurations were assessed (Ma et al., 2009; Price, 2011; Alaoui et al., 2013; Betts et al., 2013). However, responses of water quality to future flow regime variations subsequent to the combined effects of climate and land use change so far remain partly understood, especially at the small scale basin level.
In the Sri Lankan context, the major intentional pressures on water resources are agriculture, urbanization and industrialization which govern the change of land use patterns. Excessive use of agrochemicals and chemical fertilizers, release of industrial effluents, domestic waste and sewage, and dumping of solid waste into waterways cause unintentional pressures. These pressures collectively interact resulting in complex impacts on water resources (UNEP, 2001). In 2050s, the annual runoff across the country is predicted to decrease by 10% and 8% for SRES A2 and SRES B2 scenarios, respectively (De Silva, 2010). Due to the anticipated climate change and
2
current development activities in the Southern region of Sri Lanka owing to substantial land use change, it is believed to be induced some impacts on the quantity and quality of water. Gin River is the most important drinking water source to cover the water supply requirement in the Galle district and it is the primary drinking water source, from which pipe-borne water is supplied to Galle city, the capital of Southern Sri Lanka. Moreover, people living adjacent to the Gin River use river water for their daily water consumptions. Hence there exists a vital need to identify any changes in water quality conditions of Gin River likely to occur in future, subsequent to various anthropogenic activities and natural processes.
1.2. Statement of the problem and research gap
Though the climate change has become an inherent global issue, the impacts will be equally felt by the small islands like Sri Lanka. As Sri Lanka develops, pressures on natural resources including land and water will intensify in future due to the limited resources and growing competition. In the context of climate change, annual runoff across the country is predicted to decrease (De Silva, 2010). Moreover substantial change in land use has already been noted (Wickramaarachchi et al., 2013 b) and such changes are expected subsequent to the several infrastructure development projects currently being implemented in Southern region of the country and supposed to initiate in near future, as per the national development plan of the country. Thus integrated effects of land use change and climate change believe to be induced some impacts on the quantity and quality of water resources in the region.
Galle city is the capital city in Southern region of Sri Lanka and it is one of the densely populated cities in the country. Main source of water supply to Galle district is from the Gin River and Galle city’s pipe-borne water supply system totally depends on the water resources in the Gin River basin. Therefore Gin River is considered to be the most important water body in Galle district in the context of water services. The present safe drinking water supply coverage in Sri Lanka is 81%. According to country’s policy frame work, targets have been set to achieve 94% safe drinking water supply by year 2015 and 100% by year 2020 (NWS&DB, 2011). Water resources, their development and preservation have been included in the process of achieving the set targets. In line with achieving the set targets by year 2020, it is vital to comprehend the availability of water resources in future, in terms of adequate quantity and satisfactory quality. Nevertheless, no significant attempts have been made yet to understand either the prevailing or anticipated hydro environmental conditions in the Gin River basin. There have been few efforts to identify effects of climate change on water resources, particularly related to runoff and ground water in Sri Lanka. Indeed, there is no any previous impact analysis studies addressing the integrated effects of land use and climate change on hydrological regime and water quality, in particular at the basin level or generally in Sri Lanka. This study which successfully coupled the outputs from
3
regional climate model (HadRM3P) and land use change allocation process with a distributed hydrological model (YHyM/BTOPMC), allowed simulating future runoff in the Gin River which subsequently linked to load discharge rating curve (LOADEST) in estimating future constituent loads in the Gin River. Hence the findings of this study will assist in filling the existing lacuna.
Moreover, the basic framework adopted in this study which is novel and applicable in the local context could be effectively applied in carrying out impact studies in other catchments in the country and in humid tropical regions around the world. The integrated approach presented in this study could be useful practical tool in water resources planning which would help to analyze, evaluate and predict the possible impacts of climate and land use change on water resources.
1.3. Research objectives
The overall objective of this study is to provide an in-depth insight into the impacts on river water quality due to the changes in river flow regime caused by the combined effects of land use change and climate (rainfall) change in the Gin catchment.
The specific objectives of the study are as follows:
1) To generate future climate (rainfall) and land use projections in the Gin catchment
2) To assess the catchment change induced river flow regime variations
3) To evaluate the impacts on river water quality due to the changes in river flow regime
1.4. Organization of the dissertation
The dissertation is organized in seven chapters. Brief outline of the content of each chapter is presented below:
Chapter I: Introduction
Introduces the impacts on river flow regime caused by the land use change and climate change, and highlights the importance of linking them with the river water quality. It further details the statement of the problem and research gap. Moreover the objectives of the study and the structure of the thesis are presented.
4 Chapter II: Literature review
Summarizes the methodologies and key findings adopted in previous studies on climate change, land use change and their impacts on water resources. Climate and water resources related studies carried out in Sri Lanka are also being discussed. Chapter III: Study area and methodology
A description of the study area is presented including the climate and hydrology. Methodology adopted for the overall study is explained including detailed methodologies develop for each assessment. Data used in the study and their sources are also stated.
Chapter IV: Hydrological characteristics, land use dynamics and water quality status of Gin catchment
Existing hydro environmental conditions in the catchment is analyzed in this chapter giving special emphasis to evaluation of water quality status in Gin River. Chapter V: Catchment change induced flow regime variations
This chapter focuses on changes in catchment land use and climate (rainfall), and evaluates the integrated impacts of climate change and land use change on future river flow regime. Specifically assesses the alterations in key hydrological characteristics of the catchment through water balance analysis.
Chapter VI: Environmental effects resulted by the flow regime alterations
Based on the flow regime variation revealed in Chapter V, this chapter estimates constituent amounts in the future river flow and compares with the water quality standards. It further evaluates necessary reduction of constituents to comply with the water quality standards and provides future implications on drinking water production.
Chapter VII: Conclusions and recommendations
This chapter summarizes the results providing conclusions, contributions of the research, and recommendations for future research developments.
5
CHAPTER II
LITERATURE REVIEW
2.1 Effects of climate change and land use change on hydrological
regimes
2.1.1 Climate change scenarios
The SRES scenarios developed by the IPCC have been constructed to explore future developments in the global environment with special reference to the production of GHG and aerosol precursor emissions. Future GHG emissions are the product of very complex dynamic systems, determined by driving forces such as demographic development, socio economic development, and technological change. Scenarios are alternative images of how the future might unfold and their future evolution is highly uncertain. These scenarios have been widely used in climate change analysis, including climate modeling and the assessment of impacts, adaptation, and mitigation. ‘Storyline’ which is the starting point for each projection of future emissions describe the way world population, economics and political structure may evolve over the next few decades. The storylines were grouped into the four scenario families in establishing the six SRES marker scenarios (Figure 2.1). Of the six available scenarios, present study examined two scenarios: SRES A2 and SRES A1B. SRES A2 scenario describes a very heterogeneous world. The underlying theme is self reliance and preservation of local identities. Fertility patterns across regions converge very slowly, which results in continuously increasing global population. Economic development is primarily regionally oriented and per capita economic growth and technological changes are more fragmented and slower than in other storylines. SRES A1 scenario describes a future world of very rapid economic growth, global population that peaks in mid century and declines thereafter, and the rapid introduction of new and more efficient technologies. SRES A1 scenario family develops into three groups that describe alternative directions of technological change in the energy system: fossil intensive (A1FI), non-fossil energy sources (A1T), or a balance across all sources (A1B) (IPCC, 2000).
6
Figure 2.1. SRES storylines and scenario families (IPCC, 2000)
HS - share harmonized assumptions on global population, gross world product, and final energy OS - denotes scenarios that explore uncertainties in driving forces beyond those of the harmonized scenarios
Though this study included future rainfall projections for both SRES A2 and SRES A1B scenarios, in most of the climate adaptation studies carried out, it has been identified that the most matching scenario for Sri Lankan conditions is SRES A2. This is further explained by De Silva et al. (2007).
2.1.2 Climate change in humid tropical regions and South Asia
Runoff regimes in humid tropical regions are very much influenced by the timing and duration of the rainy seasons including monsoons. Thus climate change in such regions may affect river flows not only through a change in the magnitude of rainfall but also through possible changes in the onset or duration of rainy seasons (Arnell et al., 2001).
Huge population, natural resource degradation with continuing high rates of poverty and food insecurity make South Asia one of the most vulnerable regions to the impact of climate change. Land use, land degradation, urbanization and pollution, affect the ecosystems in this region directly and indirectly through their effects on
7
climate (Sivakumar and Stefanski, 2011). Hence improved understanding of the climate change impacts is required to initiate adaptation practices to cope with climate change.
Projections indicate that climate variations in South Asia will be varied and heterogeneous with some regions experiencing more intense precipitation and increased flood risks. While direct impacts are associated with rise in temperatures, indirect impacts due to water availability and changing soil moisture status and pest and disease incidence are likely to be felt. The most significant impacts are felt by small holder rain-fed farmers who constitute the majority of farmers in this region and possess low financial and technical capacity to adapt to climate variability and change (Sivakumar and Stefanski, 2011). IPCC AR4 (IPCC, 2007c) noted that, in general, the frequency of more intense rainfall events in many parts of Asia has increased, causing severe floods, landslides, and mud flows. Also it is interesting to note that, at the same time, the number of rainy days and total annual amount of precipitation has decreased. Thus it is clear that the rain has been concentrated in few days. According to HDR (2006), rapid depletion of water resource is already a cause for concern in many countries in South Asia. About 2.5 billion people will be affected with water stress and scarcity by the year 2050 in South Asia. The greatest impacts of climate change will continue to be felt by the poor, who have the most limited access to water resources.
2.1.3 Climate change studies in Sri Lanka
Climate change trends
Annual mean air temperature anomalies in Sri Lanka have shown significant increasing trends during the recent few decades (Basnayake et al., 2002). The rate of increase of mean air temperature for the 1961-1990 period was in the order of 0.016 0C
per year (Chandrapala, 1996). A decreasing trend of 9.46 mm per year was observed in annual mean rainfall over the whole country from 1961 to 2000 time period (Figure 2.2). As a dense data base is available in rainfall, district wise rainfall data were analyzed which showed considerable differences in trends among them. The highest decreasing rate of 19.06 mm/year was observed for Kalutara district and the lowest rate was observed for Jaffna district (1.55 mm/years). Comparatively high decreasing trends were observed at Gampaha (15.94 mm/year) and Galle (15.32 mm/year) districts.
8
Figure 2.2. Annual average rainfall trends in Sri Lanka (1961-2000)
Application of Hadley Centre RCM over the Indian subcontinent
Hadley Centre RCM and its driving GCM were used to simulate the flow conditions and main features of the monsoon season precipitation including the break and active precipitation anomalies over the central India (Figure 2.3). However, only the RCM was able to capture the observed precipitation anomalies (Jones et al., 2004). Based on the fact that the RCM better represents the influence of the topography and the sub seasonal variations in monsoon precipitation, it deserves more confidence in its projections of the regional climate changes in Indian subcontinent.
Figure 2.3. Precipitation anomaly in the (a) GCM and (b) RCM (Jones et al., 2004)
0 500 1000 1500 2000 2500 3000 R ai nf al l i n m m Year
Rainfall - Sri Lanka (1961-2000)
(b) (a)
9
Climate change projections
According to SNC (2011), though there are several standard techniques available for downscaling the global projections to national levels, Sri Lanka lacks the capacity to do so, both in terms of human resources and computing facilities. IPCC projections which given on a very coarse resolution may not be appropriate for determining climate variations in a small country like Sri Lanka. Thus using RCMs for different time frames, temperature rise and rainfall change projections were developed corresponding to different IPCC emission scenarios. A study carried out using a RCM developed by the Hadley Centre showed that the rainfall receives by 2050 in the wet zone during the south west monsoon decreases by about 48% relative to the average rainfall received during 1961-1990, while during the north east monsoon, the rainfall receives in the dry zone, particularly in the eastern part, decreases by 27-29%.
The impact of climate change on northeast monsoon rainfall and southwest monsoon rainfall in Sri Lanka were predicted by HadCM3 model for 2050s under SRES A2 and SRES B2 scenarios (De Silva, 2010). Northeast monsoon rainfall (December to February) is predicted to decrease by 34% (SRES A2) and 26% (SRES B2), and the rainfall across the country is predicted to increase by 38% (SRES A2) and 16% (SRES B2) during the southwest monsoon. Moreover, Sri Lanka’s annual potential runoff for the baseline (1961-1990) and the HadCM3 SRES A2 and SRES B2 scenarios for 2050s were presented by De Silva (2010). The annual runoff across the country is predicted to decrease by 10% (SRES A2) and 8% (SRES B2) compared to the baseline. Same study showed that an increase of total potential groundwater across the country by 38% (SRES A2) and 13% (SRES B2), and an increase of reference evapotranspiration in northern and north eastern regions of Sri Lanka under both scenarios. According to De Silva (2010), HadCM3 model output provided reasonable estimate of the present and the future situation of climate in Sri Lanka.
Anticipated climate change impacts
In Sri Lanka, half a degree temperature rise is predicted to reduce rice output by 6%, and increased dryness will adversely affect yields of key products like tea, rubber, and coconut (MENR, 2000). An increase in the frequency of droughts and extreme rainfall events could result in a decline in tea yield, which would be the greatest in regions below 600 m (Wijeratne, 1996). A statistical analysis methodology was illustrated by Peiris and Kularatne (2008) using daily rainfall and air temperature from 1951 to 2001 for Hambantota, a major coconut growing district in Sri Lanka. According to them, the increase in maximum air temperature and the decrease in amount of rainfall per effective rainy day (> 5 mm) are the significant features of the climate variability in the Hambantota area. The annual rate of increase of maximum temperature after 1995 was 0.0260 C and the intensity of rainfall per effective rainy day
10
future climate will not be suitable for coconut cultivation, if growers do not apply the recommended practices to face long dry spells.
2.1.4 Climate change and potential effects on runoff and water quality
Effect of climate change on river discharges has gained considerable attention through numerous studies in many regions around the world: Australia by Thomas and Bates (1997); Asia by Ye et al. (1999); United States by Lins and Slack (1999); Europe by Arnell (1999a) and Arnell (2004), and Baltic Sea catchment by Graham (2004). However, few published studies have considered impacts in quantitative terms on real world systems. Manabe et al. (2004) and Nohara et al. (2006) have reported that the annual mean river discharge in many parts of the world may increase in the future giving an indication of availability of water resources in future climate conditions. A macro scale hydrological model has been used to simulate streamflow across the world at a spatial resolution of 0.5°x0.5°, under the 1961–1990 baseline climate and under several scenarios derived from HadCM2 and HadCM3 experiments. Both HadCM2 and HadCM3 scenarios include an increase in effective CO2 concentrations of 1% per
year. The patterns of absolute change in annual runoff by the 2050s are broadly similar to the change in annual precipitation, i.e., increases in high latitudes and many equatorial regions but decreases in mid latitudes and some subtropical regions (Arnell 1999b; Arnell et al., 2001).
Variations in flow from year to year have been found to be much more strongly related to precipitation changes than to temperature changes (Krasovskaia, 1995; Risby and Entekhabi, 1996). Also according to IPCC AR4 (IPCC, 2007b), in regions with little or no snowfall, changes in runoff are dependent much more on changes in rainfall than on changes in temperature. A general conclusion from studies in many rain dominated catchments is that flow seasonality increases, with higher flows in the peak flow season and either lower flows during the low flow season or extended dry periods. Key climate change determinants affecting water quality have been identified as the ambient temperature and the increase of extreme hydrological events. For heavy rain falls and strong hydrologic conditions, runoff and solid material transportation are the main consequences. Rainstorm events lead to elevated levels of turbidity and organic matter found in river water cause deterioration in treatment performance. For countries in the temperate zone, climate change will decrease the number of rainy days but increase the average volume of each rainfall event resulting challenges in treatment process (Brunetti et al., 2001; Bates et al., 2008; Delpla et al., 2009).
The climate change impacts on drinking water treatment issues have been summarized by Delpla et al., 2009 (Figure 2.4). The study emphasized that for treatment plants, considering that all remediation actions have been made, adaptation measures must be envisaged for a better efficiency, particularly with regards to
11
extreme rainfall and drought events. These measures integrating complementary treatment steps and process control shown to be important even for small water supply systems.
.
Figure 2.4. Climate change impacts and drinking water treatment issues (Delpla et al., 2009)
According to Arnell (2003), the different climate models and emissions scenarios explored broadly consistent changes in runoff. There was little difference in the pattern of change in runoff between the four SRES emissions scenarios considered, for a given climate model, even by the 2080s, and the greatest differences in pattern were between climate models. Romanowicz et al. (2006) modeled changes in river flow for a range of catchments, under different climate model projections. They concluded that by the 2020s flows in winter could increase by between 4% and 9% and that summer flows could decrease on average by 11% but this could range between 1% to 32% depending on the catchment location, land use, soils, geology, and model uncertainty.
Hydrologic simulation has become a powerful technique in sustainable land and water resources planning and management, and hydrological models have become increasingly more complex over the last few decades (Vogel, 2005). These models vary in a wide range depending on their capability, complexity, data requirements, scale and resolution. Based on the model accuracy, model capabilities and successful application to many catchments around the world, YHyM/BTOPMC (Takeuchi et al., 1999; Takeuchi et al., 2008) has been selected to simulate the major hydrological characteristics in the Gin catchment.
12
2.1.5 Effects of catchment land use change on hydrologic responses
Land use changes are complex and dynamic processes that link together natural, economic, social and cultural factors in time and space (Koomen and Stillwell, 2007), and there are enough evidence to show that land use and land cover changes have influence on hydrological regimes. Change of forest areas has been the most important land use changes influencing the hydrological response of a catchment. Several studies have revealed that alterations in vegetative cover in a catchment significantly affect the interception and evapotranspiration processes resulting a change in the runoff volume. According to Brooks et al. (1997) the generalised relationship based on catchment experiments worldwide is that a 10% reduction in coniferous forest, being converted to grassland, causes an average increase of 40 mm in annual runoff. In addition, Arnell et al. (2001) stated that changes in agricultural land use resulting directly or indirectly from climate change may affect catchment water balance and water quality. These effects may be more substantial than the direct effects of climate change on hydrology. The general views are that the effects of land use changes on hydrological regimes will be most readily felt in smaller catchments of up to several hundred square kilometers, whereas in relatively large catchments, the cumulative catchment effects are often insignificant (Kiersch, 2000; Tu , 2006).
Impacts of land use change such as deforestation, plantations and human settlements have been identified affecting water resources in Sri Lanka including pollution of water bodies (UNEP, 2001). Besides, the studies carried out by Maddumabandara (1997), and Elkaduwa and Sakthivadivel (1998) have shown significant influence on runoff generation following the changes in land use in selected catchments in Sri Lanka.
Land cover and land use changes considered to be important part of global change which affects many parts of human environment systems. Environmental management and land use planning therefore need information about the dynamics of land use. Spatially explicit modeling approaches including statistical regressions have been successfully applied to investigate land use change processes. Logistic regressions are a statistical technique to determine the significance, direction and strength of an independent variable on a dichotomous dependent variable (Hosmer and Lemeshow, 2000). Logistic regressions have been successfully applied to analyze the causes of deforestation (Chomitz and Gray, 1996; Mertens and Lambin, 2000) and cropland abandonment (Mu¨ller and Munroe, 2008). Thus this study employed a GIS based logistic regression approach to carry out spatially explicit land use change analysis across the Gin catchment in projecting the year 2020 land use.
13
2.2 Relationship between flow and water quality
Quantity and quality of water are closely linked. Water quality is the concentration of different constituents in the water including its temperature and state. Water quantity often relates only to discharge and water mass, but the way how water flow varies spatially and temporally is also important. This variation in flow is vital to freshwater ecosystems as discharge and water mass have considerable impact on physical as well as chemical quality aspects of water (Nilsson and Renöfält, 2008).
Human induced impacts on the river systems result in decrease in water quality, which is generally reflected by an increase of particulate matter in rivers. Anthropogenic land use causes excessive loads of pollutants to be washed into rivers during rainfall runoff events. According to the findings of Simpson and Stone (1988), the most damaging land use practice in terms of the magnitude of pollutant load washed into rivers appears to be urban and industrial land. The influences of agricultural development, deforestation, and human settlement have been shown to affect river flow and availability of nutrients in river water, by several studies. Temperature, turbidity and suspended solids in rivers can be greatly affected by human activities such as agriculture, deforestation and the use of water for cooling. The concentration of total suspended solids in rivers increases as a function of flow. Although a general increase can usually be observed in suspended sediment concentration with increasing water discharge, it can be affected by a number of river basin processes. Depending on the overall characteristics of the watershed, the peak in suspended sediment may, or may not, occur at the same time as the peak discharge (Chapman, 1996).
The relationships of water quality constituents to flow differ according to the water quality constituent, and the relationship may be site specific, where factors such as climatic region, land use and underlying geochemistry play a role. Turbidity generally increases with increasing flow, but high levels of turbidity may level off as silt from the surrounding catchment becomes depleted (Malan and Day, 2002a; Malan and Day, 2002b). Streamwater quality could be affected by streamflow volumes, affecting both concentrations and total loads. A reduction in streamflow might lead to increases in peak concentrations of certain chemical compounds. For example, Cruise et al. (1999) simulated increased concentrations of nitrate in the southeast United States, but the total amount transported showed a decrease (Arnell et al., 2001).
Many studies included various methods for load estimation. Estimation of mass loads transported from catchments by rivers fundamentally involves quantifying the total flux of water quality constituents transported by rivers past a point, over a fixed time period (Littlewood, 1992). The common approaches to estimate total flux, involve infrequent estimates of concentrations and frequent estimates of flow. These less than ideal conditions have led to the development of a variety of sampling schemes and
14
computational algorithms to estimate mass loads, including averaging methods, ratio based methods or regression estimators (Yaksich and Verhoff, 1983; Preston et al., 1989; Burn, 1990; Littlewood, 1992).
LOADEST (Runkel et al., 2004) was widely used to estimate constituent loads in rivers (Hooper et al., 2001; Aulenbach, 2006; Morrison and Colombo, 2006; Foster and Kenney, 2010; Lewis and Lamoureux, 2010; Stenback et al., 2011). LOADEST includes the minimum variance unbiased estimator presented by Cohn et al., (1989) which gives un biased load estimates and the associated random error in the LOADEST is better than the basic rating curve method. Thus this study employed LOADEST to develop regression models and estimate constituent loads.
2.3 Background to the present study
The present safe drinking water supply coverage in Sri Lanka is 81%. This includes national authority and small community water supplies, dug wells, rainwater harvesting etc. In a particular district, urban centers and town areas are usually covered with surface water based pipe-borne water supplies from the national authority (National Water Supply and Drainage Board). The rest of the areas mainly depend on the groundwater or surface water based small scale water supply systems with simple treatment (chlorination) manage by the community based organizations or non-governmental organizations. Certain areas where the groundwater cannot be treated using the conventional treatment processes have also opted for the surface water. The surface water supply in the country is primarily based on the river water. According to the country’s policy frame work, targets were set to achieve 94% safe drinking water supply by year 2015 and 100% by year 2020 (NWS&DB, 2011). Hence the necessary strategies are being set out currently by the government, to achieve the set targets. Water resources, their preservation, and providing safe drinking water to the people have been included in the process of strategy development.
Future population projection carried out according to the standard rate of growth of population, Sri Lanka (De Silva, 2007), revealed an increase of about 42,000 people in the Galle district by year 2020. Hence the target of providing all with safe drinking water by year 2020 has to be fulfilled despite the facts of increasing population pressure and declining water quality and quantity owing to various anthropogenic activities and natural processes.
However, no studies have investigated the combined influence of climate change and land use change on river flow regimes in Sri Lanka. Moreover, there have been no any assessments on anticipated adverse impacts on future river water quality, subsequent to the alterations in river flow regimes. Identifying plausible impacts on the future river water quality is vital in the context of drinking water production, particularly in achieving 100% safe drinking water supply by year 2020 as per Sri
15
Lanka’s strategies for sustainable water supply development. This study assists to fill this gap by presenting a study carried out in the Gin catchment.
17
CHAPTER III
STUDY AREA AND METHODOLOGY
3.1. Description of the study area
Gin River originates from the Gongala mountains in Deniyaya having an elevation of over 1300 m and flows to the Indian Ocean at Gintota in Galle district. Gin catchment lies approximately between 80°08" E to 80°40" E and 6°03" N to 6°26" N and encompasses Galle (83% of the basin area), Matara (9% of the basin area), Rathnapura (7% of the basin area), and Kalutara (1% of the basin area) administrative districts. Gin River and its catchment location are shown in Figure 3.1a.
Gin catchment area is about 932 km2 with a total population of about 600,000.
Rainfall pattern in the catchment is of bi-modal, falling between May and September (south west monsoon, which is the major rainfall event), and again between November and February (north east monsoon) followed by the inter monsoon rains during the remaining months of the year. Rainfall varies with altitude with mean annual rainfall above 3500 mm in the upper reaches to less than 2500 mm in the lower reaches of the catchment. Gin River annually discharges about 1268 MCM to sea (National Atlas, 2007). Average temperature in the catchment varies from 24°C to 32°C with high humidity levels and the dominant soil texture is sandy clay loam. Gin catchment which entirely lies within the wet zone of the country includes mountainous slopes in upper reaches, covered with forest canopy. Elevation and slope maps of the Gin catchment are shown in Figure 3.1b.
The catchment’s land is primarily used for human settlements, agriculture, natural forests, and plantation forests. Most of the population is concentrated in middle and lower reaches of the catchment, with the upstream sparsely populated. Human activities in the Gin catchment have increased substantially in the past few decades including alterations in land use pattern: subsequent to the expansion of homesteads, cultivated area in the basin has decreased by 10% between early 80s and late 90s (Wickramaarachchi et al., 2013b). These activities have been causing significant impacts on the quality and quantity of water in the river creating a need to monitor the quality of water.
18
Figure 3.1. (a) Location - Gin River and its catchment, (b) Elevation and slope - Gin catchment
Gin River is one of the main sources of water supply in Southern region of Sri Lanka and it is the primary drinking water source, from which pipe-borne water is supplied to Galle city, the capital of Southern Sri Lanka, averaging 0.7 MCM per month. Approximately 90 % of the drinking water requirement in Galle has been fulfilled by the Gin River. Though it is significant there remains a lack of comprehensive water quality analysis for the catchment.
Gin catchment is a priority area in the Southern region of the country in the context of socio economic development. Moreover it can be considered as a representative catchment in the country which primarily caters drinking water. Hence Gin catchment has been selected to apply the basic framework developed in this study which in turn can be applied in the other catchments in Sri Lanka as well as around the world.
Sri Lanka
Gin river’s Catchment Location
(a)
3.2. Hydrological process modeling
3.2.1. Description of YHyM/BTOPMCThe University of Yamanashi Distributed Hydrological Model wise use of TOPMODEL and Muskingum
distributed hydrological model developed at the University of Yamanashi, Japan. In the YHyM, runoff is generated based on the TOPMODEL concept (Beven and Kirkby 1979) and flow routing is carried out using the Muskingum Cunge method (Cunge 1969; Ao et al., 2003a; Ao
the BTOP model are illustrated in Fig
Figure 3.2. Runoff generation in a grid cell in the BTOP model (the vertical profile)
P is the gross rainfall, ET0 is the interception evaporation,
the interception state, Infmax is the infiltration capacity,
actual evapotranspiration, Sr max
root zone, SD is soil moisture deficit in unsaturated zone, zone, qof is the overland runoff,
is groundwater release. θwilt, θfc
respectively
The watershed is described by drainage networks extracted from digital elevation models, in which all pits are filled with calculated small elevat
(Ao, 2001; Ao et al., 2003b). The topographic index using the equation (1).
i i
i
ln /tan
19
Hydrological process modeling
Description of YHyM/BTOPMC
The University of Yamanashi Distributed Hydrological Model (YHyM) with wise use of TOPMODEL and Muskingum Cunge method (BTOPMC
distributed hydrological model developed at the University of Yamanashi, Japan. In the YHyM, runoff is generated based on the TOPMODEL concept (Beven and Kirkby
9) and flow routing is carried out using the Muskingum Cunge method (Cunge Ao et al., 2003b). The hydrological processes in a grid cell in the BTOP model are illustrated in Figure 3.2 (Takeuchi et al., 2008).
Runoff generation in a grid cell in the BTOP model (the vertical profile)
is the interception evaporation, Imax is the interception storage capacity,
is the infiltration capacity, Pa is the net rainfall on the land surface,
r max is the storage capacity of the root zone, Srz is the soil moisture state in
is soil moisture deficit in unsaturated zone, Suz is the soil moisture state in unsaturated
is the overland runoff, qif is the saturation excess runoff, qv is the groundwater recharge, and fc, θs are soil water content at wilting point, field capac
The watershed is described by drainage networks extracted from digital elevation models, in which all pits are filled with calculated small elevat
2003b). The topographic index γi for the th grid cell is calculated
(YHyM) with block TOPMC) is a grid based distributed hydrological model developed at the University of Yamanashi, Japan. In the YHyM, runoff is generated based on the TOPMODEL concept (Beven and Kirkby, 9) and flow routing is carried out using the Muskingum Cunge method (Cunge, 2003b). The hydrological processes in a grid cell in
Runoff generation in a grid cell in the BTOP model (the vertical profile) is the interception storage capacity, Is is
is the net rainfall on the land surface, ET is the is the soil moisture state in is the soil moisture state in unsaturated is the groundwater recharge, and qb
are soil water content at wilting point, field capacity and saturation
The watershed is described by drainage networks extracted from digital elevation models, in which all pits are filled with calculated small elevation increments
grid cell is calculated
20
Where αi is the drainage area per unit length of contour, tan βi denotes the slope of
grid cell, .
The runoff from a grid cell to the local schematic stream reach is the sum of saturation excess overland flow (qof) and groundwater discharge (qb) per unit length of
contour line:
i t
S
i t SD
i t
qof , uz , , (3.2) Where Suz is the unsaturated zone storage and SD is the saturation deficit for the th
grid cell at time .
i b i t T i SDm ki t q , 0 exp , tan (3.3)Where SD indicates the saturation deficit, T0 is the transmissivity, and m(k) is the
discharge decay factor in sub basin k.
In flow routing calculation using the Muskingum Cunge method, the river cross section is assumed to be rectangular and river width B (meters) is approximated by:
i C A
iB (3.4) where constant C = 10 and A is the drainage area in square kilometers (Lu et al., 1989).
The equivalent Manning’s roughness coefficient of a grid cell is estimated as
0
1/30 k tan /tan k
n
ni i (3.5) Where n0 and tan β0 are the equivalent roughness coefficient and slope at the outlet
of sub catchment k, respectively and n0 is a model parameter to be calibrated.
The generated overland flow and groundwater flow of each cell will be added to the stream and then routed to the basin outlet. The maximum root zone storage is calculated considering the distribution of land cover and rooting depth. The spatial variation of soil transmissivity over the catchment is considered based on the percentage of sand, silt, and clay present in each soil type. In the BTOPMC, spatially distributed monthly average potential evapotranspiration is calculated using the Shuttleworth Wallace method (Shuttleworth and Wallace, 1985).
21 3.2.2. Data sets and model set up
Table 3.1 shows the basic data required to run the model and sources of data. Table 3.1. Basic data input to run YHyM/BTOPMC and the sources of data
Data Set Source
Digital Elevation Map (DEM) Shuttle Radar Topography Mission (SRTM) (Available since 2004)
Soil map Department of Survey, Sri Lanka Land cover dataset Department of Survey, Sri Lanka Data for Shuttleworth and Wallace
simulation acquired from global public domain: Normalized Difference Vegetation
Index (NDVI)
Mean daily temperature Diurnal temperature range Vapor pressure
Cloud cover Wind speed
Advanced Very High Resolution Radiometer- Global Inventory Modeling and Mapping Studies (AVHRR- GIMMS)
(Available since 2004)
Intergovernmental Panel on Climate Change - Climate research unit (IPCC-CRU) 2.0 (Available since 1999)
Daily streamflow data
at Tawalama and Baddegama gauging stations Department of Irrigation, Sri Lanka Daily rainfall data
at Anninkanda, Natagala, Pallegama,
Baddegama, Labuduwa and Galle gauging stations
Department of Meteorology, Sri Lanka
DEM data
DEM data, which was having spatial resolution of 3" x 3" (Jarvis et al., 2008) was extracted from the SRTM data set available in http://srtm.csi.cgiar.org /SELECTION/inputCoord.asp. It was scaled up to 30" x 30" when input to the YHyM/BTOPMC due to the computational limitations. While inputting to the model, this scaled up DEM data was further compared with the DEM generated using the locally available contour data of 1: 50,000 scale. Input of the scaled up DEM data (from SRTM data set) to the model performed better in generating the stream network than the locally available data and hence used as the topography data in this study. Figure 3.3 shows the stream network generated by the model using SRTM data set.