Distributions and chemical states of water inside
electrolyte membrane of fuel cell during power
generation analyzed by nonlinear Raman spectroscopy
A Doctoral Dissertation
Presented to the Integrated Graduate School of Medicine,
Engineering and Agricultural Science
University of Yamanashi
December 2020
Hiromichi Nishiyama
Chapter 1 General introduction
1.1. Background ... 1
1.2. Proton exchange membrane fuel cell (PEMFCs) ... 4
1.3. Problems of PEMFCs ... 7
1.4. Various measurement techniques of reaction distributions inside PEMFCs ... 8
1.5. Objective ... 10
References ... 13
Chapter 2 Development of CARS spectroscopy measurement
system for fuel cells
2.1. Introduction ... 272.2. Principle of CARS ... 28
2.3. Non-resonant background removal ... 34
2.4. CARS spectroscopy setup ... 42
2.5. Single cell for the CARS spectroscopy measurement ... 45
2.6. Acquisition of calibration curve for quantifying the amount of water ... 50
2.7. Conclusion ... 54
state inside the PEM during cell operation
3.1. Introduction ... 59
3.2. Experimental setup ... 61
3.3. Result and discussion ... 64
3.3.1 Water distribution in hydrated PEM ... 64
3.3.2. Chemical state of water inside PEM ... 66
3.3.3. Water distribution and its chemical states during cell operation ... 76
3.4. Conclusion ... 83
References ... 85
Chapter 4 Water distribution and its chemical states in
transient state inside the PEM during cell
operation
4.1. Introduction ... 914.2. Experimental ... 92
4.3. Result and discussion ... 93
4.5. Conclusion ... 102
5.2. Future prospects ... 112
Reference ... 114
List of Publication ... 115
List of Patent ... 116
Meeting Abstract ... 117
Awards and others ... 119
Chapter 1
General introduction
1.1. Background
The growth of human society today has been supported by the use of fossil fuels, such as oil, coal and natural gas. We have achieved today’s industrial development by using electricity generated by energy conversion from fossil fuels. However, the fossil fuels which we can mine and use are finite. Nevertheless, the demand of fossil fuels is expected to increase with the growth of the world population, economic and industrial growth of the developing countries and the improvement of living standards [1]. Excessive use of fossil fuels causes serious environmental problems, such as global warming and atmospheric pollution. Therefore, the development of energy conversion technologies that do not rely on the use of fossil fuels is urgent for human society. As a low emission energy conversion technology, nuclear power generation has been used. Nuclear power generation had been thought to be one of the promising solutions to the problem of increase use of fossil fuels until the Fukushima Daiichi nuclear disaster in 2011 in Japan. After the disaster, the safety of nuclear power generation was considered
zero emission and safety, such as solar, wind, hydroelectric and geothermal power generations. However, these energy sources do not convert energy stably and do not fit to the demand for the electric power due to unpredictable weather patterns. Energy storage system, such as batteries, are used to mitigate the instability of the power generation. However, batteries are not suitable for storing large amount of electricity to meet the demand. In order to solve the problem on renewable energy conversion system, hydrogen has attracted much attention as a promising energy carrier produced from electricity generated by renewable energy conversion system. Hydrogen also can be produced from various resources; fossil fuels for reforming, byproducts in industrial processes, biomass and water for electrolysis [2]. This produced hydrogen is converted to electricity by using fuel cells.
Fuel cells (FCs) are devices that directly produce electricity by means of the electrochemical reaction of oxygen and fuels more efficiently than current energy conversion systems, and they have been expected to become a cleaner energy conversion system corresponding to power generation from small to large scales [3-7]. The first open experiment of fuel cell was carried out by Sir William Robert Grove in 1839. Fuel cells have also many advantages in modern society; high efficiency, silence and high reliability on a long-term basis. Moreover, in the case of using hydrogen as a fuel for FCs, water is
the only product for emission. FCs are thus essentially a “zero emission” device. The FCs are typically classified into four types by electrolytes and operating temperature they employ, such as polymer electrolyte fuel cells (PEFCs), solid oxide fuel cells (SOFCs), phosphoric acid fuel cells (PAFCs) and molten carbonate fuel cells (MCFCs). More specifically, PEFCs are classified into proton exchange membrane fuel cells (PEMFCs) and anion exchange membrane fuel cells (AEMFCs). Research and development (R&D) of PEMFCs and SOFCs are in active for vehicle and residential use, and these fuel cells have already been commercialized. In 2009, residential co-generation fuel cell system named “ENE-FARM” was released by electronic manufacturers and gas companies. ENE-FARM simultaneously produces electricity and heat, resulting in the energy utilization ratio of 95%. Fuel cell vehicles (FCVs) has also started to sell under the name of “MIRAI” by Toyota Motor Corporation in 2014 and “CLARITY FUEL CELL” by Honda Motor Co., Ltd. in 2016. These FCVs also serve as power sources on wheels capable of supplying electricity for several days for an average household. Additionally, European countries and China have recently announced plans to ban the sale of gasoline and diesel vehicle in the future, and R&D of FCVs is expected to become active.
1.2. Proton exchange membrane fuel cell (PEMFCs)
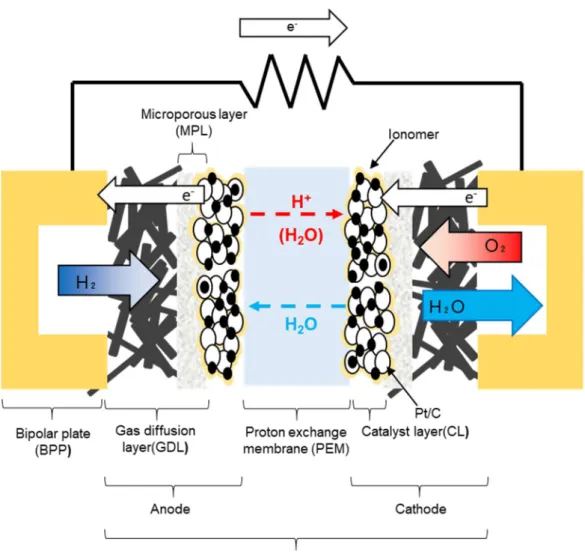
PEMFCs has received the most attention among several types of FCs and has been actively researched because of their advantages, such as high-power density, low operating temperature, quick start-up and shut down and easy maintenance. Figure 1-1Figure 1-1 shows a schematic drawing of a PEMFC. PEMFCs generally consists of two conducting bipolar plates (BPPs) with gas flow channels (GFCs) and a membrane electrode assembly (MEA) combined with a proton exchange membrane (PEM), two catalyst layer (CLs) and two gas diffusion layer (GDLs) at the anode and the cathode. The most widely used PEM today is a perfluorosulfonic acid membrane such as Nafion® (E.I. Du Pont Nemours & Company, Inc.) for its high proton conductivity and mechanical stability at various temperatures and humidities. The CL is generally composed of electrocatalyst (highly distributed Pt-based nanoparticle supported on carbon black (Pt/C) with high surface area) covered with thin layers of electrolyte ionomers as ion conducting binders. The GDL is a porous material typically consisting of a microporous fibrous backing material (carbon fiber paper) and a microporous layer (MPL) containing polytetrafluoroethylene (PTFE). The GDL has important roles for the water management, the electronic connection between the BPP and the electrode, the mechanical support for MEAs, and the protection of catalyst layer from the corrosion or erosion caused by
書式を変更: 文章校正を行
gas/water flows and other factors [8]. The GFC fabricated on BPPs works for supply of the reactant gases to the CL and the removal of generated water. There are various types of GFC designs; parallel, serpentine, interdigitated and bio-inspired [9]. In the PEMFCs, hydrogen and oxygen (or air) are supplied to the CLs through the GFCs and the GDLs at the anode and the cathode, respectively. During the cell operation, the hydrogen oxidation reaction (HOR) and the oxygen reduction reaction (ORR) occur at the anode (1.1) and the cathode (1.2), respectively, and water is generated at the cathode (1.3)
Anode: H → 2H + 2e (1.1) Cathode: 𝟏 𝟐𝐎𝟐 + 𝟐𝐇 + + 𝟐𝐞− → 𝐇 𝟐𝐎 (1.2) Overall reaction: H + O → H O (1.3) Protons and electrons from hydrogen generated on the triple phase boundary, where contact ionomers, reactants and catalysts, move to the cathode through the membrane and external circuit, respectively. Then, oxygen, protons and electrons react and produce water on the triple phase boundary. The generated water is partially incorporated into the membrane by the back-diffusion from the cathode to the anode by the gradient of the water concentration inside the MEA. The equilibrium cell voltage of a single PEMFC defined by the Nernst equation is 1.23 V at the standard ambient temperature and pressure
at the anode and the cathode, such activation, ohmic and concentration overpotentials. Practically, several hundreds of single cells are stacked in series to produce the desired level of electric power.
1.3. Problems of PEMFCs
The PEMFCs have been already commercialized with many advantages over other fuel cells, but higher cell performance/durability and cost reduction are still essential for further wide spread of PEMFCs. The Ministry of Economy, Trade and Industry (METI) of Japan has set a target of 40,000 FCVs, 1.4 million co-generation FCs and 160 hydrogen stations by 2020 on its roadmap [10]. To achieve these goals, the R&Ds are in progress in the fields of the improvement and optimization of the MEA components (CL, PEM, GDL), the cell design (BPP and GFC structure) and the operating conditions (temperature, humidification, start/stop process, load cycles and impurities in the fuel cell and air). Because the cost of the PEM and the Pt-based catalysis accounts for a large portion in the total FCV cost [11], using inexpensive materials and reducing the usage of expensive materials, while maintaining or improving the performance and durability, are required. Water management [12] is also important to further increase the cell performance and durability, because the transport behavior of water of water molecules inside PEMs, back-diffusion and electro-osmotic drag of water, as well as the water transport at the PEM/CL interface, have considerable impact on the cell performance and stability [13-17]. The deficient water decreases the proton conductivity of PEMs, resulting a significant
load cycles and start/stop process [18]. The corrosion of the carbon support at high electrode potentials causes the agglomeration and detachment of Pt catalyst accompanying by the cell performance loss.
1.4. Various measurement techniques of reaction distributions inside PEMFCs
Various reactions occur inside a PEMFC during the cell operation. These reactions may result in a non-uniform distribution of the power generation that cause a decrease in the cell performance and durability. Hence, it is intrinsically important to clarify the distributions of chemicals (O2, H2, H2O, CO2, H2O2, etc.) and physical (temperature, current density, gas flux, water flux, pressure etc.) parameters inside the PEMFC during cell operation. In order to measure these parameters, various in situ and operando measurement techniques have been proposed. Among these parameters, the distribution of current density is actively studied to optimize the operating conditions and design MEAs and fuel cells by using segmented current collectors [19-22] or magnetotomography [23, 24]. The result obtained by these techniques give an understanding of the water transport inside a PEMFC, because the mechanism of these measurement technique is related to the transport of electrons, protons, reactants and products. The geometry of the GFCs and ribs is one of the major factors affecting the
reaction distributions, because the effects of the geometry is not only on the gas diffusivity and the formation of liquid water [19, 21, 22, 25-28] but also on the electron transport resistance [29, 30] and the heat transfer [31] especially under the wet condition. The temperature distributions inside the MEAs have been measured by a black-body radiation [32], thermoelastic sensors [33] and optical fiber temperature sensors [34]. Temperature influences almost all chemical kinetics and mass transport mechanism in a PEMFC. During cell operation, the proton conductivity of the membrane and water diffusivity highly depend upon the temperature as well. The degradation mechanism of carbon support in start/stop cycles also has been investigated by the visualization of CO2 [35] and the measurement of internal current at the cathode by using segmented cell [36]. CO2 visualization detects and quantifies the amount of carbon corrosion and the corroded areas. Internal current measurement show that a segmented cell exposed to air for a long time was most degraded by the carbon corrosion. Visualization of oxygen partial pressure (p(O2)) has been performed by using an oxygen-sensitive dye film both on the upper GFCs and the GDLs [37, 38]. p(O2) is influenced by the consumption of oxygen for the power generation, generated liquid and gaseous water, the cross flow through the GDL and the internal pressure. The oxygen concentration and presence of liquid water inside
operating PEMFCs [39]. For the improvement of PEMFCs, one of the most important parameters is the water distribution inside the PEM. The water distribution inside the PEM has been studied by various methods, such as vibrational spectroscopy [40-61], nuclear magnetic resonance [62-65], neutron scattering/imaging [66-69] and X-ray scattering [25, 70]. These studies revealed that the reaction distributions are greatly affected by the generated water in PEMFCs. Not only the water distribution inside the PEM, but also the chemical states of water are the key factors for the proton conduction in PEMs. Vibrational spectroscopy toward water has been valuable for the study of hydration of water [40, 71-74]. In recent years the peak assigned to the O−H stretching region (2500−4000 cm−1) has been deconvoluted to identify the chemical states of water inside the PEM. Information on water distribution and chemical states of water during the cell operation is vital information for material development and improvement of operating conditions.
1.5. Objective
As mentioned above, the water distribution is quite important information for future R&D of FCs. Raman spectroscopy is an effective technique to quantitively elucidate the water distribution with high spatial resolution, on the order of micrometers, without
affecting the cell reactions. In addition, with Raman spectroscopy, the chemical states of water inside the PEM by peak deconvolution. This is the major advantage of the spectroscopy technique, though, many spectroscopy techniques have a disadvantage in time resolution. The signal intensity of water is very weak, and an exposure time of approximately 1 minute is required. As a result, only the steady states of water molecules have been analyzed [41, 49, 60, 61, 75, 76]. However, especially when considering R&D of FCVs, power generation is not constant because the process of start, acceleration, deceleration and sop is repeated during the cell operation. Hence, the water distribution and the accompanying reaction distribution change every moment. Therefor water distribution in the transient states during the cell operation is invaluable information for future R&D of FCVs. In order to measure the water distribution in transient states, coherent anti-Stokes Raman scattering (CARS) spectroscopy is promising method [77]. CARS spectroscopy is one of the nonlinear spectroscopy techniques in which the intensity of emitted light from the sample is proportional to square of the intensity of the first excitation light (ω1), the intensity of second excitation light (ω2) and the number of molecules, while the signal intensity of ordinary Raman scattering light is proportional only to the intensity of incident light and the number of molecules. This strong signal
in the transient state during the cell operation. Some researchers have reported on the CARS spectroscopy measurement using Nafion membranes [54, 58]. However, their measurement is only in non-power generating conditions, and CARS spectroscopy measurement during the cell operation have not yet been reported. Additionally, During the power generation of a PEMFC, the chemical states of water in a PEM have not been reported with any experimental technique. In this thesis, measurement of water distributions and chemical states analysis of water inside the PEM in steady and transient states during the cell operation with high time resolution of 1.0 s is carried out using newly developed CARS spectroscopy system for PEMFCs. This thesis consists of five chapters. In Chapter 2, the details of newly developed CARS spectroscopy system setup and spectral analysis method are explained. In Chapter 3, CARS spectroscopy measurement for water distribution under humidified condition and steady state during the cell operation was carried out, as well as the chemical states analysis of water inside the PEM by peak deconvolution of O−H stretching region. In Chapter 4, time-resolved CARS spectroscopy measurement of water distribution and chemical states analysis of water in transient state during the cell operation were performed. Finally, in Chapter 5, some representative results are summarized and the future prospects are overviewed.
References
[1] International Energy Outlook 2019 published by U.S. Energy Information Administration (EIA): https://www.eia.gov/outlooks/ieo/pdf/ieo2019.pdf (September 21 2020)
[2] Hydrogen energy white paper published by New Energy Industrial Technol ogy Development Organization (NEDO): https://www.nedo.go.jp/library/sui so_ne_hakusyo.html (September 21 2020)
[3] C.-Y. Wang, Fundamental Models for Fuel Cell Engineering. Chem. Rev. 2004, 104, 4727-4766.
[4] A.L. W. Vielstich, H. A. Gasteiger, Handbook of Fuel Cells: Fundamentals, Technology and Applications, vol.1; Wiliey & Sons: West Sussex, England, 2003. [5] L. Carrette, K.A. Friedrich, U. Stimming, Fuel Cells - Fundamentals and
Applications. Fuel Cells 2001, 1, 5-39.
[6] C. Yang, P. Costamagna, S. Srinivasan, J. Benziger, A.B. Bocarsly, Approaches and technical challenges to high temperature operation of proton exchange membrane fuel cells. J. Power Sources 2001, 103, 1-9.
[8] S. Park, J.W. Lee, B.N. Popov, A review of gas diffusion layer in PEM fuel cells: Materials and designs. Int. J. Hydrogen Energy 2012, 37, 5850-5865.
[9] B.H. Lim, E.H. Majlan, W.R.W. Daud, T. Husaini, M.I. Rosli, Effects of flow field design on water management and reactant distribution in PEMFC: a review. Ionics 2016, 22, 301-316.
[10] The Strategic Roadmap for Hydrogen and Fuel Cells published by Ministr y of Economy, Trade and Industry (METI): https://www.meti.go.jp/english /press/2019/pdf/0312_002a.pdf (September 21 2020)
[11] Fuel Cell System Cost—2017 published by United States Department of Energy (DOE): https://www.hydrogen.energy.gov/program_records.html#fuel_cells (September 21 2020)
[12] H. Li, Y. Tang, Z. Wang, Z. Shi, S. Wu, D. Song, J. Zhang, K. Fatih, J. Zhang, H. Wang, Z. Liu, R. Abouatallah, A. Mazza, A review of water flooding issues in the proton exchange membrane fuel cell. J. Power Sources 2008, 178, 103-117. [13] A. Husar, A. Higier, H. Liu, In situ measurements of water transfer due to different
mechanisms in a proton exchange membrane fuel cell. J. Power Sources 2008, 183, 240-246.
[14] S. Takaichi, H. Uchida, M. Watanabe, Response of specific resistance distribution in electrolyte membrane to load change at PEFC operation. J. Electrochem. Soc. 2007, 154, B1373-B1377.
[15] K.D. Kreuer, On the development of proton conducting materials for technological applications. Solid State Ion. 1997, 97, 1-15.
[16] P.W. Majsztrik, M.B. Satterfield, A.B. Bocarsly, J.B. Benziger, Water sorption, desorption and transport in Nafion membranes. J. Membr. Sci. 2007, 301, 93-106. [17] C.W. Monroe, T. Romero, W. Merida, M. Eikerling, A vaporization-exchange
model for water sorption and flux in Nafion. J. Membr. Sci. 2008, 324, 1-6. [18] S. Zhang, X.-Z. Yuan, J.N.C. Hin, H. Wang, K.A. Friedrich, M. Schulze, A review
of platinum-based catalyst layer degradation in proton exchange membrane fuel cells. J. Power Sources 2009, 194, 588-600.
[19] I.A. Schneider, S. von Dahlen, M.H. Bayer, P. Boillat, M. Hildebrandt, E.H. Lehmann, P. Oberholzer, G.G. Scherer, A. Wokaun, Local Transients of Flooding and Current in Channel and Land Areas of a Polymer Electrolyte Fuel Cell. J. Phys. Chem C 2010, 114, 11998-12002.
Direct and indirect estimates of HIV-1 incidence in a high-prevalence population. Am. J. Epidemiol. 1998, 147, 834-9.
[21] U.N. Shrivastava, K. Tajiri, M. Chase, Current density and ohmic resistance distribution in the land-channel direction of a proton exchange membrane fuel cell. J. Power Sources 2015, 299, 189-194.
[22] U.N. Shrivastava, K. Tajiri, Sources of current density distribution in the land-channel direction of a PEMFC. J. Electrochem. Soc. 2016, 163, F1072-F1083. [23] H. Lustfeld, M. Reißel, B. Steffen, Magnetotomography and Electric Currents in
a Fuel Cell. Fuel Cells 2009, 9, 474-481.
[24] J.R. Claycomb, A. Brazdeikis, M. Le, R.A. Yarbrough, G. Gogoshin, J.H. Miller, Nondestructive testing of PEM fuel cells. IEEE Trans. Appl. Supercond. 2003, 13, 211-214.
[25] P. Deevanhxay, T. Sasabe, S. Tsushima, S. Hirai, Investigation of water accumulation and discharge behaviors with variation of current density in PEMFC by high-resolution soft X-ray radiography. Int. J. Hydrogen Energy 2011, 36, 10901-10907.
[26] J. Eller, J. Roth, F. Marone, M. Stampanoni, A. Wokaun, F.N. Büchi, Implications of polymer electrolyte fuel cell exposure to synchrotron radiation on gas diffusion layer water distribution. J. Power Sources 2014, 245, 796-800.
[27] D. Natarajan, T. Van Nguyen, Three-dimensional effects of liquid water flooding in the cathode of a PEM fuel cell. J. Power Sources 2003, 115, 66-80.
[28] A. Turhan, K. Heller, J.S. Brenizer, M.M. Mench, Passive control of liquid water storage and distribution in a PEFC through flow-field design. J. Power Sources 2008, 180, 773-783.
[29] H. Butsch, C. Roth, D. Ritzinger, G. Hoogers, A. Bock, Spatially resolved contact pressure and contact resistance measurements at the gas diffusion layer: A tool for PEM fuel cell development. J. Electrochem. Soc. 2012, 159, B709-B713.
[30] P.C. Sui, N. Djilali, Analysis of coupled electron and mass transport in the gas diffusion layer of a PEM fuel cell. J. Power Sources 2006, 161, 294-300.
[31] E.F. Médici, J.S. Allen, Evaporation, two phase flow, and thermal transport in porous media with application to low-temperature fuel cells. Int. J. Heat Mass Transfer 2013, 65, 779-788.
[32] A. Hakenjos, H. Muenter, U. Wittstadt, C. Hebling, A PEM fuel cell for combined measurement of current and temperature distribution, and flow field flooding. J. Power Sources 2004, 131, 213-216.
[33] G.S. Zhang, L.J. Guo, L.Z. Ma, H.T. Liu, Simultaneous measurement of current and temperature distributions in a proton exchange membrane fuel cell. J. Power Sources 2010, 195, 3597-3604.
[34] K. Inman, X. Wang, In-situ temperature measurement on cathode GDL in a PEMFC using an optical fiber temperature sensor. J. Electrochem. Soc. 2013, 160, F496-F500.
[35] Y. Ishigami, I. Maeda, K. Takada, T. Hyakutake, T. Suga, J. Inukai, M. Uchida, Y. Nagumo, H. Nishide, M. Watanabe, Real-Time Visualization of CO2 Generated by Corrosion of the Carbon Support in a PEFC Cathode. Electrochem. Solid-State Lett. 2012, 15, B51-B53.
[36] A. Lamibrac, G. Maranzana, O. Lottin, J. Dillet, J. Mainka, S. Didierjean, A. Thomas, C. Moyne, Experimental characterization of internal currents during the start-up of a proton exchange membrane fuel cell. J. Power Sources 2011, 196, 9451-9458.
[37] K. Takada, Y. Ishigami, J. Inukai, Y. Nagumo, H. Takano, H. Nishide, M. Watanabe, Simultaneous visualization of oxygen distribution and water blockages in an operating triple-serpentine polymer electrolyte fuel cell. J. Power Sources 2011, 196, 2635-2639.
[38] J. Inukai, K. Miyatake, K. Takada, M. Watanabe, T. Hyakutake, H. Nishide, Y. Nagumo, M. Watanabe, M. Aoki, H. Takano, Direct Visualization of Oxygen Distribution in Operating Fuel Cells. Angew. Chem. Int. Ed. 2008, 47, 2792-2795. [39] W.K. Epting, S. Litster, Microscale measurements of oxygen concentration across the thickness of diffusion media in operating polymer electrolyte fuel cells. J. Power Sources 2016, 306, 674-684.
[40] M. Falk, An Infrared Study of Water in Perfluorosulfonate (Nafion) Membranes. Can. J. Chem. 1980, 58, 1495-1501.
[41] M. Hara, J. Inukai, K. Miyatake, H. Uchida, M. Watanabe, Temperature dependence of the water distribution inside a Nafion membrane in an operating polymer electrolyte fuel cell. A micro-Raman study. Electrochim. Acta 2011, 58, 449-455.
[42] M. Laporta, M. Pegoraro, L. Zanderighi, Perfluorosulfonated membrane (Nafion): FT-IR study of the state of water with increasing humidity. Phys. Chem. Chem. Phys. 1999, 1, 4619-4628.
[43] Z.X. Liang, W.M. Chen, J.G. Liu, S.L. Wang, Z.H. Zhou, W.Z. Li, G.Q. Sun, Q. Xin, FT-IR study of the microstructure of Nafion® membrane. J. Membr. Sci. 2004, 233, 39-44.
[44] D.I. Ostrovskii, A.M. Brodin, L.M. Torell, Raman study of water in Nafion-117 membranes. Solid State Ion. 1996, 85, 323-327.
[45] S. Quezado, J.C.T. Kwak, M. Falk, An Infrared Study of Water-Ion Interactions in Perfluorosulfonate (Nafion) Membranes. Can. J. Chem. 1984, 62, 958-966. [46] P. Scharfer, W. Schabel, M. Kind, Mass transport measurements in membranes by
means of in situ Raman spectroscopy - First results of methanol and water profiles in fuel cell membranes. J. Membr. Sci. 2007, 303, 37-42.
[47] Y. Tabuchi, R. Ito, S. Tsushima, S. Hirai, Analysis of in situ water transport in Nafion® by confocal micro-Raman spectroscopy. J. Power Sources 2011, 196, 652-658.
[48] M.C. Ferrari, J. Catalano, M.G. Baschetti, M.G. De Angelis, G.C. Sarti, FTIR-ATR Study of Water Distribution in a Short-Side-Chain PFSI Membrane. Macromolecules 2012, 45, 1901-1912.
[49] M. Hara, J. Inukai, B. Bae, T. Hoshi, K. Miyatake, M. Uchida, H. Uchida, M. Watanabe, Micro-Raman study on water distribution inside a Nafion membrane during operation of polymer electrolyte fuel cell. Electrochim. Acta 2012, 82, 277-283.
[50] D.W. Hofmann, L. Kuleshova, B. D'Aguanno, V. Di Noto, E. Negro, F. Conti, M. Vittadello, Investigation of water structure in nafion membranes by infrared spectroscopy and molecular dynamics simulation. J. Phys. Chem. B 2009, 113, 632-639.
[51] K. Kunimatsu, B. Bae, K. Miyatake, H. Uchida, M. Watanabe, ATR-FTIR study of water in Nafion membrane combined with proton conductivity measurements during hydration/dehydration cycle. J. Phys. Chem. B 2011, 115, 4315-4321. [52] M.A. Barique, E. Tsuchida, A. Ohira, K. Tashiro, Effect of elevated temperatures
on the states of water and their correlation with the proton conductivity of Nafion. ACS Omega 2018, 3, 349-360.
[53] T. Awatani, H. Midorikawa, N. Kojima, J.P. Ye, C. Marcott, Morphology of water transport channels and hydrophobic clusters in Nafion from high spatial resolution AFM-IR spectroscopy and imaging. Electrochem. Commun. 2013, 30, 5-8. [54] X. Ling, M. Bonn, S.H. Parekh, K.F. Domke, Nanoscale distribution of sulfonic
acid groups determines structure and binding of water in Nafion membranes. Angew. Chem. Int. Ed. 2016, 55, 4011-4015.
[55] H. Noguchi, K. Taneda, H. Minowa, H. Naohara, K. Uosaki, Humidity-dependent structure of surface water on perfluorosulfonated ionomer thin film studied by sum frequency generation spectroscopy. J. Phys. Chem C 2010, 114, 3958-3961. [56] D.I. Ostrovskii, L.M. Torell, M. Paronen, S. Hietala, F. Sundholm, Water sorption
properties of and the state of water in PVDF-based proton conducting membranes. Solid State Ion. 1997, 97, 315-321.
[57] Z.H. Ping, Q.T. Nguyen, S.M. Chen, J.Q. Zhou, Y.D. Ding, States of water in different hydrophilic polymers - DSC and FTIR studies. Polymer 2001, 42, 8461-8467.
[58] A. Syouji, M. Sakai, M. Hara, H. Matsushima, Drying process of water in a Nafion membrane embedded in the fuel cell analyzed by coherent anti-Stokes Raman scattering spectroscopy. Jpn. J. Appl. Phys. 2018, 57, 117101.
[59] D.S. Warren, A.J. McQuillan, Infrared Spectroscopic and DFT vibrational mode study of perfluoro(2-ethoxyethane) sulfonic acid (PES), a model Nafion side-chain molecule. J. Phys. Chem. B 2008, 112, 10535-10543.
[60] Z. Peng, V. Badets, P. Huguet, A. Morin, P. Schott, T.B.H. Tran, M. Porozhnyy, V. Nikonenko, S. Deabate, Operando μ -Raman study of the actual water content of perfluorosulfonic acid membranes in the fuel cell. J. Power Sources 2017, 356, 200-211.
[61] P. Huguet, A. Morin, G. Gebel, S. Deabate, A.K. Sutor, Z. Peng, In situ analysis of water management in operating fuel cells by confocal Raman spectroscopy. Electrochem. Commun. 2011, 13, 418-422.
[62] R.S. Chen, J.P. Jayakody, S.G. Greenbaum, Y.S. Pak, G. Xu, M.G. Mclin, J.J. Fontanella, Studies of water in Nafion membranes - using deuteron and O-17 nuclear-magnetic-resonance, and dielectric-relaxation techniques. J. Electrochem. Soc. 1993, 140, 889-895.
[63] S. Suarez, S. Greenbaum, Nuclear magnetic resonance of polymer electrolyte membrane fuel cells. Chem. Rec. 2010, 10, 377-393.
[65] S. Tsushima, T. Ikeda, T. Koido, S. Hirai, Investigation of water distribution in a membrane in an operating PEMFC by environmental MRI. J. Electrochem. Soc. 2010, 157, B1814-B1818.
[66] G. Gebel, O. Diat, S. Escribano, R. Mosdale, Water profile determination in a running PEMFC by small-angle neutron scattering. J. Power Sources 2008, 179, 132-139.
[67] D. Kramer, J.B. Zhang, R. Shimoi, E. Lehmann, A. Wokaun, K. Shinohara, G.G. Scherer, In situ diagnostic of two-phase flow phenomena in polymer electrolyte fuel cells by neutron imaging Part A. Experimental, data treatment, and quantification. Electrochim. Acta 2005, 50, 2603-2614.
[68] B.C. Seyfang, P. Boillat, F. Simmen, S. Hartmann, G. Frei, T. Lippert, G.G. Scherer, A. Wokaun, Identification of liquid water constraints in micro polymer electrolyte fuel cells without gas diffusion layers. Electrochim. Acta 2010, 55, 2932-2938.
[69] H.Y. Tang, A. Santamaria, J. Kurniawan, J.W. Park, T.H. Yang, Y.J. Sohn, Developing a 3D neutron tomography method for proton exchange membrane fuel cells. J. Power Sources 2010, 195, 6774-6781.
[70] K. Schmidt-Rohr, Q. Chen, Parallel cylindrical water nanochannels in Nafion fuel-cell membranes. Nat. Mater. 2008, 7, 75-83.
[71] Y.Q. Wang, Y. Kawano, S.R. Aubuchon, R.A. Palmer, TGA and time-dependent FTIR study of dehydrating Nafion-Na membrane. Macromolecules 2003, 36, 1138-1146.
[72] S.R. Lowry, K.A. Mauritz, An investigation of ionic hydration effects in perfluorosulfonate ionomers by Fourier transform infrared spectroscopy. J. Am. Chem. Soc. 1980, 102, 4665-4667.
[73] R. Buzzoni, S. Bordiga, G. Ricchiardi, G. Spoto, A. Zecchina, Interaction of H2O, CH3OH, (CH3)2O, CH3CN, and pyridine with the superacid perfluorosulfonic membrane Nafion: an IR and Raman study. J. Phys. Chem. 1995, 99, 11937-11951. [74] M. Ludvigsson, J. Lindgren, J. Tegenfeldt, FTIR study of water in cast Nafion
films. Electrochim. Acta 2000, 45, 2267-2271.
[75] Z. Peng, P. Huguet, S. Deabate, A. Morin, A.K. Sutor, Depth-resolved micro-Raman spectroscopy of tri-layer PFSA membrane for PEM fuel cells: how to obtain reliable inner water contents. J. Raman Spectrosc. 2013, 44, 321-328.
[76] S. Deabate, R. Fatnassi, P. Sistat, P. Huguet, In situ confocal-Raman measurement of water and methanol concentration profiles in Nafion® membrane under cross-transport conditions. J. Power Sources 2008, 176, 39-45.
Chapter 2
Development of CARS spectroscopic measurement system for
fuel cells
2.1. Introduction
Operando analysis of the water distribution and its chemical states inside the PEM during the cell operation are important to elucidate the reaction distribution, as described in Chapter 1. A new spectroscopic technique allowing the water distribution measurement with high time resolution is developed prior to the measurement. In this Chapter, the developed spectroscopic systems are explained.
The new system enables us to measure the water distribution inside the PEM during cell operation with high time resolution by CARS spectroscopy. The concept of the CARS spectroscopic system, which has been developed at the University of Yamanashi [1], was partly employed. In order to achieve high time resolution, the measurement equipment was improved, the measurement conditions were reviewed, and the analysis method was established. In addition, a new cell was developed to perform measurements inside the cell during actual cell operation.
First, the CARS spectroscopic system was established, and then a new cell for CARS spectroscopic measurements was developed.
2.2. Principle of CARS
CARS is a nonlinear optical process that produces a nonlinear response to the excitation light and a coherent Raman light flux. Therefore, when CARS is used as a spectroscopic method, we can expect various possibilities that cannot be found in the usual Raman scattering, such as high time resolution.
From the classical physics perspective, Raman scattering is based on the scattered light, which is modulated by molecular vibration (frequency Ω) caused by electric polarization described as (2.1) induced by the electric field, E, of the excitation light, which has a frequency of ω1.
𝑷 = 𝛼𝑬 = 𝛼 1
2 𝐸 𝑒 + 𝑐. 𝑐. (2.1)
Where α and c.c.is polarizability and complex constant, respectively. The scattered light consists of Stokes (frequency ω2 = ω1 – Ω) and anti-Stokes (frequency ω3 = ω1 + Ω) components. Spontaneous Raman scattering produces incoherent scattered light due to
random-phase thermal oscillations. The potential stored in the molecule, U, and the force applied to the oscillator, F, by the electric field of (2.1) are expressed by (2.2) and (2.3), respectively: 𝑈 = −1 2𝛼𝐸 (2.2) 𝐹 =1 2 𝜕𝛼 𝜕𝑄 𝐸 (2.3)
where the vibration coordinate is Q. When the light intensity of the Stokes component reaches a certain intensity, the photoelectric field applied to the molecule is expressed by (2.4), and the force F applied to the oscillator has a component of the frequency Ω represented by (2.5), which excites a molecular vibration resonantly.
𝑬 = 1 2 𝐸 𝑒 + 𝐸 𝑒 + 𝑐. 𝑐. (2.4) 𝐹(𝛺) =1 4 𝜕𝛼 𝜕𝑄 𝐸 𝐸 ∗𝑒 + 𝑐. 𝑐. (2.5)
Where the superscript * means a conjugate complex number. Since all the molecules vibrate in the same phase, the Raman light becomes a coherent light flux. The Stokes
component is the induced Raman, and the corresponding decay of ω1 is the inverse Raman effect.
In order to cause such a coherent Raman process, it is effective to make the ω2 light beam incident on the sample as a second excitation light beam superimposed on the ω1 light beam. ω1 and ω2 are referred to as the pump light and Stokes light beams, respectively. If the frequency of ω1 is fixed and ω2 is swept near Ω, the amplitude of the excited molecular vibration is expressed by (2.6), and shows a Raman-type resonance at δ = 0.
𝑄 = 1 8𝛺 𝜕𝛼 𝜕𝑄 𝐸 𝐸∗ 𝛿 − 𝑖𝛤𝑒 ( ) + 𝑐. 𝑐. (2.6) 𝛿 = 𝛺 − (𝜔 − 𝜔 ) (2.7)
where Г is the declining constant and is equal to the half width at half maximum of the vibrational mode of the molecule. This oscillation modulates the induced polarization caused by the ω1 and ω2 beams to produce a coherent nonlinear polarization. The CARS component, which has a frequency ωCARS = 2ω1 – ω2, is given by the following equation.
𝑷(𝜔 ) = 𝜒( )(𝜔 )𝜀 𝜀∗𝑒 [ ( ) ]+ 𝑐. 𝑐. (2.8)
𝐸 = 1
𝑘 = 𝑛 𝜔 /𝑐 (2.10)
where 𝜒( ), ε, k, z, n and c are the third-order nonlinear susceptibility, dielectric constant, wavenumber, optical path length, reflective index and speed of light, respectively. 𝜒( ) is expressed by equation (2.11) in the one-dimensional oscillator model. 𝜒( )(𝜔 ) =1 4 𝜕𝛼 𝜕𝑄 1 𝛿 − 𝑖𝛤 (2.11)
The intensity of the CARS photoelectric field is obtained by solving Maxwell’s equations under the condition that the optical path length dependence of ε1 and ε2 is negligible and is described by (2.12).
𝐼 = 2 𝜋 𝜔
𝑛 𝑛 𝑛 𝑐 [𝜒(𝜔 )] 𝐼 𝐼 𝑧
sin(𝛥𝑘 ⋅ 𝑧 2⁄ )
(𝛥𝑘 ∙ 𝑧 2⁄ ) (2.12)
Δ𝑘 = 2𝑘 − 𝑘 − 𝑘 (2.13)
As described in (2.12), the intensity of the CARS photoelectric field is proportional to the square of the first excitation light intensity, 𝐼 and the intensity of the second excitation light 𝐼 . This strong intensity enables data to be acquired in a short time and high time resolution to be achieved.
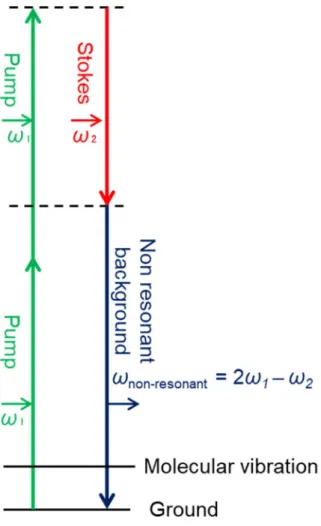
In summary, by simultaneously irradiating the sample with light of two different frequencies corresponding to the molecular vibration, pump light (ω1) and Stokes light (ω2), the molecular vibration is excited coherently and emits strong light having a frequency of ωCARS = 2ω1 − ω2. The energy process of Raman scattering and CARS is shown in Figure 2-1 (a) and (b). In recent years, multiplex CARS spectroscopy has been established, [2-6] which can measure molecular vibrations in a wide range at once by using light having a broad wavelength for Stokes light. In this study, multiplex CARS spectroscopy was used to quantify the water distribution in the PEM inside the operating fuel cell with high time resolution.
2.3. Non-resonant background removal
As mentioned above, CARS spectroscopy is a promising way technique that enables one to measure the water distribution inside the PEM with high time resolution. However, there are disadvantages. One is the presence of a signal called the non-resonant background that occurs simultaneously with the CARS process [2, 3, 7-14]. Figure 2-2 shows an example of a non-resonant background ladder diagram. Non-resonant background is one of the third-order nonlinear optical processes that contain no information regarding the molecular vibration. And as shown in Figure 2-2, it has the same frequency as the CARS process, 2ω1 – ω2. In addition, because the CARS signal and the non-resonant background are both coherent, they interact with each other, and the signal light gives a characteristic dispersive spectrum. Therefore, the presence of non-resonant background significantly reduces the information accuracy of the CARS spectrum.
In this study, a modified Kramers-Kronig (KK) phase retrieval transformation [12] was applied to extract the CARS signal from spectra mixed with non-resonant background. As with many other spectroscopic methods, extracting the complete information from the CARS spectrum requires the signal modulus |χ(ω)| and phase information φ(ω). The CARS signal intensity is proportional to the squared modulus of the complex third-order susceptibility, |χ(ω)|2, where χ(ω) has a resonant (χR) and non-resonant (χNR) part, as described in (2.14):
|𝜒(𝜔)| = |𝜒 | + 2𝜒 Re[𝜒 (𝜔)] + |𝜒 (𝜔)| (2.14)
Where Re[] in eq. (2.14) means a real part of the complex susceptibility. The vibrational resonances of the CARS spectrum show a clear background-dependent frequency and amplitude shift due to the coherent addition of the contributions of resonant and non-resonant signals. Therefore, the overall CARS intensity is not suitable information for obtaining quantitative composition information. On the other hand, the imaginary part (Im[]) of CARS susceptibility, Im[χR], represents Raman linearity and is suitable for quantitative analysis [15]. Once the spectral phase is known, Im[χR] can be obtained from
the CARS signal. The Kramers-Kronig relation [16], shown in (2.15), is often used to obtain phase information from the modulus of the susceptibility.
𝜙(𝜔) = −𝑃 𝜋
𝑙𝑛|𝜒(𝜔 )|
𝜔 − 𝜔 𝑑𝜔 (2.15)
where, ln means the natural logarithm, P is the Cauchy principal value. 𝜒(𝜔) is described as (2.16)
𝜒(𝜔) = |𝜒(𝜔)|𝑒𝑥𝑝[𝑖𝜙(𝜔)] (2.16)
In cases where the response is causal and holomorphic, such as CARS, KK analysis is appropriate. However, this type of analysis is only useful when the experimental data covers an infinite frequency range. Recently, an alternative phase retrieval approach based on Fourier transform spectral interferometry [17], equivalent to performing a KK transform, has been applied to multiplex CARS microscopy.
The following shows how to manipulate the time-domain representation of a signal to account for the nonideality of the CARS response, including a frequency-dependent
non-resonant background. In order to make this idea easier to understand, the operator is defined in (2.17).
𝜓 𝑓(𝜔) = ℑ 𝑢(𝑡)ℑ [𝑓(𝜔)] (2.17)
Where ℑ and ℑ−1 denote the Fourier transform and inverse Fourier transformation, respectively, and u(t) is the Heaviside Function, and the Fourier transform of u(t) can be expressed as (2.18):
ℑ[𝑢(𝑡)] =1
𝑖√2𝜋𝜔 + √𝜋
2 𝛿(𝜔) (2.18)
Based on the convolution theorem, (2.17) can be rewritten as (2.19).
𝜓 𝑓(𝜔) = 1
√2𝜋ℑ[𝑢(𝑡)] ∗ ℑ[ℑ [𝑓(𝜔)]]
= 1
√2𝜋ℑ[𝑢(𝑡)] ∗ 𝑓(𝜔) (2.19)
Substituting (2.18) to (2.19) and writing out the convolution integral explicitly, (2.20) is obtained. 𝜓 𝑓(𝜔) =1 2 −𝑖 𝜋 𝛲 𝑓(𝜔 ) 𝜔 − 𝜔𝑑𝜔 + 𝑓(𝜔) (2.20)
Combining (2.16) and (2.20), the phase is expressed as (2.21). 𝜙(𝜔) =−1 𝜋 𝑃 𝑙𝑛 𝜒 𝜔′ 𝜔′ − 𝜔 𝑑𝜔′ ∞ ∞ = 2Im 𝜓(𝑙𝑛|𝜒(𝜔)|) −𝑙𝑛 |𝜒(𝜔)| 2 (2.21)
where the CARS signal is proportional to |χ(ω)|2. u(t)ℑ−1[f(ω)] in (2.19) is replaced with (2.22) and the Fourier transformation of the non-resonant background signal is used at negative time to extract the CARS signal.
𝜂 𝑡: 𝑓(𝜔) =
ℑ [𝑓(𝜔)], 𝑡 ≥ 0 ℑ [𝑓 (𝜔)], 𝑡 < 0
(2.22)
where fNR(ω) is the non-resonant component of the response. Thus, the spectral phase is given by (2.23).
An example of this process is shown in Figure 2-3. Here, we used the CARS signal of a Nafion® 211 membrane placed on a Si plate as a representative spectrum shown as a green line in Fig. 2-3(a), and the non-resonant background (NRB) was taken from a glass plate shown as a red line in Fig. 2-3(a). The Raman-like spectrum is produced from the reconstructed phase as |𝜒(𝜔)|𝑠𝑖𝑛[𝜑(𝜔 )], shown in Fig. 2-3 (b), where 𝜑(𝜔 ) is the retrieved phase. The peaks around 731, 804, 970 and 1065 cm−1 originated from the stretching vibrations of CF, CS, CO and SO in the Nafion main and side chains, respectively. A set of broad peaks of O−H stretching, ν(O−H), of water was observed around approximately 3400 cm−1. The wavenumbers of each vibrational peak for Nafion were consistent with previous reports [18-20].
Raw CARS spectrum Non-resonant background
4000 3500 3000 2500 2000 1500 1000 Raman shift / cm-1
Figure 2-3 (a) CARS spectrum from Nafion 211 membrane placed on a Si plate (green) and the non-resonant background from glass plate (red), and (b) the Raman-like spectrum produced from non-resonant background removal.
(a)
2.4. CARS spectroscopy setup
Figure 2-4 shows a schematic illustration of the setup of the reflection-type microscopic multiplex CARS spectroscopy. The pulse light from a Ti-sapphire laser (Mira-HP-P, Coherent) of 750 nm wavelength, 1.2 ps pulse width and 76 MHz repetition rate were divided into two beams. One beam was converted to light of 532 nm wavelength (ω1) by an optical parametric oscillator (Mira-OPO, Coherent). The other beam was converted to white light (ω2) by passing through a 150-mm long photonic crystal fiber (NL-PM-750, NKT Photonics). The temporal position of the two light beams was matched using an optical-delay stage, and each beam path was set to be coaxial using a dichroic mirror. The pulses of the excitation light were focused onto the PEM in a PEMFC, positioned horizontal with the cathode side up, using a 50× objective lens with a numerical aperture of 0.5 (LMPLFLN, Olympus) installed in an optical microscope (BX51, Olympus). The cell was mounted on a vertical lift stage (VSR20A-E01T3, Zaber Technologies Inc.) that allowed CARS spectra to be recorded at different depths inside the membrane during the cell operation with an accuracy of ±1 μm. The anti-Stokes light emitted from the PEM was collected by the objective lens and separated from the reflected incident light by a dichroic mirror. The spectrum was measured by a 50-cm spectrometer (SpectraPro 2500, Acton Research) equipped with a CCD detector cryogenically cooled
(PyLon 400BR eXcelon, Princeton Instruments). The spectral resolution was 3 cm−1.The diameter and depth of the focal spot were calculated from the specifications of the objective lens and the laser diameter. The diameter of the focal spot was calculated as follows:
𝑆𝑝𝑜𝑡𝑑𝑖𝑎𝑚𝑒𝑡𝑒𝑟 =4 × 𝜆 × 𝑓
𝜋 × 𝑑 (2.23)
where, λ, f, d are the wavelength of the laser light (532 nm), focal length of the objective lens (10.6 mm), and diameter of the laser beam (2.0 mm), respectively. The diameter of the focal spot was calculated as 3.6 nm. The depth of the focal spot was calculated as follows:
𝐹𝑜𝑐𝑎𝑙𝑑𝑒𝑝𝑡ℎ = 𝜆
2 × (𝑁. 𝐴) (2.24)
where (N.A) is the numerical aperture of the objective lens (0.5). The focal depth was calculated as 1.06 μm.
2.5. Single cell for the CARS spectroscopic measurement
Figure 2-5 (a) schematically shows the PEMFC for the CARS spectroscopic measurements. In order to introduce the laser light into the cell and extract the CARS light out from the cell, the cathode endplate has a 16 mm × 19 mm hole. A glass window is formed by sandwiching borosilicate glass (18 mm × 24 mm × 0.15 mm) with gaskets. Stainless-steel plates coated with Au were employed as current collectors with flow channels being carved at both the cathode and the anode. Nine straight flow channels with 1.0 mm width and 1.0 mm depth were used. The interval between the channels was 1.0 mm.
Nafion membranes (NRE211, DuPont) were used as received. Gas diffusion electrodes (GDEs) were prepared by the following procedure. A slurry of Pt catalyst supported on carbon black (Pt/C) (TEC10E50, 46.2 mass% Pt, Tanaka Kikinzoku Kogyo) containing Nafion dispersion (IEC = 0.9 meq g−1, DE521, DuPont) as an ionomer was stirred in a planetary ball mill for 30 min. The dry-basis mass ratio of Nafion ionomer to carbon black was adjusted to 0.7. The paste was maintained at 60 ºC and uniformly coated on a gas diffusion layer (GDL29BC, SIGRACET®, SGL Carbon) by use of a pulse-swirl-spray apparatus (PSS, Nordson), followed by drying at 60 ºC under vacuum. The
geometric area and the Pt loading of the catalyst layers were 2.0 cm × 2.0 cm and 0.5 ± 0.1 mg cm−2, respectively.
Figure 2-5 (b) shows an enlarged schematic illustration of an MEA. On the cathode side, a pinhole 0.5 mm in diameter was prepared in the middle of the GDE, through which direct access of light to the membrane was provided, allowing the CARS spectra to be obtained with a minimal perturbation of the operating conditions [21]. From the phase matching condition (2.13) and the condition that the pump light and the Stokes light are irradiated in an overlapping manner, the CARS light is emitted with high directivity in the coaxial direction with the irradiation. Therefore, in the reflection-type CARS spectroscopic system, the intensity of the CARS light incident on the objective lens for light sampling is extremely weak, making the measurement difficult or not able to achieve sufficient time resolution. To solve this problem, a Pt foil of the same size as the pinhole was placed between the Nafion membrane and the GDE opposite to the pinhole on the cathode side on the anode side for the efficient reflection of the CARS light to the objective lens. As for pinholes, it is known that a diameter of 500 μm has only a very small effect on water distribution [21]. And as for the installation of Pt foil, it is considered that there is almost no effect of the presence or absence of platinum foil because the proton conduction path in contact with the catalytic layer across the membrane just below the
pinhole is dead-ended by the presence of the pinhole.The MEA was created by pressing GDE, PEM, and Pt foil at 140 °C with a force of 10 kgf cm-2 for 3 minutes.
The performance of the cell is shown in Figure 2-6. It was confirmed that stable power generation up to 1.0 A cm−2, which was the highest available current density without the pinhole and Pt foil, was possible. Thus, the influence of the cell structure should be small on the performance of the cell.
Figure 2-6 I-V curve obtained using a PEMFC for CARS spectroscopic measurement. Cell temperature = 80 °C; relative humidity = 80% RH; gas species of the cathode and the anode = O2 and H2, respectively; gas flowrate = 500 ml min−1 both the cathode and the anode.
2.6. Acquisition of calibration curve for quantifying the amount of water
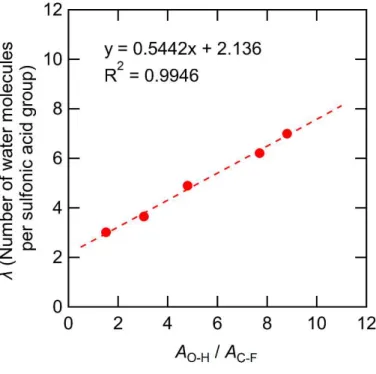
Due to the scattering of the irradiated laser inside the membrane, the peak intensity of the spectrum depended on the measurement position. Therefore, the ratio of the peak areas of ν(O−H) and ν(C−F) (AO−H/AC−F) was used to quantify the number of water molecules inside the membrane. AO−H/AC−F can be considered as the ratio of the number of O−H stretching vibrations to the number of C−F stretching vibrations, and AO−H/AC−F has a specific value corresponding to the water content of the membrane, because the C−F stretching vibration does not depend on the water content.
To obtain calibration curves before the cell operation, the cell was fully purged by supplying humidified N2 gas with various humidities (30, 40, 60, 80 and 90% RH). The CARS spectra recorded at the middle position in the Nafion membrane at 80 ºC under an N2 flow humidified at 40, 60 and 80% RH are shown in Figure 2-7. Every CARS spectrum was normalized by the peak height of the symmetric vibration of CF2, ν(C−F), located around 731 cm-1, least influenced by the presence of water molecules[18]. A set of broad peaks of O−H stretching, ν(O−H), of water was observed around approximately 3400 cm−1. As seen in Figure 2-7, the area of the ν(O−H) peak increased with the increase of RH, corresponding to the increase of water molecules inside the PEM. As a result, the ratio of the peak areas of ν(O−H) and ν(C−F) defined as AO−H/AC−F was increased with
relative humidity (Figure 2-8). To quantify the amount of water in PEM from spectral data, a calibration curve of the number of water molecules per sulfonic acid group, λ vs. AO−H / AC−F (Figure 2-9) was created by removing the RH term from AO−H / AC−F vs. RH data and previously reported λ vs. RH data [21]. The values of AO−H / AC−F were directly related to the amount of water in the membrane.
Figure 2- 7 Overall (a) and enlarged (b) CARS spectra of Nafion membrane obtained at 40, 60, and 80% RH at 80 ºC., with 100 ml min−1 N2 feed.
Figure 2- 9 Calibration curve of number of water molecules per sulfonic acid group, λ, vs AO−H/AC−F.
2.7. Conclusions
A new experimental apparatus was developed for measuring the water distribution inside the PEM during cell operation with high time resolution. The CARS spectroscopy system consists of two systems: the optical system and the fuel cell evaluation system. The developed CARS cell has an optical window with borosilicate glass on the cathode side end plate, a pinhole of 0.5 mm diameter in the middle of the cathode side GDE, and a Pt foil reflective layer on the opposite side of the pinhole across the PEM to irradiate laser light and collect CARS light effectively. In order to ensure the accuracy of the spectral information, non-resonant background removal using the modified Kremers-Kronig transformation was applied, confirming that a linear increase in the number of water molecules inside the membrane due to increased relative humidity could be measured. These newly developed systems allowed to elucidate the water behavior inside the PEM during the cell operation.
The experimental results obtained by the CARS spectroscopic measurements in steady-state cell operation are described in Chapter 3 and those in transient states of cell operation in Chapter 4.
2.8. References
[1] A. Syouji, M. Sakai, M. Hara, H. Matsushima, Drying process of water in a Nafion membrane embedded in the fuel cell analyzed by coherent anti-Stokes Raman scattering spectroscopy. Jpn. J. Appl. Phys. 2018, 57, 117101.
[2] H. Kano, H. Hamaguchi, Ultrabroadband (>2500cm−1) multiplex coherent anti-Stokes Raman scattering microspectroscopy using a supercontinuum generated from a photonic crystal fiber. Appl. Phys. Lett. 2005, 86, 121113.
[3] T.W. Kee, M.T. Cicerone, Simple approach to one-laser, broadband coherent anti-Stokes Raman scattering microscopy. Opt. Lett. 2004, 29, 2701-2703.
[4] E.R. Andresen, H.N. Paulsen, V. Birkedal, J. Thogersen, S.R. Keiding, Broadband multiplex coherent anti-Stokes Raman scattering microscopy employing photonic-crystal fibers. J. Opt. Soc. Am. B: Opt. Phys. 2005, 22, 1934-1938. [5] S.B. Pilkington, S.D. Roberson, P.M. Pellegrino, Multiplex coherent anti-Stokes
Raman scattering spectroscopy for trace chemical detection. Applied Optics 2017, 56, B159.
[6] J.X. Cheng, A. Volkmer, L.D. Book, X.S. Xie, Multiplex coherent anti-stokes Raman scattering microspectroscopy and study of lipid vesicles. J. Phys. Chem.
[7] E.T. Garbacik, J.P. Korterik, C. Otto, S. Mukamel, J.L. Herek, H.L. Offerhaus, Background-free nonlinear microspectroscopy with vibrational molecular interferometry. Phys. Rev. Lett. 2011, 107, 253902.
[8] B.R. Bachler, M.E. Fermann, J.P. Ogilvie, Multiplex Raman induced Kerr effect microscopy. Opt. Express 2012, 20, 835-844.
[9] V. Kumar, R. Osellame, R. Ramponi, G. Cerullo, M. Marangoni, Background-free broadband CARS spectroscopy from a 1-MHz ytterbium laser. Opt. Express 2011, 19, 15143-15148.
[10] A.C.W. van Rhijn, M. Jurna, A. Jafarpour, J.L. Herek, H.L. Offerhaus, Phase-shaping strategies for coherent anti-Stokes Raman scattering. J. Raman Spectrosc. 2011, 42, 1859-1863.
[11] F. Gao, F. Shuang, J. Shi, H. Rabitz, H. Wang, J.X. Cheng, Optimal coherent control of coherent anti-Stokes Raman scattering: signal enhancement and background elimination. J. Chem. Phys. 2012, 136, 144114.
[12] Y. Liu, Y.J. Lee, M.T. Cicerone, Broadband CARS spectral phase retrieval using a time-domain Kramers-Kronig transform. Opt. Lett. 2009, 34, 1363-1365.
[13] X. Ling, M. Bonn, S.H. Parekh, K.F. Domke, Nanoscale distribution of sulfonic acid groups determines structure and binding of water in Nafion membranes. Angew. Chem. Int. Ed. 2016, 55, 4011-4015.
[14] W.M. Tolles, J.W. Nibler, J.R. McDonald, A.B. Harvey, A Review of the Theory and Application of Coherent Anti-Stokes Raman Spectroscopy (CARS). Appl. Spectrosc. 1977, 31, 253-271.
[15] H.A. Rinia, M. Bonn, M. Müller, Quantitative multiplex CARS spectroscopy in congested spectral regions. J. Phys. Chem. B 2006, 110, 4472-4479.
[16] K.-E. Peiponen, V. Lucarini, J.J. Saarinen, E. Vartiainen, Kramers–Kronig relations and sum rules in nonlinear optical spectroscopy. Appl. Spectrosc. 2004, 58, 499-509.
[17] S.H. Lim, A.G. Caster, S.R. Leone, Fourier transform spectral interferometric coherent anti-Stokes Raman scattering (FTSI-CARS) spectroscopy. Opt. Lett. 2007, 32, 1332-1334.
[18] A. Gruger, A. Régis, T. Schmatko, P. Colomban, Nanostructure of Nafion® membranes at different states of hydration: An IR and Raman study. Vib. Spectrosc. 2001, 26, 215-225.
[19] L.G. Lage, P.G. Delgado, Y. Kawano, Vibrational and thermal characterization of Nafion® membranes substituted by alkaline earth cations. Eur. Polym. J. 2004, 40, 1309-1316.
[20] A. Ohma, S. Yamamoto, K. Shinohara, Membrane degradation mechanism during open-circuit voltage hold test. J. Power Sources 2008, 182, 39-47.
[21] M. Hara, J. Inukai, B. Bae, T. Hoshi, K. Miyatake, M. Uchida, H. Uchida, M. Watanabe, Micro-Raman study on water distribution inside a Nafion membrane during operation of polymer electrolyte fuel cell. Electrochim. Acta 2012, 82, 277-283.
Chapter 3
Water distribution and its chemical states in steady state
inside the PEM during cell operation
3.1. Introduction
As mentioned in Chapter 1, the water transport behavior inside the PEM is one of the most important parameters for improving PEMFC performance. Thus, the water inside the PEM has been studied by various methods [1-10]. However, with the conventional measurement methods, it was difficult to measure the distribution of water that changes every moment from the viewpoint of time resolution. CARS spectroscopy, which enables measurement with high time resolution, as described in Chapter 2, was applied to the measurement of water distribution in the PEM, and the water distribution inside the PEM in the steady state during cell operation was measured.
The chemical state of the water inside the PEM is also an important parameter. The state of water has been analyzed by deconvolution of the O−H stretching region in the vibrational spectrum [11-13], but all of these results have left doubts. In addition, the state of water inside the PEM in the fuel cell that is actually operating has not been analyzed
In this chapter, first, water distribution measurement inside the PEM under humidified conditions was performed, and a new deconvolution model for the O−H stretching vibration region was proposed. Then, the water distribution and its chemical states during steady-state cell operation (0.1, 0.5 and 1.0 A cm−2) were elucidated.
3.2. Experimental setup
The instrumental setup of the CARS spectroscopy and the fuel cell were described in Chapter 2. The CARS measurements were carried out at 80 ºC, either under a N2 atmosphere without power generation or under fuel cell operating conditions with H2 and O2. Humidified N2 was supplied to both the anode and the cathode at 100 mL min−1 before the cell operation. During operation, 80% RH humidified H2 and O2 were supplied to the anode and cathode, respectively, both at a flow rate of 500 mL min−1 under atmospheric pressure. The current densities during cell operation were set at 0.1, 0.5, and 1.0 A cm−2. The PEMFC was operated at least 3 hours under each condition. Both the laser powers of ω1 and ω2 were set at 40 mW. Data acquisition time was set to 1.0 s (10 × 0.1 s exposure). Each CARS spectrum was converted into a Raman-like spectrum using a modified Kramers-Kronig phase retrieval transform after the spectrum obtained by irradiating the two lasers to the glass window was eliminated as the non-resonant background, as described in Chapter 2. The number of water molecules per sulfonic acid group, λ, was determined by the calibration curve shown in Figure 2-9. The spectral deconvolution was performed using commercial software (Igor Pro 8, WaveMetrics). The spectra were smoothed with a Savitzky−Golay function (polynomial = 2; points = 31). In the initial
deconvoluted. Three parameters (peak position, height, full width at half maximum) of each component band were varied, except for the peak shape fixed to that of the Gaussian function. For the deconvolution of all successive data, the height and full width at half maximum were allowed to vary, whereas the peak position was fixed.
Prior to measurement, the effective film thickness was measured. The cell was kept at 80 ºC and 60% RH. The focal point of the laser was irradiated sufficiently above the PEM, and a spectrum was acquired with an exposure time of 1.0 s. The non-resonant background was removed from the obtained spectrum, and the peak area of the O−H stretching vibration region was determined. The focal position was moved to the anode side by 0.5 μm, and the same operation was repeated until the ν(O−H) peak was no longer measurable. A profile of AO−H in the through-plane direction was created (Figure 3-1). The position where AO−H started to increase significantly was set to 0 μm. As seen in Figure 3-1, AO−H was measured to approximately 20 μm. The thicknesses were approximately 21.5, 22.5, and 23.5 μm at 0.1, 0.5, 1.0 A cm-2, respectively. This result suggests that the thickness of the PEM was about 20 μm. The nominal thickness of the PEM used for the measurement was 25 μm, but it seems to have shrunk during hot pressing when the MEA was created or when the fuel cell was tightened up. In this study,
the water distributions at a position up to 20 μm from the cathode surface of the membrane were measured.
Figure 3- 1 Depth profile of AO-H in Nafion membrane at 80 ºC and 60% RH under N2 flow.
3.3. Results and discussion
3.3.1 Water distribution in hydrated PEM
Figure 3-2 shows the depth profiles of λ values at various relative humidities. As seen in Figure 3-2, the value of λ was constant, regardless of the measurement position at any relative humidity, reflected by the uniform water distribution inside the PEM under the humidified N2 atmosphere, and the lambda values increased as the relative humidity increased.
λ (N ub ne r of w at er m ol ec ul es p er su lfo ni c ac id g ro u p)
Figure 3- 2 Depth profiles of λ in Nafion membrane at 80 ºC and at 40, 60 and 80% RH.
3.3.2. Chemical state of water inside the PEM
Because the state of water is an important factor in the proton conduction of PEM, the chemical states of water molecules in PEMs have been exclusively studied; water molecules in a PEM were found to form various states of hydrogen bonds. Lu et al. performed a dielectric-relaxation spectroscopic study on a Nafion membrane at various hydration levels [14]. It was revealed that at least three states of water exhibited distinct dynamics inside the membrane. Lapora et al. investigated the states of water in a Nafion membrane with differential scanning calorimetry (DSC), thermal gravimetric analysis, and FTIR to inform the molecular interactions [15]. They assigned the peak around 2900 cm−1 in the FTIR spectra as H3O+. Ping et al. carried out DSC and FTIR studies on hydrophilic polymers, which showed water molecules with two types of hydrogen bonds in a hydrophilic-polymer matrix: the hydrogen bond forming the first layer of water attached to the active sites of the polymer and the hydrogen bond forming the second layer of water [16].
In recent years, the peak assigned to the O−H stretching mode (4000~2500 cm−1) obtained by vibrational spectroscopies has been deconvoluted into Gaussian peaks [11-13], in spite of the intrinsic difficulty of the accurate representation of the O−H stretching band in Gaussians due to the complex interactions of the hydronium ions with other
molecules [17, 18]. However, fitting the O−H stretching vibrations with Gaussian peaks is currently the most promising way to analyze the states of water molecules. Several research groups proposed to deconvolute the O−H stretching peak into four Gaussian peaks: protonated water involving hydrated protons (3000 cm−1) [11-13, 15, 17, 19-22], water hydrogen-bonded (H-bonded) attached to the sulfonic acid group (3250 cm−1) [11-13, 15, 16, 23, 24], water H-bonded to other water molecules (3450 cm−1) [11-13, 16, 23, 24], and non-H-bonded water (3500 cm−1) [1, 11-13].
Hofmann et al. investigated the structure of water in Nafion membranes by infrared spectroscopy and with a molecular dynamics simulation; the water molecules were distinguished either on the “surface” or in the “cavities” of the pores of a Nafion membrane [11]. Ferrari et al. reported the water distribution in an Aquivion® membrane utilizing attenuated total reflection Fourier transform infrared (ATR-FTIR) spectroscopy at the temperature of 35 °C and the RH values in the range of 0~50%. By the deconvolution of the O−H stretching region, four different types of water species were identified [12], as had been the case for Nafion [11]. Barique et al. investigated an NR-212 Nafion membrane at elevated temperatures of 60~100 °C and RHs of 0~95% by the peak deconvolution of the O−H stretching and bending (1500 ~ 2000 cm−1) bands of
simulation [13]. They reported that, with increasing RH, the amount of H-bonded water increased, whereas that of non-bonded water was nearly unchanged, and that the H-bonded water had a prominent contribution to the increase of the proton conductivity [11]. With those previous vibrational studies, the analytical processes of the chemical states of water in PEMs have moved forward. In spite of this progress, we found a common, serious problem, the non-neutrality of electronic charge inside the PEM. In order to satisfy the neutrality requirement, the number of protonated water molecules inside the membrane must be equal to the number of sulfonic acid groups. We calculated the ratios of the number of protons to that of sulfonic acid groups according to the reported values [11-13], finding values ranging between 0.43 and 3.48, i.e., not always unity.
In this study, a new peak deconvolution procedure is proposed via the treatment of both Eigen and Zundel cations in the deconvolution, which has solved the problem of the uneven electronic charge between protons and sulfonated groups in a Nafion membrane. Now, the number of protonated water molecules was unchanged, regardless of the RH and current density.
Figure 3-3 shows the deconvolution of the O−H stretching region at 80 ºC and 80% RH. We deconvoluted the O−H stretching region into five peaks, while other researchers have used four [11-13]. The peak located at 3371 cm−1 was newly considered in the peak