Effects of labor standard on trade : evidence
from U.S. imports of coffee and tobacco
著者
Hayakawa Kazunobu
権利
Copyrights 日本貿易振興機構(ジェトロ)アジア
経済研究所 / Institute of Developing
Economies, Japan External Trade Organization
(IDE-JETRO) http://www.ide.go.jp
journal or
publication title
IDE Discussion Paper
volume
669
year
2017-05
INSTITUTE OF DEVELOPING ECONOMIES
IDE Discussion Papers are preliminary materials circulated to stimulate discussions and critical comments
Keywords: Gravity; CSR; U.S. JEL classification: F15; F53
* Overseas Research Fellow, Research Planning Department, IDE ([email protected])
IDE DISCUSSION PAPER No. 669
Effects of Labor Standard on Trade:
Evidence from U.S. Imports of
Coffee and Tobacco
Kazunobu HAYAKAWA*
May 2017
Abstract
This paper empirically investigates whether countries included in the “List of Goods Produced by Child Labor or Forced Labor” by the U.S. government reduce their exports to the U.S. To this end, we estimated gravity equations for trade in coffee and tobacco during 2005–2014. In contrast to previous studies in this literature, our paper controls for a “supply-side” mechanism (e.g., change in the amount of unskilled labor) by introducing exporter-year fixed effects. Furthermore, we controlled for time-invariant country-pair specific elements such as U.S. consumers’ aversion to products from a specific country. Our results yielded a robust result that countries in the list do not change the magnitude of their exports to the U.S. Several interpretations are presented.
The Institute of Developing Economies (IDE) is a semigovernmental, nonpartisan, nonprofit research institute, founded in 1958. The Institute merged with the Japan External Trade Organization (JETRO) on July 1, 1998.
The Institute conducts basic and comprehensive studies on economic and related affairs in all developing countries and regions, including Asia, the Middle East, Africa, Latin America, Oceania, and Eastern Europe.
The views expressed in this publication are those of the author(s). Publication does not imply endorsement by the Institute of Developing Economies of any of the views expressed within.
INSTITUTE OF DEVELOPING ECONOMIES (IDE), JETRO 3-2-2, WAKABA,MIHAMA-KU,CHIBA-SHI
CHIBA 261-8545, JAPAN
©2017 by Institute of Developing Economies, JETRO
No part of this publication may be reproduced without the prior permission of the IDE-JETRO.
1
Effects of Labor Standard on Trade: Evidence from
U.S. Imports of Coffee and Tobacco
Kazunobu HAYAKAWA#§
Inter-disciplinary Studies Center, Institute of Developing Economies, Japan
Abstract: This paper empirically investigates whether countries included in the “List of Goods
Produced by Child Labor or Forced Labor” by the U.S. government reduce their exports to the U.S. To this end, we estimated gravity equations for trade in coffee and tobacco during 2005–2014. In contrast to previous studies in this literature, our paper controls for a “supply-side” mechanism (e.g., change in the amount of unskilled labor) by introducing exporter-year fixed effects. Furthermore, we controlled for time-invariant country-pair specific elements such as U.S. consumers’ aversion to products from a specific country. Our results yielded a robust result that countries in the list do not change the magnitude of their exports to the U.S. Several interpretations are presented.
Keywords: Gravity; CSR; U.S. JEL Classification: F15; F53
1. Introduction
The issue of labor rights is increasingly salient in international trade. The U.S. publicizes a list of goods produced using child labor or forced labor and their source countries in violation of international standards, as required under the Trafficking Victims Protection Reauthorization Act (TVPRA) of 2005 and subsequent reauthorizations. This list (called the List hereafter) is available on the Department of Labor (DOL) website. The labor chapter of Trans-Pacific Partnership requests that each member country must adopt and maintain statutes and regulations intended to eliminate all forms of forced or compulsory labor. In addition, the European Union differentiates between the Generalised Scheme of Preferences (GSP) and “GSP+.” The latter provides full removal of tariffs on essentially the same product categories as those covered by the
# Author: Kazunobu Hayakawa; Address: Wakaba 3-2-2, Mihama-ku, Chiba-shi, Chiba, 261-8545, Japan. Tel: 81-43-299-9500; Fax: 81-43-299-9724; E-mail: [email protected]. § I would like to thank Kohei Shiino for his helpful comments. All remaining errors are mine.
2
GSP. However, this is only granted to countries that ratify and implement core international conventions relating to human and labor rights, the environment, and good governance.
How important is it to consider labor rights? It is obvious in the case of GSP+ because of the aforementioned difference in preferences between GSP and GSP+. However, it might be unclear in the case of the List in the U.S. As of September 30, 2016, the List comprises 139 goods from 75 countries. The U.S. government claims that the List is not intended to be punitive but to raise public awareness about forced and child labor worldwide and promote efforts to combat them. Therefore, if U.S. consumers do not differentiate between commodities produced by firms who do and do not comply with the labor standards, U.S. imports of products in the List will not change. Therefore, consumers’ valuations of firms’ labor standard compliance, the role of which is examined by Manasakis et al. (2015), plays a crucial role in understanding the impact of the List.
This paper empirically investigates whether inclusion in the List results in reduced exports to the U.S. To this end, we estimated gravity equations for trade in coffee and tobacco during 2005–2014. This equation includes a time-variant dummy variable that takes the value 1 when the U.S. imports from countries included in the List (called “Listed Dummy”). There are three main reasons for our choice of coffee and tobacco. First, a relatively large number of countries are included in the List for these products. Second, it is relatively easy to identify commodity codes of these products in trade data. Third, these products have been targeted since the first version of the List (i.e., longest sample period). In this estimation, we introduced exporter-year, importer-year, and country-pair fixed effects to control for various key elements. The results indicated that the coefficient for the Listed Dummy variable is insignificant.
There are several possible interpretations of our insignificant result regarding the Listed Dummy variable. It could imply that consumers’ valuation of producers’ labor standard compliance is negligible even in one of the most developed countries, the U.S. Other interpretations include that exports from violating firms occupy an insignificant fraction of a concerned product’s total exports to the U.S. Furthermore, although consumers might be able to easily identify good firms’ commodities through the advertisement of labor standards compliance on product packaging, they may not be able to identify bad firms’ commodities because the latter will not advertise their failure to comply with these standards. Consequently, U.S. consumers will not reduce the consumption of products in the List.
3
effects of labor standards on trade (e.g., Busse, 2002; Hasnat, 2002; Dehejia and Samy, 2004; Siroen, 2012). The typical measure of labor standard compliance is the number of International Labour Office conventions ratified by the concerned country. This literature emphasizes changes in comparative advantage. Countries violating labor standards are expected to increase their relative endowment in unskilled labor and exports of labor-intensive goods. Overall, the literature does not succeed in finding a clear and significant relation between labor standards and trade (see Salem and Rozental, 2012). In contrast, our paper controls for such “supply-side” mechanisms by introducing exporter-year fixed effects. By doing so, this paper elucidates “demand-side” mechanisms, including consumers’ valuation of producers’ labor standard compliance.
The second strand of literature includes studies on consumers’ valuation of firms’ corporate social responsibility (CSR) activities (e.g., Hiscox and Smyth, 2012; Elfenbein and McManus, 2010). CSR activities can take the form of voluntary investments in production technologies and business processes along the value chain, beyond the legal requirements, in favor of firms’ stakeholders (Porter and Kramer, 2006). These studies have empirically shown that consumers positively value firms’ CSR activities or pay more for products that generate charitable donations when such activities or donations can be explicitly identified in products.1 As mentioned above, our
estimates on the Listed Dummy variable are also related to consumers’ valuation of firms’ CSR activities. In contrast to previous studies, however, this paper investigates the effects of a negative campaign rather than those of a positivecampaign.
The rest of this paper is organized as follows. The next section specifies our empirical framework to investigate whether countries included in the List reduce exports to the U.S. Section 3 reports the estimation results. Section 4 concludes this paper.
2. Empirical Framework
This section specifies the empirical framework used in this paper. The List has been publicized since 2009 and is updated every year.2 In 2005, the U.S. Congress
passed the TVPRA, thereby directing the Secretary of Labor and DOL’s Bureau of International Labor Affairs (ILAB) to compile “a list of goods that ILAB has reason to
1 For more details on the studies on CSR, see, for example, Benabou and Tirole (2010) and Kitzmueller and Shimshack (2011).
2 The following two paragraphs are drawn from the full reports on “List of Goods Produced by Child Labor or Forced Labor” for 2008 and 2016 by Bureau of International Labor Affairs, United States DOL. For more details, see https://www.dol.gov/ilab/reports/child-labor/list-of-goods/.
4
believe were produced using forced labor or child labor.” Under international standards, child labor refers to all work performed by a person below the age of 15. It also includes work performed by a person below the age of 18 in some specific practices. In addition, forced labor under international standards includes all work or service exacted from any person under threat of any penalty for its nonperformance and for which the worker does not offer himself voluntarily; this includes indentured labor. The primary purposes of the List are to raise public awareness about the incidence of child labor and forced labor in the production of goods in the listed countries and to promote efforts to eliminate such practices.
Pursuant to this mandate, ILAB conducted an in-depth review of the available information on exploitive working conditions. In evaluating the uncovered information, multiple criteria (including the nature, source, and date of information; extent of corroboration; and significant incidence) have been used to determine whether a good should be placed in the List. Consequently, the 2009 List included 122 goods produced with forced labor, child labor, or both in 58 countries worldwide. The List has been updated every year by adding new countries/products and/or removing existing countries/products. For example, the 2016 List included 139 goods from 75 countries. Importantly, a country’s absence from the TVPRA List does not necessarily indicate that child labor and/or forced labor are not occurring in the production of goods in that country. It simply indicates that data are unavailable for various reasons, including research and policy considerations.
We introduced the Listed Dummy variable constructed using the List into a gravity equation. As mentioned in the introductory section, the Listed Dummy variable takes the value 1 when the U.S. imports products from countries included in the List. We focused on two products, namely coffee and tobacco, for the aforementioned three reasons (i.e., relatively large number of countries listed, relatively easy identification of commodity codes in trade data, and the fact of being targeted from the beginning). Since our trade data included bilateral trade values among 174 countries3 during 2005–2014,
we used the Lists covering 2009–2014. When constructing the Listed Dummy variable, we did not differentiate between child labor and forced labor because all countries listed under forced labor were also listed under child labor in the cases of coffee and tobacco. Furthermore, in these cases, few countries were listed under forced labor. For example, in the 2013 List, only Cote d’Ivoire was listed under forced labor. Thus, our dummy variable mainly captures whether a country is listed under child labor.
3 See Appendix for our sample countries.
5
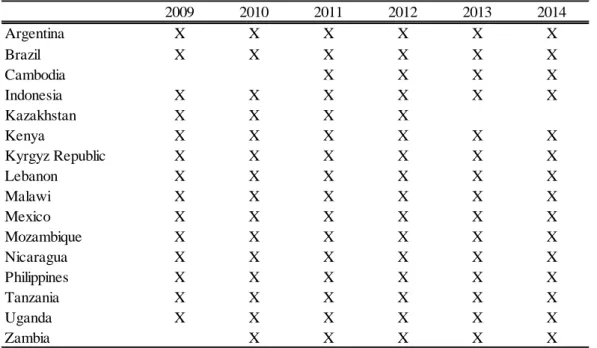
Countries included in the List for coffee and tobacco are reported in tables 1 and 2, respectively. A total of 14 countries are listed for coffee, whereas the List for tobacco includes 16 countries. Few changes were observed in the countries in the List over time. For coffee, El Salvador and Sierra Leone were first included in 2010 and 2012, respectively. The List for tobacco included Cambodia in 2011 and Zambia in 2010. Another interesting observation is that Kazakhstan was listed from 2009 to 2012 but was excluded in 2013. These changes in countries listed were based on the aforementioned updated information. In addition, the inclusion of new countries in the List is partly due to the aforementioned fact that countries excluded from the List do not necessarily comply with labor standards. These patterns of listed countries make our identification on the effects of being listed on trade better, i.e., weaken the endogeneity of the Listed Dummy variable in our empirical analysis.
=== Tables 1 and 2 ===
A gravity equation can be supported by various theoretical models. In particular, under an assumption of separable preferences, separable technologies, goods differentiated by country of origin, and symmetric trade costs, Anderson and van Wincoop (2003) derived the following gravity equation:
ln 𝑥𝑥𝑖𝑖𝑖𝑖𝑖𝑖 = ln 𝑦𝑦𝑖𝑖𝑊𝑊+ ln 𝑦𝑦𝑖𝑖𝑖𝑖 + ln 𝑦𝑦𝑖𝑖𝑖𝑖+ (1 − 𝜎𝜎) ln 𝜏𝜏𝑖𝑖𝑖𝑖𝑖𝑖+ (1 − 𝜎𝜎) ln Π𝑖𝑖𝑖𝑖+ (1 − 𝜎𝜎) ln 𝑃𝑃𝑖𝑖𝑖𝑖
where xijt, yit, τijt, and ytW are exports from countries i to j, total income of country i,
iceberg trade costs from countries i to j, and world nominal income in year t, respectively; σ denotes the elasticity of substitution among varieties; and Π and P are price indices called “multilateral resistance” terms. Following Feenstra (2002), we controlled for total incomes and price indices by importer-year fixed effects (ujt) and
exporter-year fixed effects (uit). Therefore, this equation can be rewritten as follows:
ln 𝑥𝑥𝑖𝑖𝑖𝑖𝑖𝑖 = (1 − 𝜎𝜎) ln 𝜏𝜏𝑖𝑖𝑖𝑖𝑖𝑖+ u𝑖𝑖𝑖𝑖
+ u𝑖𝑖𝑖𝑖. (1)
Trade costs are modeled as follows:
ln 𝜏𝜏𝑖𝑖𝑖𝑖 = 𝜌𝜌1𝐿𝐿𝐿𝐿𝐿𝐿𝐿𝐿𝐿𝐿𝐿𝐿 𝐷𝐷𝐷𝐷𝐷𝐷𝐷𝐷𝑦𝑦𝑖𝑖𝑖𝑖𝑖𝑖+ 𝜌𝜌2ln�1 + 𝑇𝑇𝑇𝑇𝑇𝑇𝐿𝐿𝑇𝑇𝑇𝑇𝑖𝑖𝑖𝑖𝑖𝑖� + 𝜌𝜌3𝑅𝑅𝑇𝑇𝑅𝑅𝑖𝑖𝑖𝑖𝑖𝑖+ 𝜌𝜌4ln 𝐷𝐷𝐿𝐿𝐿𝐿𝐿𝐿𝑖𝑖𝑖𝑖
+ 𝜌𝜌5𝐵𝐵𝐵𝐵𝑇𝑇𝐿𝐿𝐿𝐿𝑇𝑇𝑖𝑖𝑖𝑖+ 𝜌𝜌6𝐿𝐿𝑇𝑇𝐿𝐿𝐿𝐿𝐷𝐷𝑇𝑇𝐿𝐿𝐿𝐿𝑖𝑖𝑖𝑖 + 𝜌𝜌7𝐶𝐶𝐵𝐵𝐶𝐶𝐵𝐵𝐿𝐿𝑦𝑦𝑖𝑖𝑖𝑖
+ 𝜀𝜀𝑖𝑖𝑖𝑖𝑖𝑖. (2)
where Tariffijt denotes tariff rates when exporting from countries i to j in year t; RTA is a
dummy variable taking the value 1 if two countries are members of the same regional trade agreements (RTAs) and 0 otherwise; Dist is the geographical distance between country i and country j; Border takes the value 1 if two countries share a national border
6
and takes 0 otherwise; Language is a dummy variable taking the value 1 if a language is spoken by at least 9% of the population in both countries and takes 0 otherwise; and
Colony takes the value 1 if two countries had colonial relationship in the past and takes
0 otherwise; 𝜀𝜀𝑖𝑖𝑖𝑖𝑖𝑖 is an error term. Substituting Eq. (2) into Eq. (1), we obtain the following:
ln 𝑥𝑥𝑖𝑖𝑖𝑖𝑖𝑖 = 𝛽𝛽1𝐿𝐿𝐿𝐿𝐿𝐿𝐿𝐿𝐿𝐿𝐿𝐿 𝐷𝐷𝐷𝐷𝐷𝐷𝐷𝐷𝑦𝑦𝑖𝑖𝑖𝑖𝑖𝑖 + 𝛽𝛽2ln�1 + 𝑇𝑇𝑇𝑇𝑇𝑇𝐿𝐿𝑇𝑇𝑇𝑇𝑖𝑖𝑖𝑖𝑖𝑖� + 𝛽𝛽3𝑅𝑅𝑇𝑇𝑅𝑅𝑖𝑖𝑖𝑖𝑖𝑖+ 𝛽𝛽4ln 𝐷𝐷𝐿𝐿𝐿𝐿𝐿𝐿𝑖𝑖𝑖𝑖
+ 𝛽𝛽5𝐵𝐵𝐵𝐵𝑇𝑇𝐿𝐿𝐿𝐿𝑇𝑇𝑖𝑖𝑖𝑖 + 𝛽𝛽6𝐿𝐿𝑇𝑇𝐿𝐿𝐿𝐿𝐷𝐷𝑇𝑇𝐿𝐿𝐿𝐿𝑖𝑖𝑖𝑖+ 𝛽𝛽7𝐶𝐶𝐵𝐵𝐶𝐶𝐵𝐵𝐿𝐿𝑦𝑦𝑖𝑖𝑖𝑖 + u𝑖𝑖𝑖𝑖+ u𝑖𝑖𝑖𝑖
+ 𝜖𝜖𝑖𝑖𝑖𝑖𝑖𝑖, (3)
where 𝛽𝛽𝑘𝑘 = (1 − 𝜎𝜎)𝜌𝜌𝑘𝑘 and 𝜖𝜖𝑖𝑖𝑖𝑖𝑖𝑖 = (1 − 𝜎𝜎)𝜀𝜀𝑖𝑖𝑖𝑖𝑖𝑖. We estimated this equation for trade in coffee and tobacco separately using the OLS method.
Our data sources are as follows. The data on trade values were obtained from the UN Comtrade database. This paper specifies Harmonized System (HS) codes for coffee and tobacco as “0901” and “24,” respectively. We constructed our tariff variables in the following manner. First, tariff line-level data on tariff rates were obtained from the World Integrated Trade Solution database.4 Second, at a tariff-line level, we identified
the lowest tariff rates among all schemes available for each country pair. This means that our tariff rates are applied rates. Third, tariff rates at the tariff-line level were converted to those at the 1988 HS six-digit level using the conversion table available on the United Nations Statistics Division website. We applied the simple average for this aggregation. Finally, we computed the simple average of tariff rates among HS six-digit level products in the 0901 or 24 categories. We did not use the weighted average of tariff rates to avoid a systematic association between trade values and tariff rates. Next, we constructed an RTA variable using the “Regional Trade Agreements Information System” to obtain the RTA member list.5 The source for Dist, Border, Language, and Colony is the CEPII website.
Notably, our fixed effects controlled for not only multilateral resistance terms and income levels but also another element indicated in the literature on the effects of labor standards on trade. Previous studies have relied on changes in comparative advantages when considering those effects. Namely, the utilization of child/forced labor increases the amount of labor and strengthens a country’s comparative advantages in labor-intensive products. Furthermore, a country’s inclusion in the List may improve its labor standard compliance and production efficiency by, for example, enhancing labors’ motivation. This effect is also controlled for by our exporter-year fixed effects. Consequently, the coefficient for the Listed Dummy indicates U.S.-export
4 http://wits.worldbank.org/WITS/
7
country-specific effects, such as U.S. consumers’ valuation of the product exported from a listed country.6
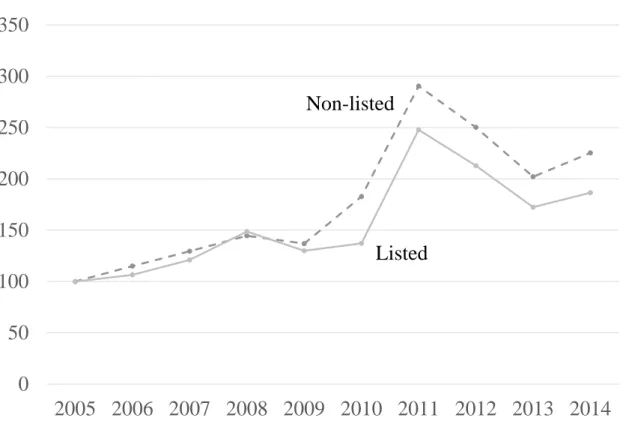
Before reporting our estimation results, we provided a brief overview of the transition of exports to the U.S., which are depicted for coffee in Figure 1 and for tobacco in Figure 2. In these figures, we restricted sample export countries only to those with positive exports to the U.S. in all sample years. “Listed” includes countries in the List for at least one year during our sample period although the List starts in 2009. The remaining countries are included in the “Not-listed” category. We first computed the average exports in each group and then depicted those by rescaling the average in 2005 as 100. In the case of coffee, we can clearly see the lower growth of exports from listed countries since 2009. In the case of tobacco, a clear change in the trend of exports before and after 2009 was not found. Rather, exports from listed countries grew faster than those from non-listed countries. This difference highlights our reasoning for not focusing only on a specific product in our analysis.
=== Figures 1 and 2 ===
3. Empirical Results
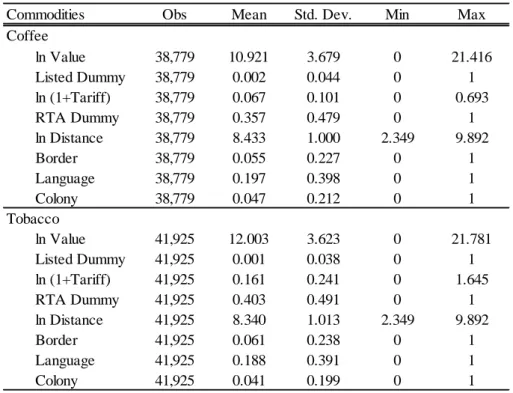
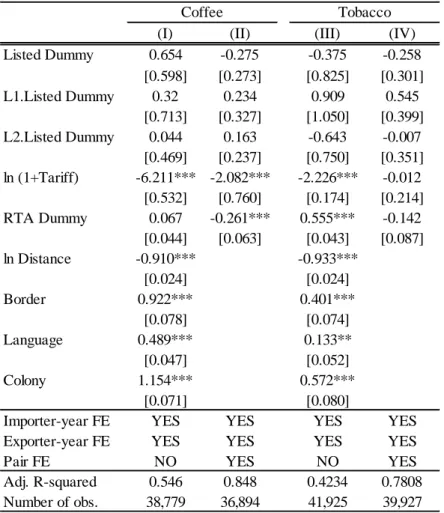
This section reports our estimation results. The basic statistics for our variables are provided in Table 3. Table 4 presents our baseline results. Columns (I) and (III) report the results for coffee and tobacco, respectively. As mentioned in the previous section, we controlled for exporter-year and importer-year fixed effects in this estimation. The number of observations varied between the cases of coffee and tobacco depending on the existence of country-pairs with zero-valued trade in each product. Contrary to our expectation, the coefficient for the Listed Dummy was estimated to be significantly positive for coffee, indicating that countries included in the List actually increased their exports to the U.S. Specifically, such exports increased by 158% [=100*exp(0.947)−1], which is a rather large positive effect. On the other hand, the coefficient for tobacco was negative but insignificant. In either case, we did not find
6 Another noteworthy point is that we restricted observations only to those with positive trade values. This treatment may induce sample selection biases. It is common in the gravity literature to address this issue by employing the Poisson pseudo-maximum likelihood estimation technique (Silva and Tenreyro, 2006) or the extended version of the Heckman two-step estimation (Helpman et al., 2008). However, we have a large number of sample countries, and our analysis is conducted at a commodity level. As a result, many observations with “zero” emerge when we utilize balanced panel data. Indeed, we were not able to obtain the convergence of log likelihood in such non-linear estimation techniques. Therefore, in this paper, we do not consider this issue.
8
negative effects on trade.
=== Tables 3 and 4 ===
Estimation results for the other variables are as follows. The coefficients for almost all other variables were estimated to be significant with expected signs. Exports of coffee and tobacco are larger when tariff rates are lower, geographical distance is smaller, countries share a national border boundary or language, or have a colonial relationship. The coefficient for the RTA dummy was estimated as positive for both coffee and tobacco but was significant only for coffee. As introduced by Cipollina and Salvatici (2010), the coefficient for RTA dummy variables is not always significant but is sometimes estimated as being significantly negative. Except for the RTA dummy and geographical distance, the absolute magnitude of the coefficients was larger in the case of coffee.
We conducted several robustness checks on these results. First, we introduced country-pair fixed effects, which controlled for time-invariant country-pair specific elements such as U.S. consumers’ aversion to products from a specific country. Indeed, if such elements are related to the selection of country-product pairs in the List, our estimates will suffer from endogeneity biases.7 The results are shown for coffee in
column (II) and for tobacco in column (IV). All time-invariant country-pair specific variables were dropped. The number of observations changed because singleton observations when controlling for pair fixed effects were further dropped. In the case of coffee, the coefficient for the Listed Dummy was found to be insignificant. Its coefficient for tobacco was again insignificant. Thus, when three types of fixed effects were controlled for, inclusion in the List did not change exports to the U.S. In addition, the tariff variable had an insignificant coefficient for tobacco. The RTA dummy coefficient was negatively significant for coffee and insignificant for tobacco.
Second, we examined the lagged effects on trade by introducing one-year and two-year lagged variables of the Listed Dummy. This estimation considers that consumers may know the country-product pairs in the List some months after its publication. These results are reported in Table 5. No coefficients for Listed Dummy-related variables were estimated as significant, implying no lagged effects on trade. The results for the other variables are qualitatively the same as those given in Table 4.
7 In addition, these effects play a role in addressing endogeneity issues in the RTA dummy variable, as suggested by Baier and Bergstrand (2007).
9
=== Table 5 ===
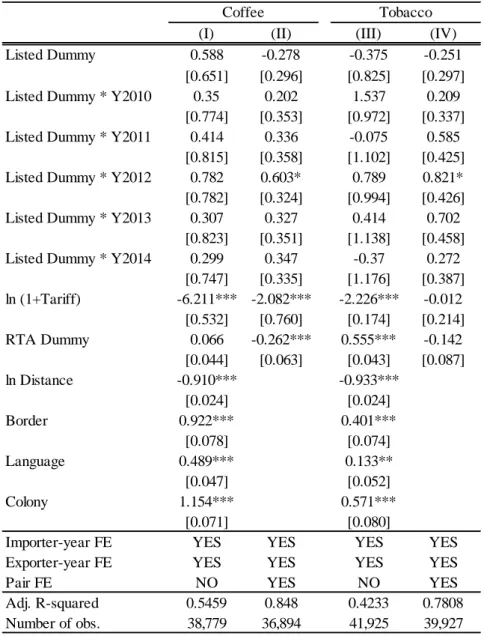
Finally, we introduced the interaction terms of the Listed Dummy with year dummy variables. This examination tests the expectation that consumers’ valuation of firms’ CSR activities rises over time. Since the Listed Dummy can take the value 1 after 2009, we introduced those with dummy variables indicating 2010, 2011, 2012, 2013, and 2014 (i.e., year 2009 as a basis). These results are reported in Table 6. Most interaction term coefficients were estimated as being insignificant. When controlling for country-pair fixed effects, the interaction term with the year dummy for 2012 had significantly positive coefficients for both coffee and tobacco. Although it is hard to interpret this result, positive coefficients are not consistent with our expectation. The results for other variables are again qualitatively the same as those presented in Table 4.
=== Table 6 ===
4. Concluding Remarks
This paper empirically investigated whether inclusion in the List reduces exports to the U.S. from listed countries. To this end, we estimated gravity equations for trade in coffee and tobacco during 2005–2014. In contrast to previous studies in this literature, our paper controlled for a “supply-side” mechanism (e.g., change in the amount of unskilled labor) by introducing exporter-year fixed effects. Furthermore, we controlled for time-invariant country-pair specific elements such as U.S. consumers’ aversion to products from a specific country. We obtained a robust result that listed countries do not change the magnitude of their exports to the U.S.
As mentioned in the introductory section, there are several possible interpretations of our insignificant result for the Listed Dummy variable. First, consumers’ valuation of firms’ compliance with labor standards may still be insignificant. However, this interpretation contradicts the empirical evidence on the recent growth of consumers’ awareness of CSR. Second, exports from violating firms may occupy an insignificant fraction of a concerned product’s total exports to the U.S. However, if the composition of export firms does not change much over time (at least during our sample period), our inclusion of country-pair fixed effects may rule out this interpretation. As a result, our third interpretation may be most realistic, namely that consumers may not be able to identify products produced by firms that do not comply
10
with labor standards and thus do not change their consumption of those products. In this sense, President Obama’s signing into law a provision banning the import of goods made by children and forced labor in February 2016 may be considered to be a more effective mechanism. Namely, it is much more effective to prevent the inflow of such goods at the customs stage, not at the final stage (i.e., consumers’ purchase).
References
Anderson, J.E. and van Wincoop, E., 2003, Gravity with Gravitas: A Solution to the Border Puzzle, American Economic Review, 93(1): 170-192.
Baier, S.L. and Bergstrand, J.H., 2007, Do Free Trade Agreements Actually Increase Members’ International Trade?, Journal of International Economics, 71(1), 72-95.
Becchetti, L., Di Giacomo, S., and Pinnacchio, D., 2005, Corporate Social Responsibility and Corporate Performance: Evidence from a Panel of US Listed Companies, CEIS Working Paper No. 78.
Benabou, R. and Tirole, J., 2010, Individual and Corporate Social Responsibility,
Economica, 77, 1-19.
Busse, M., 2002, Do Labor Standards Affect Comparative Advantage in Developing Countries?, World Development, 30(11), 1921-1932.
Cipollina, M. and Salvatici, L., 2010, Reciprocal Trade Agreements in Gravity Models: A Meta-Analysis, Review of International Economics, 18(1), 63-80.
Dehejia, V. and Samy, Y., 2004, Trade and Labour Standards: Theory and New Empirical Evidence, Journal of International Trade & Economic Development, 13(2), 179-198.
Elfenbein, D.W. and McManus, B., 2010, A Greater Price for a Greater Good? Evidence That Consumers Pay More for Charity-Linked Products, American Economic
Journal: Economic Policy, 2(2), 28-60.
Feenstra, R., 2002, Border Effects and the Gravity Equation: Consistent Methods for Estimation, Scottish Journal of Political Economy, 495: 491-506.
Hiscox, M.J. and Smyth, N.F., 2012, Is There Consumer Demand for Improved Labor Standards? Evidence from Field Experiments in Social Product Labeling, Mimeograph, Department of Government, Harvard University.
Kitzmueller, M. and Shimshack, J., 2011, Economic Perspectives on Corporate Social Responsibility, Journal of Economic Literature, 50(1), 51-84.
11
Manasakis, C., Mitrokostas, E., and Petrakis, E., 2015, Strategic Corporate Social Responsibility by Multinational Enterprises, Working Papers 1501, University of Crete, Department of Economics.
Hasnat, B., 2002, The Impact of Core Labour Standards on Exports, International
Business Review, 11(5), 563–575.
Helpman, E., Melitz, M., and Rubinstein, Y., 2008, Estimating Trade Flows: Trading Partners and Trading Volumes, Quarterly Journal of Economics, 123(2), 441-487. Salem, S. and Rozental, F., 2012, Labor Standards and Trade: A Revie of Recent
Empirical Evidence, Journal of International Commerce and Economics, Web Version: August 2012, 1-36.
Silva, S. and Tenreyro, S., 2006, The Log of Gravity, Review of Economics and
Statistics, 88(4): 641-658.
Siroen, J.M., 2012, Core Labour Standards and Exports, Université Paris-Dauphine, Working Paper No. 2012-18.
Porter, M.E., Kramer, M.R., 2006, Strategy and Society: The Link between Competitive Advantage and Corporate Social Responsibility, Harvard Business Review, 84, 76-92.
12
Table 1. Countries Included in the List: Coffee
2009 2010 2011 2012 2013 2014 Colombia X X X X X X Cote d'Ivoire X X X X X X Dominican Republic X X X X X X El Salvador X X X X X Guatemala X X X X X X Guinea X X X X X X Honduras X X X X X X Kenya X X X X X X Mexico X X X X X X Nicaragua X X X X X X Panama X X X X X X Sierra Leone X X X Tanzania X X X X X X Uganda X X X X X X
Source: Full reports on “List of Goods Produced by Child Labor or Forced Labor” for various years
(Bureau of International Labor Affairs, United States Department of Labor)
Table 2. Countries Included in the List: Tobacco
2009 2010 2011 2012 2013 2014 Argentina X X X X X X Brazil X X X X X X Cambodia X X X X Indonesia X X X X X X Kazakhstan X X X X Kenya X X X X X X Kyrgyz Republic X X X X X X Lebanon X X X X X X Malawi X X X X X X Mexico X X X X X X Mozambique X X X X X X Nicaragua X X X X X X Philippines X X X X X X Tanzania X X X X X X Uganda X X X X X X Zambia X X X X X
Source: Full reports on “List of Goods Produced by Child Labor or Forced Labor” for various years
13
Table 3. Basic Statistics
Commodities Obs Mean Std. Dev. Min Max Coffee ln Value 38,779 10.921 3.679 0 21.416 Listed Dummy 38,779 0.002 0.044 0 1 ln (1+Tariff) 38,779 0.067 0.101 0 0.693 RTA Dummy 38,779 0.357 0.479 0 1 ln Distance 38,779 8.433 1.000 2.349 9.892 Border 38,779 0.055 0.227 0 1 Language 38,779 0.197 0.398 0 1 Colony 38,779 0.047 0.212 0 1 Tobacco ln Value 41,925 12.003 3.623 0 21.781 Listed Dummy 41,925 0.001 0.038 0 1 ln (1+Tariff) 41,925 0.161 0.241 0 1.645 RTA Dummy 41,925 0.403 0.491 0 1 ln Distance 41,925 8.340 1.013 2.349 9.892 Border 41,925 0.061 0.238 0 1 Language 41,925 0.188 0.391 0 1 Colony 41,925 0.041 0.199 0 1
14
Table 4. Baseline Results
(I) (II) (III) (IV) Listed Dummy 0.947*** 0.023 -0.058 0.186 [0.203] [0.146] [0.310] [0.217] ln (1+Tariff) -6.211*** -2.084*** -2.226*** -0.01 [0.532] [0.760] [0.174] [0.214] RTA Dummy 0.067 -0.261*** 0.555*** -0.143 [0.044] [0.063] [0.043] [0.087] ln Distance -0.910*** -0.933*** [0.024] [0.024] Border 0.922*** 0.401*** [0.078] [0.074] Language 0.489*** 0.133** [0.047] [0.052] Colony 1.154*** 0.572*** [0.071] [0.080]
Importer-year FE YES YES YES YES Exporter-year FE YES YES YES YES
Pair FE NO YES NO YES
Adj. R-squared 0.546 0.848 0.4234 0.7808 Number of obs. 38,779 36,894 41,925 39,927
Coffee Tobacco
Notes: ***, **, and * represent significance at the 1%, 5%, and 10% statistical levels, respectively.
15
Table 5. Robustness Checks: Lagged Effects
(I) (II) (III) (IV) Listed Dummy 0.654 -0.275 -0.375 -0.258 [0.598] [0.273] [0.825] [0.301] L1.Listed Dummy 0.32 0.234 0.909 0.545 [0.713] [0.327] [1.050] [0.399] L2.Listed Dummy 0.044 0.163 -0.643 -0.007 [0.469] [0.237] [0.750] [0.351] ln (1+Tariff) -6.211*** -2.082*** -2.226*** -0.012 [0.532] [0.760] [0.174] [0.214] RTA Dummy 0.067 -0.261*** 0.555*** -0.142 [0.044] [0.063] [0.043] [0.087] ln Distance -0.910*** -0.933*** [0.024] [0.024] Border 0.922*** 0.401*** [0.078] [0.074] Language 0.489*** 0.133** [0.047] [0.052] Colony 1.154*** 0.572*** [0.071] [0.080]
Importer-year FE YES YES YES YES Exporter-year FE YES YES YES YES
Pair FE NO YES NO YES
Adj. R-squared 0.546 0.848 0.4234 0.7808 Number of obs. 38,779 36,894 41,925 39,927
Coffee Tobacco
Notes: ***, **, and * represent significance at the 1%, 5%, and 10% statistical levels, respectively.
Parentheses are the heteroscedasticity-consistent standard errors. “LX.Listed Dummy” indicates X-year lagged Listed Dummy variable.
16
Table 6. Robustness Checks: Effects by Year
(I) (II) (III) (IV) Listed Dummy 0.588 -0.278 -0.375 -0.251
[0.651] [0.296] [0.825] [0.297] Listed Dummy * Y2010 0.35 0.202 1.537 0.209
[0.774] [0.353] [0.972] [0.337] Listed Dummy * Y2011 0.414 0.336 -0.075 0.585
[0.815] [0.358] [1.102] [0.425] Listed Dummy * Y2012 0.782 0.603* 0.789 0.821* [0.782] [0.324] [0.994] [0.426] Listed Dummy * Y2013 0.307 0.327 0.414 0.702
[0.823] [0.351] [1.138] [0.458] Listed Dummy * Y2014 0.299 0.347 -0.37 0.272
[0.747] [0.335] [1.176] [0.387] ln (1+Tariff) -6.211*** -2.082*** -2.226*** -0.012 [0.532] [0.760] [0.174] [0.214] RTA Dummy 0.066 -0.262*** 0.555*** -0.142 [0.044] [0.063] [0.043] [0.087] ln Distance -0.910*** -0.933*** [0.024] [0.024] Border 0.922*** 0.401*** [0.078] [0.074] Language 0.489*** 0.133** [0.047] [0.052] Colony 1.154*** 0.571*** [0.071] [0.080]
Importer-year FE YES YES YES YES Exporter-year FE YES YES YES YES
Pair FE NO YES NO YES
Adj. R-squared 0.5459 0.848 0.4233 0.7808 Number of obs. 38,779 36,894 41,925 39,927
Coffee Tobacco
Notes: ***, **, and * represent significance at the 1%, 5%, and 10% statistical levels, respectively.
Parentheses are the heteroscedasticity-consistent standard errors. “YX” indicates the dummy variable taking the value 1 for year X and 0 otherwise.
17
Figure 1. Transition of Coffee Exports to the U.S. (2005=100)
Source: Author’s computation
Notes: We restricted sample export countries only to those with positive exports to the U.S. in all
sample years. “Listed” includes countries included in the List for at least one year during our sample period although the List starts in 2009. The rest are included in the “Not-listed” category. We first computed the average exports for each group and then depicted those by rescaling the average in 2005 as 100.
0
50
100
150
200
250
300
350
2005 2006 2007 2008 2009 2010 2011 2012 2013 2014
Listed
Non-listed
18
Figure 2. Transition of Tobacco Exports to the U.S. (2005=100)
Source: Author’s computation
Notes: We restricted sample export countries only to those with positive exports to the U.S. in all of
our sample years. “Listed” includes countries included in the List for at least one year during our sample period although the List starts in 2009. The rest are included in the “Not-listed” category. We first computed the average exports for each group and then depicted those by rescaling the average in 2005 as 100.
0
50
100
150
200
250
2005 2006 2007 2008 2009 2010 2011 2012 2013 2014
Non-listed
Listed
19
Appendix. Sample Countries (174)
Afghanistan; Albania; Algeria; Angola; Antigua and Barbuda; Argentina; Armenia; Australia; Austria; Azerbaijan; Bahrain; Bangladesh; Barbados; Belarus; Belgium; Belize; Benin; Bermuda; Bhutan; Bosnia Herzegovina; Botswana; Brazil; Brunei Darussalam; Bulgaria; Burkina Faso; Burundi; Cambodia; Cameroon; Canada; Central African Rep.; Chad; Chile; China; China, Hong Kong SAR; China, Macao SAR; Colombia; Comoros; Congo; Costa Rica; Croatia; Cuba; Cyprus; Cote d'Ivoire; Dem. Rep. of the Congo; Denmark; Djibouti; Dominica; Dominican Rep.; Ecuador; Egypt; El Salvador; Equatorial Guinea; Eritrea; Estonia; Ethiopia; Fiji; Finland; France; French Polynesia; Gabon; Gambia; Georgia; Germany; Ghana; Greece; Grenada; Guatemala; Guinea; Guinea-Bissau; Guyana; Haiti; Honduras; Hungary; Iceland; India; Indonesia; Iran; Ireland; Israel; Italy; Jamaica; Japan; Jordan; Kazakhstan; Kenya; Kuwait; Kyrgyzstan; Lao People's Dem. Rep.; Latvia; Lebanon; Lesotho; Libya; Lithuania; Luxembourg; Madagascar; Malawi; Malaysia; Maldives; Mali; Malta; Mauritania; Mauritius; Mexico; Mongolia; Montserrat; Morocco; Mozambique; Myanmar; Namibia; Nepal; Netherlands; New Zealand; Nicaragua; Niger; Nigeria; Norway; Oman; Pakistan; Palau; Panama; Papua New Guinea; Paraguay; Peru; Philippines; Poland; Portugal; Qatar; Rep. of Korea; Rep. of Moldova; Romania; Russian Federation; Rwanda; Saint Kitts and Nevis; Saint Lucia; Saint Vincent and the Grenadines; Saudi Arabia; Senegal; Seychelles; Singapore; Slovakia; Slovenia; Solomon Isds; South Africa; Spain; Sri Lanka; Sudan; Suriname; Swaziland; Sweden; Switzerland; Syria; Tajikistan; TFYR of Macedonia; Thailand; Togo; Tonga; Trinidad and Tobago; Tunisia; Turkey; Turkmenistan; Uganda; Ukraine; United Arab Emirates; United Kingdom; United Rep. of Tanzania; Uruguay; USA; Uzbekistan; Vanuatu; Venezuela; Viet Nam; Yemen; Zambia; Zimbabwe