Economic voting and electoral volatility in
Turkish provinces
著者
Hazama Yasushi
権利
Copyrights 日本貿易振興機構(ジェトロ)アジア
経済研究所 / Institute of Developing
Economies, Japan External Trade Organization
(IDE-JETRO) http://www.ide.go.jp
journal or
publication title
IDE Discussion Paper
volume
202
year
2009-05-01
INSTITUTE OF DEVELOPING ECONOMIES
IDE Discussion Papers are preliminary materials circulated
to stimulate discussions and critical comments
Keywords: electoral volatility, economic voting, Turkey, panel analysis
* Director, Middle Eastern Studies Group, Area Studies Center, IDE
([email protected])
IDE DISCUSSION PAPER No. 202
Economic Voting and Electoral
Volatility in Turkish Provinces
Yasushi HAZAMA*
May 2009
Abstract
Two groups of questions were addressed: (1) Is voter punishment of the incumbent the primary factor in electoral volatility? Are there any other types of vote swings that underlie volatility? (2) In general, does a decline in economic growth destabilize voter behavior? If so, what kinds of vote swings does an economic downturn tend to generate? Provincial-level panel data analysis yielded the following results: (1) Changes in volatility appear to be primarily due to vote swings from the incumbent to the opposition and also to and from left-wing and right-wing parties. (2) Lower economic growth appears to increase electoral volatility by inducing vote swings not only from the government to the opposition but also from left-wing to right-wing parties. This is because right-wing parties better represent lower-income voters than left-wing parties and also seem more concerned with economic issues.
The Institute of Developing Economies (IDE) is a semigovernmental,
nonpartisan, nonprofit research institute, founded in 1958. The Institute
merged with the Japan External Trade Organization (JETRO) on July 1, 1998.
The Institute conducts basic and comprehensive studies on economic and
related affairs in all developing countries and regions, including Asia, the
Middle East, Africa, Latin America, Oceania, and Eastern Europe.
The views expressed in this publication are those of the author(s). Publication does not imply endorsement by the Institute of Developing Economies of any of the views expressed within.
INSTITUTE OF DEVELOPING ECONOMIES (IDE), JETRO 3-2-2, WAKABA, MIHAMA-KU, CHIBA-SHI
CHIBA 261-8545, JAPAN
©2009 by Institute of Developing Economies, JETRO
No part of this publication may be reproduced without the prior permission of the
IDE-JETRO.
Introduction
Over the last two decades, there has been a large disparity in economic growth among Turkish provinces. Provinces with slower growth than other regions are generally expected to have more acute economic grievances than other provinces. The literature on economic voting shows that voters who suffer from economic decline usually punish the incumbent. Yet previous research has not sufficiently investigated whether or not poor economic conditions destabilize the party system. Indeed, substantial variation over time in the stability of party systems in Turkish provinces calls for such inquiry.
Economic growth and party systems in Turkey display considerable instability over time and also across provinces. The inter-provincial difference in real gross domestic product (GDP) growth rates in Turkey (between the highest eight percent and the lowest eight percent) has been reported to be the largest among OECD countries during the period of 1995-2005 (OECD, 2009).1 Figure 1
illustrates per capita provincial real GDP growth with provincial and yearly effects held constant. Different growth rates can be a source of short-term fluctuation in voter economic grievances across provinces.2 Grievances can add to electoral instability by shifting voter allegiance from one party to
another. Studies using regional-level data, in particular for post-communist countries, have shown that regional economic conditions affect voting decisions (Pacek, 1994; Fidrmuc, 2000; Tucker, 2006). Further, micro-level evidence indicates that local and regional economic conditions affect individual voter party choice even when national and individual effects are held constant (Pattie et al., 1997). Provincial growth disparity in Turkey may thus constitute a major source of party system instability at the provincial level.
[Insert Figure 1 here]
Turkey made a transition to a multiparty system in 1946 but experienced two military interventions in 1960 and 1980. Although interruptions in parliamentary democracy lasted only one year in the first case and three years in the second, party system continuity was seriously undermined, particularly in the 1980 intervention in which all political parties were disbanded. Even after the resumption of a fully competitive election in 1987,3 political currents representing the former two major parties were
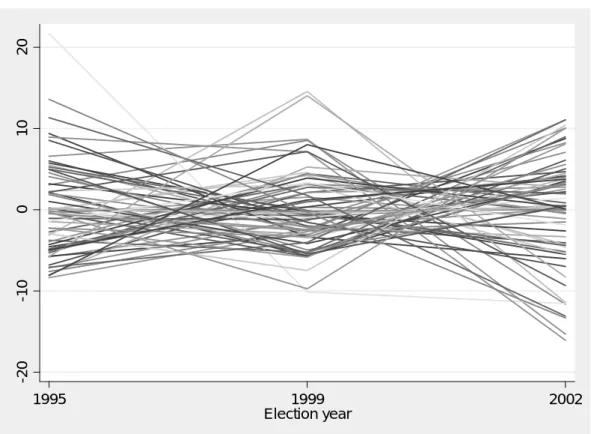
divided into rival left and right-wing parties with similar platforms. After 1987, Turkey went through a difficult process of institutionalizing its fragmented party system (See Figure 2). In addition to this national trend in politics, party system stability in Turkey (as measured by electoral volatility) has varied considerably across provinces over time. Electoral volatility (more precisely, total electoral volatility) is defined as the sum of absolute differences in party vote percentages between two consecutive elections, divided by two (Pedersen, 1983; Bartolini and Mair, 1990). Even controlling for provincial and yearly effects, electoral volatility has deviated about 20 points above and below the all-provincial and all-year means (See Figure 3).
[Insert Figure 2 here]
[Insert Figure 3 here]
This research examined the impact of different growth rates on the variation of electoral stability in the provinces of Turkey during the period of 1987-2002. Two major question areas were addressed: (1) Is voter punishment of the incumbent the primary factor in electoral volatility? Are
there any other types of vote swings (defined as the change in party vote percentages between two consecutive elections) that underlie volatility? (2) In general, does a decline in economic growth destabilize voter behavior? If so, what kinds of vote swings does an economic downturn tend to generate?
Provincial-level panel data was analyzed using a two-way fixed-effects model to control for variation attributable to particular provinces and/or years. In general, results provide supportive evidence for the proposition that economic deterioration gives rise to electoral volatility. This seems due not only to incumbent punishment but also vote swing from left-wing to right-wing parties. In the next section, literature on voting behavior and party politics are briefly reviewed with reference to emerging democracies and to Turkey in particular. The following section on research design provides elaboration of the methodology used to answer the research questions. Results of statistical analysis and interpretation are then presented, and the last section includes discussion and conclusions.
Literature Review
From a review of the literature, three observations can be made: (1) Economic voting analysis has predominantly focused on punishment of the incumbent; however, the level of instability caused by such punishment has not been fully explored, particularly for emerging democracies. (2) Sources of instability can be discerned by examining vote swings that underlie electoral volatility and their relationships with changes in economic conditions. (3) Party competition in Turkey appears to develop superficially on a left-wing/right-wing dimension, but that dimension strongly reflects a more fundamental center-periphery cleavage.
Economic voting, volatility, and vote swings
There is a large body of literature on economic voting that explores the impact of macro or micro economic changes on incumbent support. Voters’ tendency to punish or reward the incumbent for personal or national economic conditions has also been confirmed for Turkey (Çarkoğlu, 1997; Başlevent, Kirmanoğlu, and Şenatalar, 2005; Akarca and Tansel, 2006). However, there are few studies on the relationship between economic conditions and party system stability. For democracies in developing countries, it is not just whether or not the government can survive but whether or not the party system can be stabilized. Economic crises and fluctuations may well lead to major transformations of the party system rather than changes of governments among a few major parties. Electoral volatility is the most conventional measurement of party system stability. Its most general form, total electoral volatility, is defined as the sum of absolute differences in party vote percentages between two consecutive elections, divided by two (Bartolini and Mair, 1990). (Total) electoral volatility is a more elusive concept than incumbent support. Thus, only a few studies have examined the impact of economic changes on electoral volatility and party system stability (Remmer, 1991; Roberts and Wibbels, 1999; Duch and Stevenson, 2008). Other studies have assumed that economic performance affects electoral volatility through changes in votes for the incumbent (Mainwaring and Zoco, 2007; Nooruddin and Chhibber, 2008) but have left unanswered the question of whether or not economic decline brings about other types of changes in voting behavior.
There is scattered evidence, however, that economic decline enhances the popularity of the parties that represent voters who suffered most from it. It has been demonstrated for the United States (Weatherford, 1978) and developing countries (Aguilar and Pacek, 2000) that economic downturns hit lower-income groups harder than higher-income groups and thus contribute to stronger support for working-class parties. For post-communist countries, old-regime parties fared better under economic decline while economic improvement strengthened support for market-oriented parties
(Pacek, 1994; Harper, 2000; Fidrmuc, 2000; Tucker, 2006). For this logic to apply to Turkey, it is necessary first to ascertain which parties are regarded as representing the economically worse off.
In contrast to a Western model, the masses in Turkey have been better represented by the right than by the left. For Turkish voters, too, the left-right dimension seems to be the single most important determinant of party preference (Esmer, 2002; Çarkoğlu, 2007), but it reflects not so much a capital-labor cleavage as a center-periphery cleavage. Party politics seem to have evolved around this for several decades (Mardin, 1973; Çarkoğlu, 2007: 255-258; Çarkoğlu and Hinich, 2006: 384). Schematically, Turkey’s center represents the military and bureaucratic elite that established the secular nation state as well as the urban middle class that support it. The periphery consists of pious Sunnis, peasants, entrepreneurs, shop-keepers, and craftsmen. In a sense, the periphery is a collection of diverse social groups whose commonality is opposition to control from the center (on religious or economic activities for example).
Further, various scholars studying Turkish political parties hint that the inherent center-periphery cleavage results in different approaches of left-wing and right-wing parties to the economy (For the list of political parties, see Appendix I). Left-wing parties have been relatively reticent regarding economic issues or have been ambiguous in their advocacy of balance between state and private sectors. In particular, the center-left Republican People’s Party (CHP) has lacked concrete policy proposals and has failed to address economic problems for the masses, including economic inequality (Ayata, 2002: 109-113). What seems to be CHP neglect of working class interests can be attributed to the fact that the party was initially founded on the secular middle class that tried to establish liberal (not social) democracy despite a later search for “self-identity” in center-left ideology (Özman and Çoşar, 2000: 118-119).
In principle, right-wing parties seem to favor the free market and private sector. Voters who are concerned with economic issues have thus tended to support right-wing parties since the 1950s
(Kahraman, 1995: 125-126). Right-wing parties have also espoused populist distributive policies that seek to increase the welfare of the masses (Tosun, 2003: 341). Particularly in the 1990’s, the center-right True Path Party (DYP) combined a market-economy rhetoric with an emphasis on social security (Cizre, 2002: 87-99). More recently, the pro-Islamic party4 called for a reduced role of the
state in the economy and emphasized economic and social justice (FP, 1999; AKP, 2002). It is also the best organized political party in Turkey (Çakır, 1994; Yavuz, 2003). This party offers material support such as food and fuel to the urban poor. Such mobilization capacity helps to turn economic grievances into support for the pro-Islamic party. Indeed, the pro-Islamic party is the only party close to being a mass party in Turkey (Özbudun, 2007: 215-216).5 Since its victory in the 1994 general
local elections, the party has become known for having a more efficient and less corrupt management of municipalities than any other party.
The foregoing suggests that in the context of Turkey, there are two main reasons why economic downturns stimulate not only punishment of the incumbent but also vote swings from the left to the right: First, economic downturns (rather than upturns) in general produce more lower-income voters, and, in the Turkish context, these voters are more likely to support right-wing parties (conventional punishment of the incumbent can be observed at the same time). Second, right-wing parties appear more concerned with the economy and the plight of the poor than left-wing parties.6
Available data seems to support these two claims. A recalculation by the author of nation-wide poll data obtained immediately after the 1999 Turkish general election7 shows that relative to the
four income groups, the four major right-wing parties received support from two-thirds (68.4 percent) of the lowest-income group of voters but less than half (47.3 percent) of the highest-income group. In contrast, the two major left-wing parties combined received almost twice as many votes (39.1 percent) from the highest-income group than from the lowest (21.3 percent). The six major parties accounted for approximately 90 percent of the responses (Esmer, 2002: 101, table 5.4).
Another recalculation, by the author, of TÜSES and Veri (1996; 2002) datasets from nationwide surveys in 1996 and 2002 yielded evidence that voters with lower socioeconomic status tended to support right-wing parties. The relationship between the level of socioeconomic status and right-wing support was relatively weak, with Spearman’s rho being -0.08 and -0.09 for 1996 and 2002 respectively, but was statistically significant at the 0.01 level for both cases.8 Although far
from being definite, these findings motivate examination of the effect of the center-periphery cleavage on economic voting in Turkey.
Research Design
A major proposition of this research is that incumbent versus opposition and left versus right are two major dimensions for Turkish voters. These two dimensions significantly determine vote swings that constitute electoral volatility. The impact of economic growth on volatility can therefore be better understood by disaggregating volatility into inter-bloc volatility and vote swings. The two-way fixed-effects model employed in this research controls for both provincial and national trends and thus reveals the core relationship between change in growth rate and change in volatility.
Framework and Hypotheses
The primary focus of this research was to determine: (1) which of the above mentioned vote exchanges accounts for total electoral volatility (hereafter total volatility), and (2) whether or not an economic decline generates such vote exchanges. Two analyses (disaggregation analysis and economic-voting analysis) were conducted with panel data. First, disaggregation analysis was used to examine how total volatility is affected by its disaggregated components in terms of size and
direction. The size effect was gauged with inter-bloc volatilities such as incumbent volatility and left-wing volatility (See Appendix II through Appendix IV for explanation).9
The directional effect was measured by inter-bloc swings (consisting of incumbent swing and left-wing swing) and party swings (measured for each of the major political parties). When calculating any type of vote swing, all political parties are divided into two groups. Vote swing thus measures vote exchange between the two groups. A positive value in inter-bloc swing (or party swing) represents net vote transfer to a specific bloc (or party) from the remaining bloc (or parties). A negative value reflects net vote transfer away from the referred bloc (or party).
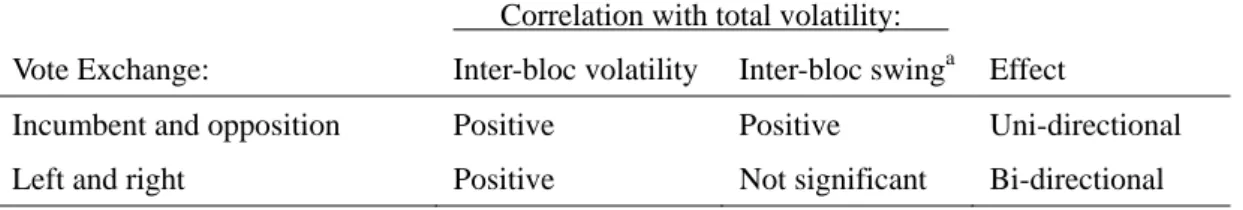
The (positive) correlation of both inter-bloc volatility and the corresponding inter-bloc swing (incumbent swing or left-wing swing) with total volatility indicates that vote exchange between two blocs has an asymmetric or uni-directional effect on total volatility. Uni-directional effects can be observed for incumbent swings. Incumbents tend to lose votes as time passes due to the cost of ruling (Nannestad and Paldam, 2002); the opposition does not. Consequently, the incumbent swing is usually negative; thus, total volatility tends to reflect loss of the incumbent vote more than gain. Conversely, if only inter-bloc volatility (but not the corresponding inter-bloc swing) is correlated (positively) with total volatility, then the effect of inter-bloc swing on total volatility is symmetrical or bi-directional. Bi-directional effects can be expected for both left-wing and right-wing swings since neither can be predominantly positive or negative in the long term.
[Insert Table 1 here]
To focus on the effect of an economic decline on disaggregated components of volatility, economic voting analysis was conducted to investigate the effect of per capita provincial real economic growth on the following: (1) total volatility, (2) inter-bloc volatilities, (3) inter-bloc
swings, and (4) party swings. The foregoing discussion leads to the expectation that a decline in economic growth will increase total volatility. This is primarily due to swings from incumbent to opposition. However, deterioration in the economy can also lead to vote swings from left-wing to right-wing parties. Right-wing parties seem more concerned with economic issues and are more popular among lower-income voters than are left-wing parties.
Analyses were conducted to find answers to the following questions: (1) Is voter punishment of the incumbent the primary factor in electoral volatility? Are there any other types of vote swings that underlie volatility? (2) In general, does a decline in economic growth destabilize voter behavior? If so, what kinds of vote swings does an economic downturn tend to generate? Two hypotheses were made based on previous arguments: (1) Total volatility is primarily associated with incumbent losses and secondarily with left-wing and right-wing swings. Incumbent swings have a uni-directional effect on total volatility, but left-wing or right-wing swings have a bi-directional effect. (2) A decline in economic growth increases total volatility via vote swings from the incumbent to the opposition as well as from right-wing to left-wing parties.
Data
The major data source for this study consisted of data files and publications of the Turkish Statistical Institute (Türkiye İstatistik Kurumu, TÜİK). These were either purchased or accessed from the Institute’s website. The original dataset compiled by the author covers 67 provinces and five general elections (N=335) held during the period of 1987-2002.10 Provincial economic growth statistics
corresponding to elections were available for this period. The panel data used for regression analysis was two points short of the original time points and covered only three elections (1995, 1999, and 2002). Two reasons account for this: (1) The calculation of electoral volatility at one time point requires party vote percentages at the previous time point. (2) The regression model used in this
analysis involves lag. The original panel data consisted of variables for five time points; due to the calculation of electoral volatility and associated lag, the number of time points was reduced to three, and the sample size thus became 201.
Dependent variables
The dependent variable for disaggregation analysis was total volatility. It is defined as the sum of the absolute differences in party vote percentages between two consecutive elections, divided by two. It reflects vote exchange among all parties and thus measures general party system instability. The major interest here is party system instability rather than incumbent support. What is important is not whether the incumbent loses support due to poor economic performance but rather whether or not an economic decline destabilizes the party system.
Dependent variables used in economic voting analysis included total volatility, two inter-bloc swings, and five party swings. In total, eight separate regressions were calculated for each dependent variable. Inter-bloc swings consist of incumbent swings and left-wing swings. Incumbent swing is the change in vote percentages for the incumbent parties between two consecutive elections. This measures net vote transfer to the incumbent party or parties from opposition parties. Left-wing swing is the change in vote percentages between two consecutive elections for all left-wing parties. This measures net vote transfer to all left-wing parties from all right-wing parties. Party swing is the change in vote percentages between two consecutive elections for each of the five parties or successions of parties for which consistent electoral data exists throughout the period of analysis. This measures net vote transfer to that party from all other parties.
Independent Variables
types of inter-bloc swings, and five party swings. Incumbent volatility is the absolute difference in vote percentages for the incumbent party/parties between two consecutive elections. Left-wing volatility is the absolute difference in vote percentages for left-wing parties. Other independent variables in the disaggregation analysis were defined above as the dependent variables for the economic voting analysis.
Economic voting analysis contains the major independent variable of this research, provincial economic growth. This was measured using the percentage change in per capita provincial real GDP during the one year period prior to the general election. Due to a shortage of data points, per capita provincial real GDP growth for the election year was used if an election took place in the last half of the year; per capita provincial real GDP growth for the previous year was used if the election took place in the first half of the year. For the general election of November 2002, however, the provincial GDP statistic for 2001 was used since the same statistic for 2002 was not available.
Control variables
Panel studies must take into consideration both group-specific effects and autocorrelation. Province dummy variables entailed by the fixed-effects model are used to control for group-specific effects. Vote swings (as well as electoral volatility, which derives from them) involves serious autocorrelation.11 It is because a vote swing in favor of one party or group of parties is usually
followed by a reverse swing due to the fact that vote swing in one direction cannot continue once the vote percentage of the party/parties has reached the potentially maximal level (Powell and Whitten, 1993). Autocorrelation can be met by including a lag of the dependent variable (Beck, 2008: 478-479). The literature also suggests that electoral volatility is affected by party system fragmentation; more fragmentation leads to more alternative parties which can receive votes (Pedersen, 1983; Bartolini and Mair, 1990; Remmer, 1991; Roberts and Webbels, 1999; Taagepera, 2008: 34-51). In general,
party system fragmentation is measured by the effective number of parties.12 Since the two-way
fixed-effects model controls for group and period effects, changes in the effective number of parties was used for analysis rather than that number per se.13
Model
Panel data was analyzed with a two-way fixed-effects regression model where the cross-section effect was related to the province and the period effect to the year. The fixed-effects rather than random-effects model was adopted since geographical divisions such as provinces or states are in general not regarded as constituting a random sample but as a collection of units with specific characteristics (Frees, 2004: 50; 72-73). The results of a preliminary analysis of the panel data with a random-effects model highlighted violation of assumptions of the model, specifically that the estimation errors were uncorrelated with regression coefficients. Further, using a two-way rather than one-way fixed-effects model allowed control for the national trend that thrusts the dataset. Since the main focus of this research is the impact of growth disparity on instability across provinces, the means of national (all-province) economic growth change and electoral volatility must be subtracted from the values of these variables. The subtraction of the national mean for each year entails introducing year-dummy variables (1999 and 2002, with 1995 as reference year). The two-way fixed-effects model thus takes the following form:
DVi,t = α + β1 (DVi,t-1) + β2 (ΔENPi,t) + β3 (IV1i,t) + β4 (IV2i,t) +... + βk (IVhi,t) + υi +γt + εi,t
where DVi,t is a measure of the dependent variable in province i in election t, ΔENP is the change
in the effective number of political parties, IV1, IV2, … IVh with h independent variables of interest (major independent variables), α is the intercept, βk are k coefficients to be estimated, υi are fixed
group effects, γt are fixed time effects, and εi,t is a white-noise error term.
Results
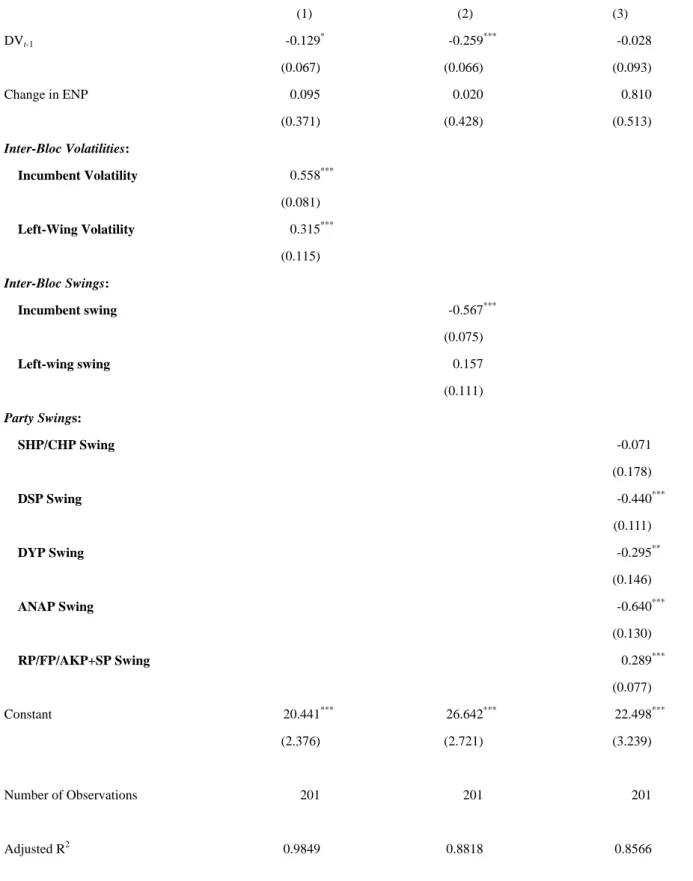
Results of the disaggregation analysis are reported in Table 2. They support the first hypothesis that total volatility consists primarily of vote swings from the incumbent to the opposition and to a lesser degree from left-wing to right-wing parties and from right-wing to left-wing parties. High incumbent volatility appears to be associated with high total volatility (Equation 1) whereas a smaller or more negative incumbent swing increased total volatility (Equation 2). On the other hand, both left-wing (left-to-right) and right-wing (right-to-left) swings tend to raise total volatility. Left-wing volatility had a positive effect on total volatility (Equation 1) while left-wing swing or right-wing swing (which is the other side of the same coin) did not affect total volatility at a statistically significant level (Equation 2). This underscores the symmetrical effect of vote exchanges between left-wing and right-wing parties. Both left-wing and right-wing swings increased total volatility. Among the major political parties, the succession of pro-Islamic parties (RP/FP/AKP+SP) alone accounts for a rise in total volatility (Equation 3). In other words, at the level of individual political party, the only beneficiary of vote swings has been the pro-Islamic party.
[Insert Table 2 here]
Does economic decline account for volatility and vote swings? The results of economic voting analysis reported in Table 3 suggest that it does indeed. Overall, a decline in per capita real GDP growth is associated with higher total volatility (Equation 1) as well as higher incumbent volatility
(Equation 2) and higher left-wing volatility (Equation 3). A decline in the growth rate leads to a larger vote swing from the incumbent to the opposition (Equation 4) or from left-wing to right-wing parties (Equation 5). The evidentiary value of Equation 5 is of particular importance since it gives credibility to the argument that right-wing parties are more representative of lower-income groups and given more credit for dealing with economic problems than their left-wing counterparts. The second hypothesis is thus supported.
[Insert Table 3 here]
The vote swing for the succession of the pro-Islamic party (RP/FP/AKP+SP), the only significant correlate of total volatility (See Table 2), was also negatively associated with change in growth rate. The lower the growth rate, the larger was the vote swing to the pro-Islamic party from the other parties. A somewhat weaker negative relationship was also found between the vote swing for the DSP and economic growth. However, as previous analysis shows (Table 2), the SHP/CHP swing did not significantly account for total volatility. It is likely that the SHP/CHP swing was negatively associated with the DSP swing and thus did not fundamentally change the left-wing party share of total votes.
Conclusions
This research included examination of the impact of different growth rates on variation of electoral stability in the provinces of Turkey during the period of 1987-2002. Two major questions were addressed: (1) Is voter punishment of the incumbent the primary factor in electoral volatility? Are
there any other types of vote swings that underlie volatility? (2) In general, does a decline in economic growth destabilize voter behavior? If so, what kinds of vote swings does an economic downturn tend to generate?
Provincial-level panel data was analyzed with a two-way fixed-effects model that controlled for variation attributable to particular provinces or years. The results revealed, first, that changes in volatility were due to vote swings primarily from the incumbent to the opposition and also to vote swings between left-wing and right-wing parties. Second, lower economic growth was also found to increase electoral volatility by inducing vote swings not only from the government to the opposition but also from left-wing to right-wing parties. This is because right-wing parties better represent lower-income voters than left-wing parties and also seem more concerned with economic issues.
The party that dominated anti-incumbent voting and swings to the right was the pro-Islamic party. This was the most organized and persistent opposition party in Turkey during the period.
Previous research related to economic voting has centered on retrospective voting behavior, and there has been relatively little empirical evidence regarding prospective voting. The preliminary results of this study suggest that there may be consistent vote swings that reflect searching by voters for better alternatives in their future government. The findings of this paper seem congruent with those of previous research that demonstrated the growing popularity of working-class parties during economic decline. The apparent behavior of the economically deprived in Turkey is also reminiscent of the tendency in post-communist countries for voters who cannot benefit from the transition to a market economy to become more supportive of old regime parties. However, in Turkey, punishment of the incumbent was distinctly present while this seems not to have been the case in Eastern Europe.
Notes
Paper read at the International Symposium “Linkage of Disparities: Reorganization of Power and Opportunities in the Globalized World,” Center for Integrated Area Studies, Kyoto University, January 30-February 1, 2009. The author wishes to acknowledge the insightful questions and valuable comments of Fumiko Oshikawa, Hiroshi Hirano, Yuriko Takahashi, and Keiichi Kubo.
1
Statistics for Turkey are for the period of 1995-2001. No data were available for the 2002-2005 period.
2
In the long term, high-income units such as provinces or countries tend to grow slower than low-income units. However, this tendency cannot fully explain the large short-term fluctuation in provincial economic growth.
3
The military government allowed only three parties to participate in the transition election of 1983.
4
Due to disbandment, the party name changed from the Welfare Party (RP) to the Virtue Party (FP) and then to the Justice and Development Party (AKP). The smaller Felicity Party (SP) also split from the FP. The pro-Islamic party was twice broken up during the post-1983 period but reemerged forming a succession party in response to each forced closure. The pro-Islamic party consistently raised public support during the 1990’s, primarily by staying in opposition, and then established a single-party government in 2002. Its government was strongly endorsed by voters in 2007.
5
Membership/voters and membership/electorate rates of this party not only far exceed those of the second largest party in Turkey but also rank among the highest in Southern Europe. Research shows the ratio of party members to total electorate to be 5.5 for the AKP and 1.4 for CHP, and the ratio of party members to the party’s own voters to be 21.9 for the AKP and 9.2 for the CHP (Bosco and Morlino, 2007: tables 1 and 3).
6
Comparing right-wing and left-wing parties, quantitative evidence indicates that voters believe right-wing parties to be better able to handle economic than non-economic issues. A recalculation of Kalaycıoğlu’s (2005: 246, table 8) survey results shows that among the electoral campaign issues in which voters expected success from each major party, economic (as opposed to non-economic) issues accounted for 50.6 percent of what major right-wing parties combined were expected to handle successfully. Economic issues comprised 42.4 percent of what major left-wing parties combined were expected to handle successfully. (In the meantime, major right-wing parties combined received more votes than major left-wing parties combined. In both economic and non-economic issues, right-wing parties combined were thus expected to be more successful than left-wing parties combined).
7
This corresponds to the middle (second) of three time points that are the focus of the current research. This can be regarded as the average tendency for the entire period under analysis.
8
Spearman’s rank-sum correlation analysis between the dummy variable for right-wing party support and the socioeconomic status variable was conducted for 1140 and 1101 observations from the 1996 and
he/she would vote for any right-wing (left-wing) party if general elections were held on that day. The socioeconomic status variable was measured by a composite socioeconomic status index (ranging from the highest 6 to the lowest 1) calculated from various factors ranging from household property, household size, occupation, employment status, education levels of household members. Other TÜSES-Veri survey datasets included no socioeconomic status variable (1998) or one based solely on the socioeconomic status of the residential quarter (2004). For a full explanation of this socioeconomic status index, see Tüzün (2006). The author greatly acknowledges TÜSES and Veri Araştırma’s permission to use these datasets as well as Dr. Sezgin Tüzün’s help to the author.
9
There is no need to discuss intra-bloc volatility since by definition, inter-bloc and intra-bloc volatility sum to total volatility. If one type of inter-bloc volatility, such as that of the left-wing, is positively correlated with total volatility, then the corresponding intra-bloc volatility (the sum of volatility within the left-wing and right-wing parties) is as strongly correlated negatively with total volatility as with inter-bloc volatility.
10
The number of provinces of Turkey increased from 67 to 81 during this period. The newly created provinces were not included in the current analysis. These new provinces were composed of a very few and relatively peripheral sub-provinces. The removal of these sub-provinces from the original 67 provinces thus did not fundamentally change the socioeconomic characteristics of the 67 provinces of Turkey.
11
Pairwise first-order autocorrelations were -0.529, -0.452, and 0.243 (all statistically significant at the 0.001 level) for the incumbent swing, the left-wing swing, and total volatility, respectively for the panel.
12
The effective number of parties is defined as 1/ΣVi2, where Vi indicates the i-th party’s vote share (Laakso and Taagepera, 1979).
13
The effective number of parties (rather than change in that number) was also used in the preliminary analysis but had a weaker (although statistically significant) effect.
References
Adalet ve Kalkınma Partisi (AKP) (2002). Herşey Türkiye için: AK Parti seçim beyannamesi [Everything for Turkey: AK Party Election Manifesto].
Aguilar, Edwin Eloy and Alexander C. Pacek (2000). “Macroeconomic Conditions, Voter Turnout, and the Working-Class/Economically Disadvantaged Party Vote in Developing Countries,” Comparative Political Studies 33(8): 995-1017.
Akarca, Ali T. and Aysıt Tansel (2006). “Economic Performance and Political Outcomes: An Analysis of the Turkish Parliamentary and Local Election Results between 1950-2004,” Public Choice 129 (1): 77-105.
Ayata, Ayşe-Güneş (2002). The Republican People’s Party,” in Barry Rubin and Metin Heper (eds.), Political Parties in Turkey. London: Frank Cass.
Başlevent, Cem, Hasan Kirmanoğlu, and Burhan Şenatalar (2005). “Empirical investigation of party preferences and economic voting in Turkey,” European Journal of Political Research 44(4): 547- 562.
Bartolini, Stefano and Peter Mair (1990). Identity, Competition, and Electoral Availability: The Stabilisation of European Electorates 1885-1985. Cambridge: Cambridge University Press.
Beck, Nathaniel (2008). “Time-series Cross-section Methods,” in Janet M. Box-Steffensmeier, Henry E. Brady and David Collier (eds.), The Oxford Handbook of Political Methodology. Oxford: Oxford University Press.
Bosco, Anna and Leonardo Morlino (2007). “What Changes in South European Parties? A Comparative Introduction,” in Anna Bosco and Leonard Morlino (eds.), Party Change in Southern Europe. London: Routledge.
Cizre, Ümit (2002). “From Ruler to Pariah: The Life and Times of the True Path Party,” in Barry Rubin and Metin Heper (eds.), Political Parties in Turkey. London: Frank Cass.
Çakır, Ruşen (1994). Ne şeriat ne demokrasi: Refah Partisini anlamak [Neither Sharia nor Democracy: Understanding the Welfare Party]. Istanbul: Metis.
Çarkoğlu, Ali (1997). “Macro Economic Determinants of Electoral Support for Incumbents in Turkey, 1950-1995,” New Perspectives on Turkey 17: 75-96.
Çarkoğlu, Ali (2007). “The Nature of Left–Right Ideological Self-placement in the Turkish Context,” Turkish Studies 8(2): 253-271.
Çarkoğlu, Ali and Melvin J. Hinich (2006). “A Spatial Analysis of Turkish Party Preferences,” Electoral Studies 25(2): 369-392.
Economic Institutions Condition Election Results. Cambridge: Cambridge University Press. Esmer, Yılmaz (2002). “At the Ballot Box: Determinants of Voting Behavior,” in Sabri Sayari and
Yılmaz Esmer (eds.), Politics, Parties, and Elections in Turkey. Boulder: Lynne Rienner.
Fazilet Partisi (1999). Günışığında Türkiye: 18 Nisan 1999 seçim beyannamesi [Turkey in the Sunlight: 18 April 1999 Election Manifesto].
Fidrmuc, Jan (2000). “Economics of Voting in Post-communist Countries,” Electoral Studies 19 (2-3): 197-217.
Frees, Edward W. (2004). Longtitudinal and Panel Data: Analysis and Applications in the Social Science. Cambridge: Cambridge University Press.
Harper, Marcus A. (2000). “Economic Voting in Postcommunist Eastern Europe,” Comparative Political Studies 33 (9): 1191-1227.
Kahraman, Hasan Bülent (1995). Sağ Türkiye ve partileri [Right-wing Turkey and Its Parties]. Ankara: Imge.
Kalaycıoğlu, Ersin (2005). “The Mystery of the Türban: Participation or Revolt?” Turkish Studies 6(2): 233-251.
Laakso, Markku and Rein Taagepera (1979). ‘“Efective” Number of Parties: A Measure with Application to West Europe.’ Comparative Political Studies 12(1): 3–27.
Mardin, Şerif (1973). “Center-Periphery Relations: A Key to Turkish Politics?” Deadalus 102 (1): 169-190.
Mainwaring, Scott and Edurne Zoco (2007). “Political Sequences and the Stabilization of Interparty Competition: Electoral Volatility in Old and New Democracies,” Party Politics 3(2): 155-178. Nannestad, Peter and Martin Paldam (2002). “The Cost of Ruling: A Foundation Stone for Two
Theories,” in Hans Dorussen and Michael Taylor (eds.), Economic Voting. New York: Routledge. Nooruddin, Irfan and Pradeep Chhibber (2008). “Unstable Politics: Fiscal Space and Electoral
Volatility in the Indian States,” Comparative Political Studies 41(8): 1069-1091
Organization for Economic Cooperation and Development (OECD) (2009). Regions at a Glance 2009.
http://titania.sourceoecd.org/vl=12373359/cl=29/nw=1/rpsv/regionsataglance2009/02/03/index.ht m, accessed April 13.
Özbudun, Ergun (2007). “From Political Islam to Conservative Democracy: The Case of the Justice And Development Party in Turkey,” in Anna Bosco and Leonard Morlino (eds.), Party Change in Southern Europe. London: Routledge.
Özman, Aylin and Simten Coşar (2000). “1990’larda Türkiye’de sağ ve sol siyasetin öncüleri [The Vanguard of Right and Left Politics in Turkey During the 1990’s],” Birikim 139: 111-120.
Pacek, Alexander C. (1994). “Macroeconomic Conditions and Electoral Politics in East Central Europe,” American Journal of Political Science 38(3): 723-744.
Pattie, Charles, Daniel Dorling and Ron Johnston (1997). “The Electoral Geography of Recession: Local Economic Conditions, Public Perceptions and the Economic Vote in the 1992 British General Election,” Transactions of the Institute of British Geographers 22(2): 147-161.
Pedersen, Mogens N. (1983). “Changing Patterns of Electoral Volatility in European Party Systems, 1948-1977: Explorations in Explanation,” in Hans Daalder and Peter Mair (eds.), Western European Party Systems: Continuity and Change. London: Sage.
Powell, G. Bingham, Jr. and Guy D. Whitten (1993). “A Cross-National Analysis of Economic Voting: Taking Account of the Political Context,” American Journal of Political Science 37(2): 391-414.
Remmer, Karen (1991). “The Political Impact of Economic Crisis in Latin America in the 1980s,” American Political Science Review 85(3): 777-800.
Roberts, Kenneth M. and Erik Wibbels (1999). “Party Systems and Electoral Volatility in Latin America: A Test of Economic, Institutional, and Structural Explanations,” American Political Science Review 93(3): 575-590.
Taagepera, Rein (2008). Making Social Sciences More Scientific: The Need for Predictive Models. Oxford: Oxford University Press.
Tachau, Frank (ed.) (1994). Political Parties of the Middle East and North Africa. Westport: Greenwood Press.
Tosun, Tanju (2003). Siyasette yeniden mevzilenmeler: Liberal sosyal sentez, muhafazakar demokrat sentez ekseninde 3 kasim 2002 seçimleri [New Positioning in Politics: The November 3, 2002 General Election from the Perspectives of Liberal Social Synthesis and Conservative Democratic Synthesis]. Istanbul: Büke.
Tucker, Joshua A. (2006). Regional Economic Voting: Russia, Poland, Hungary, Slovakia, and the Czech Republic, 1990-1999. Cambridge: Cambridge University Press.
Türkiye İstatistik Kurumu(TÜİK)http://www.tuik.gov.tr
Türkiye Sosyal Ekonomik Siyasal Araştırmalar Vakfı (TÜSES) and Veri Araştırma(Veri)(1996). Dataset for Türkiye’de siyasi parti seçmenlerinin nitelikleri, kimlikleri ve eğilimleri [The Characteristics, Identities, and Tendencies of Party Supporters in Turkey]. Istanbul: Türkiye Sosyal Ekonomik Siyasal Araştırmalar Vakfı (TÜSES).
Türkiye Sosyal Ekonomik Siyasal Araştırmalar Vakfı (TÜSES) and Veri Araştırma(Veri)(2002). Dataset for Turkiye’de siyasi partilerin yandaş/seçmen profili (1994-2002) [The Supporter/Voter Profile of Political Parties in Turkey (1994-2002)]. Istanbul: Türkiye Sosyal Ekonomik Siyasal Araştırmalar Vakfı (TÜSES).
Tüzün, Sezgin (2006). ‘Kentsel Türkiye hane ve bireyleri için bir tabakalaşma modeli olarak “Veri Sosyo-Ekonomik Statü İndeksi” (VERİ S.E.S.İ.) [“Veri Socioeconomic Status Index” as a Stratified Model for Urban Turkish Households and Individuals].’ Unpublished paper.
Weatherford, M. Stephen (1978). “Economic Conditions and Electoral Outcomes: Class Differences in the Political Response to Recession,” American Journal of Political Science 22(4): 917-938. Yavuz, Hakan (2003). Islamic Political Identity in Turkey. Oxford: Oxford University Press.
Tables and Figures
Table 1. Directional Effects of Inter-bloc Vote Exchanges on Total Volatility
Vote Exchange:
Correlation with total volatility:
Effect Inter-bloc volatility Inter-bloc swinga
Incumbent and opposition Positive Positive Uni-directional
Left and right Positive Not significant Bi-directional
Source: Compiled by the author.
Note: This table shows expected correlations between inter-bloc volatility/swing and total volatility that would indicate directional effects of vote exchanges on total volatility.
a
Incumbent swing for vote exchange between incumbent and opposition; left-wing swing for vote exchange between left and right.
Table 2. Disaggregation Analysis: Electoral Volatility Attributed to Various Components (1) (2) (3) DVt-1 -0.129* -0.259*** -0.028 (0.067) (0.066) (0.093) Change in ENP 0.095 0.020 0.810 (0.371) (0.428) (0.513) Inter-Bloc Volatilities: Incumbent Volatility 0.558*** (0.081) Left-Wing Volatility 0.315*** (0.115) Inter-Bloc Swings: Incumbent swing -0.567*** (0.075) Left-wing swing 0.157 (0.111) Party Swings: SHP/CHP Swing -0.071 (0.178) DSP Swing -0.440*** (0.111) DYP Swing -0.295** (0.146) ANAP Swing -0.640*** (0.130) RP/FP/AKP+SP Swing 0.289*** (0.077) Constant 20.441*** 26.642*** 22.498*** (2.376) (2.721) (3.239) Number of Observations 201 201 201 Adjusted R2 0.9849 0.8818 0.8566
Notes: Entries are regression coefficients for the two-way fixed-effects model. Province and year dummies are omitted from the table. Robust standard errors are in parentheses. The dependent variable is total volatility, which is the sum of absolute differences in party vote percentages between two consecutive elections divided by two. DV stands for the dependent variable, and ENP stands for the effective number of parties. Incumbent volatility is the absolute difference in vote percentages for the incumbent party/parties between two consecutive elections. Left-wing volatility is the absolute difference in vote percentages for all left-wing parties. Incumbent swing is the change in vote percentages between two consecutive elections for the incumbent parties; this measures net vote transfer to the incumbent party/parties from opposition parties. Left-wing swing is the change in vote percentages for all left-wing parties between two consecutive elections; this measures net vote transfer to left-wing parties from right-wing parties. Party swing is change in vote percentages of the party between two consecutive elections, and this measures net vote transfer to the party from all other parties.
*
Table 3. Economic Voting Analysis: Impact of GDP Growth on Volatility and Vote Swings
Dependent Variables Party Swings Volatility Inter-Bloc Swings Left-Wing Parties Right-Wing Parties
Total Incumbent Left-Wing Incumbent Left-Wing SHP/CHP DSP ANAP DYP RP/FP
/AKP+SP (1) (2) (3) (4) (5) (6) (7) (8) (9) (10) DVt-1 -0.088 -0.249 ** 0.074 -0.342 *** -0.453 *** -0.377 *** -0.256 -0.290 ** -0.411 *** -0.288 *** (0.110) (0.111) (0.126) (0.090) (0.057) (0.079) (0.199) (0.138) (0.056) (0.079) Δ ENP 1.307 *** 1.885 *** 0.431 -2.720 *** -2.343 *** 0.631 * -2.552 *** -0.630 ** 0.950 *** -1.321 *** (0.431) (0.357) (0.329) (0.460) (0.445) (0.355) (0.481) (0.286) (0.338) (0.431) Growth -0.279 *** -0.413 *** -0.276 *** 0.552 *** 0.283 *** -0.215 ** 0.351 *** -0.078 0.011 -0.358 *** (0.091) (0.112) (0.056) (0.151) (0.095) (0.089) (0.097) (0.077) (0.086) (0.100) Constant 40.164 *** 33.669 *** 7.095 *** -32.340 *** -3.577 *** 7.197 *** -14.587 *** -9.678 *** -6.047 *** 13.804 *** (2.847) (1.317) (1.071) (1.727) (0.957) (1.049) (1.558) (0.681) (0.899) (1.079) No. of Obs 201 201 201 201 201 201 201 201 201 201 Adjusted R2 0.741 0.840 0.253 0.809 0.677 0.712 0.805 0.219 0.429 0.836
Source: Compiled by the author from the panel dataset. Notes: See notes for Table 2.
*
Figure 1. Standardized Per Capita Provincial Real GDP Growth* (n=67, T=3)
Source: Compiled by the author from the panel dataset.
Note: *Changes in the per capita real GDP growth rate percentage in the province controlling for provincial (group) and national (period) effects. Formally, SGit= Git−Gi.−G.t+G.. where SGit is
the standardized growth rate in province i at year t, Git is the growth rate in province i at year t, Gi.
is the all-year mean growth rate for province i, G.t is the all-province mean growth rate for year t,
and G.. is the mean growth rate for the sample.
-2 0 -1 0 0 10 20 1995 1999 2002 Election year
Figure 2. Party Vote Percentages (1983-2002)
Source: Compiled by the author from TÜİK (various years).
0% 100% 1983 1987 1991 1995 1999 2002 ←Left Right→ HADEP /DEHAP DSP SHP/CHP HP GP Other Ind. DYP ANAP MDP RP/FP/AKP MÇP/MHP IDP
Figure 3. Standardized Electoral Volatility* (n=67, T=3)
Source: Compiled by the author from the panel dataset.
Note: *Changes in electoral volatility in the province controlling for provincial (group) and national (period) effects. Formally, EVit= EVit−EVi.−EV.t+EV.. where EVit is electoral volatility, EVit is
electoral volatility in province i at year t, EVi. is the all-year mean growth rate for province i,
t
EV. is the all-province mean growth rate for year t., and EV.. is the mean electoral volatility for
the sample. -2 0 -1 0 0 10 20 1995 1999 2002 Election year
Appendices
Appendix I. Political Parties in the 1987-2002 General Elections
Partya Foundation (Split from) /Succession Abolition (Merger into)b Ideology: L=left, R=right P=pro-, A=anti-systemic Incumbent electionsc
HADEP/DEHAP 1995/1997 L-A (Kurdish)
SHP 1985 1995 (CHP) L-P (Center-left) CHP 1992 (SHP) L-P (Center-left) 1995 DSP 1985 L-P (Center-left) 2002 ANAP 1983 R-P (Center-right) 1987, 1991, 1999, 2002 DYP 1983 R-P (Center-right) 1995 GP 2002 R-A (Nationalist) MÇP/MHP 1983/1993d R-A (Nationalist) 2002
AKP 2001 (FP) R-A (Religious)
RP/FP 1983/1997 1998, 2001 R-A (Religious) 1999
SP 2001 (FP) R-A (Religious)
Sources: Compiled by the author from Tachau (1994) and other sources.
Notes: This list excludes minor parties that did not obtain at least one percent of the vote in any of the elections.
a
HADEP: People’s Democracy Party. DEHAP: Democratic People’s Party. SHP: Social Democratic Populist Party CHP: Republican People’s Party. DSP: Democratic Left Party. ANAP: Motherland Party. DYP: True Path Party. GP: Youth Party.
MÇP/MHP: Nationalist Work Party/Nationalist Action Party. AKP: Justice and Development Party.
RP/FP: Welfare Party/Virtue Party. SP: Felicity Party.
b
Abolition by the Constitutional Court.
c
Defined as an election until which the party stayed in government for more than one year.
d
Appendix II. Calculation of Total Volatility
Party I/O Bloc L/R Bloc Votet
(A) Votet-1 (B) Swing (A-B) |Swing| | A-B | W Incumbent Right 30 34 -4 4 X Incumbent Left 20 25 -5 5 Y Opposition Right 40 30 10 10 Z Opposition Left 10 11 -1 1 Sum 100 100 0 20 Total volatility 10
Source: Compiled by the author. Note: This is a hypothetical case.
Appendix III. Calculation of Incumbent Swing and Volatility
Party I/O Bloc Votet
(A) Votet-1 (B) Swing (A-B) Σ(A-B) Σ| A-B | W Incumbent 30 34 -4 -9 9 X Incumbent 20 25 -5 Y Opposition 40 30 10 9 9 Z Opposition 10 11 -1 Sum 100 100 0 0 18 Incumbent Swing -9 Incumbent Volatility 9
Source: Compiled by the author.
Appendix IV. Calculation of Left-Wing Swing and Volatility
Party L/R Bloc Votet
(A) Votet-1 (B) Swing (A-B) Σ(A-B) Σ| A-B | X Left 20 25 -5 -6 6 Z Left 10 11 -1 W Right 30 34 -4 6 6 Y Right 40 30 10 Sum 100 100 0 0 12 Left-Wing Swing -6 Left-Wing Volatility 6
Appendix V. Descriptive Statistics (N=268) Mean Std. Err. Total Volatility 25.04018 0.634596 Incumbent Volatility 16.3609 0.788844 Left-Wing Volatility 5.869791 0.346033 Incumbent Swing -16.2538 0.918429 Left-Wing Swing -1.2959 0.509947 SHP/CHP Swing -0.19701 0.495264 DSP Swing -1.77313 0.665032 ANAP Swing -7.43321 0.350544 DYP Swing -2.28097 0.474688 RP/FP/AKP+SP Swing 6.195522 0.703463 Change in ENP 0.351271 0.085353
Change in Per Capita Real GDP 0.741619 0.455428 Source: Compiled by the author from the panel dataset.