Has Low Productivity Constrained
Competitiveness of African Firms? : Comparison
of the Firm Performances with Asian Firms
著者
Fukunishi Takahiro
権利
Copyrights 日本貿易振興機構(ジェトロ)アジア
経済研究所 / Institute of Developing
Economies, Japan External Trade Organization
(IDE-JETRO) http://www.ide.go.jp
journal or
publication title
IDE Discussion Paper
volume
129
year
2007-12-01
INSTITUTE OF DEVELOPING ECONOMIES
IDE Discussion Papers are preliminary materials circulated
to stimulate discussions and critical comments
Keywords:
technical efficiency, allocative efficiency, manufacturing, sub-Saharan AfricaJEL classification:
D24, L67, O33†
Research Fellow, Africa Study Group, Area Studies Center, IDE
([email protected])
IDE DISCUSSION PAPER No. 129
Has Low Productivity Constrained
Competitiveness of African Firms? :
Comparison of the Firm Performances
with Asian Firms
Takahiro Fukunishi
†December 2007, revised October 2008
Abstract
It has been argued that poor productive performance is one of critical sources of stagnation of the African manufacturing sector, but firm-level empirical supports are limited. Using the inter-regional firm data of the garment industry, technical efficiency and its contribution to competitiveness measured as unit costs were compared between Kenyan and Bangladeshi firms. Our estimates indicated that there is no significant gap in the average technical efficiency of the two industries despite conservative estimation, although unit costs greatly differ between the two industries. Higher unit cost in Kenyan firms mainly stems from high labour cost, while impact of inefficiency is quite small. Productivity accounts little for the stagnation of garment industry in several African countries.
The Institute of Developing Economies (IDE) is a semigovernmental,
nonpartisan, nonprofit research institute, founded in 1958. The Institute
merged with the Japan External Trade Organization (JETRO) on July 1, 1998.
The Institute conducts basic and comprehensive studies on economic and
related affairs in all developing countries and regions, including Asia, the
Middle East, Africa, Latin America, Oceania, and Eastern Europe.
The views expressed in this publication are those of the author(s). Publication does not imply endorsement by the Institute of Developing Economies of any of the views expressed within.
INSTITUTE OF DEVELOPING ECONOMIES (IDE), JETRO 3-2-2, WAKABA,MIHAMA-KU,CHIBA-SHI
CHIBA 261-8545, JAPAN
Has Low Productivity Constrained Competitiveness of African Firms?:
Comparison of Performances with Asian Firms.
*Takahiro Fukunishi**
Abstract
It has been argued that poor productive performance is one of critical sources of stagnation of the
African manufacturing sector, but firm-level empirical supports are limited. Using the inter-regional
firm data of the garment industry, technical efficiency and its contribution to competitiveness
measured as unit costs were compared between Kenyan and Bangladeshi firms. Our estimates
indicated that there is no significant gap in the average technical efficiency of the two industries
despite conservative estimation, although unit costs greatly differ between the two industries. Higher
unit cost in Kenyan firms mainly stems from high labour cost, while impact of inefficiency is quite
small. Productivity accounts little for the stagnation of garment industry in several African countries.
*
The firm survey for this study was jointly conducted with M. Murayama, T. Yamagata (IDE), A. Nishiura (Soka University) and the staffs of the Institute of Development Studies, University of Nairobi and the Institute of Business Administration, University of Dhaka. The author would like to thank Machiko Nissanke, Nobuya Haraguchi and participants of the UNIDO-IDE workshop “Productivity and Growth in Africa and Asia” and the CSAE Conference at Oxford University for their helpful comments.
**
1. Introduction
Manufacturing sector in sub-Saharan Africa has been stagnated since the 1980s except a few
countries. Economic studies on the African industry imply that slow productivity growth as a source
of the long stagnation. Literatures on the technical capacity of firms reported that most of the African
firms have used obsolete technology and equipment, and that their technical knowledge and skills
are poorer than those in Asia (Lall [1999], Biggs et al. [1995], Pack [1993]). They argue that lack of
knowledge and skill has hindered efficient use of technology as well as technological upgrading, and
under the trade liberalization, such backwardness leads to decline of African industry not only in the
export market but in the domestic market where competition with imports (particularly Asian
products) has become acute. Other literatures focus on the business environment in Africa. They
suggested that African business environment characterized as high risk of contract enforcement, high
cost of production and transportation, and great uncertainty in the macroeconomic environment has
seriously discouraged African firms from investment (Collier and Gunning [1999]). In fact,
investment rate of African firms is shown to be quite low (Bigsten et al [1999]). These studies
indicated that investment in technology, such as R&D and skill formation, has been discouraged in
African manufacturing sector, and consequently, productivity growth was far behind the rivals in the
world.
After the mid-1990s, a growing number of studies measured firm-level productivity due to the
increased availability of firm data, and they have revealed the productive performance of African
firms in many important aspects. For instance, they found stagnation of productivity growth in the
manufacturing sector (Teal [1999], Adenikinjyu et al. [2002], Soderling [2000], Mlambo [2002]),
productivity difference by firm characteristics, such as size, age, ethnicity of manager, and market
orientation (for example, Bigsten et al [2000], Fafchamps [2001], Mazumdar and Mazaheri [2003],
Soderbom and Teal [2004], van Biesebroeck [2005]), and the relationship between entry and exit
action with productivity (Fraser [2005], Shiferaw [2007], Bigsten and Gebreeyesus [2007]).
in the other region was investigated in few studies. Exceptionally, Pack [1987] compared total factor
productivity of textile firms in Kenya with those in other countries, and reported that Kenyan firms
are less productive than firms in developed countries but as productive as Philippine firms. Some
studies compared partial factor productivities of African firms with those of Asian firms (for
example, Biggs et al [1995], Blattman et al [2004], Shah et al [2005]), but they are only a crude
measure of productivity when firms face different factor prices and use different technologies.
Despite a shared recognition, relatively poor productivity of African firms has not yet been
empirically shown.
Furthermore, productivity is not the sole determinant of competitiveness even in a market where
price competition dominates. Factor costs, scale economy and allocation of factors (how efficiently a
firm allocate factors to minimize cost) also affect the cost of production. A few studies have explored
impact of factor prices on competitiveness, and they focused on unit labour cost gauged typically as
labour costs per value added (Lindauer and Velenchik [1994], Mabye and Golub [2003], Blattman et
al [2004], Shah et al [2005]). Although they indicated the adverse effect of high wage on
competitiveness in some countries, it does not tell about sources of low labour productivity, which
can be accounted for by total factor productivity, scale economies and efficiency of factor allocation.
Therefore, backgrounds of the competitiveness gap between the industries in Africa and the other
regions have not been systematically explored.
Using the original firm data from Asia and Africa, this study attempts to make a consistent
comparison of productivity, and to demonstrate its impact on competitiveness together with factor
prices, scale economies and factor allocation. Focus is on a single industry, the garment industry.
Performance of the garment industry shows sharp contrast between Africa and other countries, and
underdevelopment of the sector attracted attention of some development economists (Sachs [2005],
Collier [2007]). By narrowly defining an industry to be analyzed, productivity and competitiveness
are gauged based on homogenous technology; that is, productivity difference due to heterogenous
technology is avoided. Data was collected in Kenya and Bangladesh in 2003. Since Bangladesh is
performance between the two countries is roughly conditioned on income level, and the possible
reverse causality can be minimized. Although the data is cross-section, it has relatively large samples
of the single industry in low-income countries, and includes firm information on technology, labour
and market, which allows better estimates of firm-level productivity.
In this paper, technical efficiency was estimated as a productivity measure based on the stochastic
production frontier model with the pooled samples of Kenyan and Bangladeshi firms. Estimate
indicated that the average of technical efficiency does not differ significantly between Kenyan and
Bangladeshi firms. Since it is statistically supported that firms in the two countries share a common
technology, this result indicated that the two industries are equally productive on average. This result
was robust in non-parametric estimation of productivity.
On the other hand, large disparity was found in the firm competitiveness measured by unit cost.
The average unit cost of Kenyan local firms is higher by 150% to that of Bangladeshi firms.
Deriving unit cost function from production frontier estimation, the unit cost difference was
decomposed to technical efficiency, factor prices, scale economy and allocative efficiency. It
indicated that wages pushed up cost of Kenyan firms most significantly, while technical and
allocative efficiency only slightly inflated the unit cost gap between Kenyan and Bangladeshi firms.
Adjustment of wages by worker’s tenure did not yield substantial change. The result suggested that a
sharp contrast of competitiveness is due to factor price rather than productivity in the garment
industry.
In the next section, a framework for an inter-regional comparison of firm performances is
described, which includes the methodology used for measurement of productivity and identification
of its impact on competitiveness. Results of empirical analysis are shown in the third section, and
conclusions are presented in the last section.
2. Framework and Methodology
relatively simple and labour-intensive technology, the garment industry has grown in many
developing countries. It had started to grow in the 1960s in East Asia and it gradually shifted to
Southeast Asia and Latin America in the 1970s and 80s. Particularly in Asia, exports of clothing
preceded industrialization process and lead to economic growth (Lall [2000], World Bank [1993]).
Recently, garment exports have grown in low-income countries including Bangladesh, Vietnam, and
Cambodia, and they have become large exporters in the world market. In contrast, the garment
industry in African countries did not penetrate the export market with exception of Mauritius, and
has even lost most of its share in domestic markets after trade liberalization (McCormick and
Rogerson [2004]). Lagging for several decades, garment exports started to grow in several African
countries after 2000 due to preferential access given by United States. However, the growth trend
substantially slowed down after 2005 when termination of the Multi-Fiber Agreement (MFA) led to
free market regime in the world textile market. The garment industry is a good case to see the
contrast of performance in African and the other regions.
Performance and competitiveness are compared between Kenya and Bangladesh. The Bangladeshi
garment industry has grown since the 1980s and has become the eighth largest exporter in the world
(2002, WTO [2003]). While growth of the industry was triggered by technical cooperation by a
Korean firm, local firms have learned technology swiftly, and now most of exporters are local origin
(Rhee and Belot [1989]). Conversely, the Kenyan garment industry used to be the largest cluster in
East Africa, but trade liberalization in the early 1990s has resulted in the influx of imports of
secondhand and Asian clothing, and the industry has drastically shrunk (McCormick et al. [1999]).
Exports have grown since 2000 when the US government provided preferential access to African
countries under the African Growth and Opportunity Act (AGOA), but scale is small and all exports
are by multinational firms (Fukunishi et al. [2006]).
Similarity of GDP per capita, $418 in Kenya and $386 in Bangladesh (2003, World Bank [2006])
makes the comparison easier. Both industries produce relatively homogenous products, that is,
low-priced simple garments. Associations of industrial performance with business environment and
of income levels in the two countries. In a comparison between rich and poor countries, such
association is contaminated by the reverse causality; that is, good industrial performance facilitates
good business environment and rich human capital through increased income level. Our comparison
can mitigate such a problem.
2.1 Productivity Measurement
Technical efficiency is estimated from the pooled samples of Kenya and Bangladesh using the
stochastic production frontier model. In this methodology, production frontier represents the
maximum output that technology exhibits given the quantity of inputs, and actual production of an
individual firm may be less than the frontier due to technical inefficiency and a random shock on
production. Assuming a Cobb-Douglas form, a standard production function is expresses as
i i i i i
K
L
TE
error
Y
=
α
β1 β2∗
∗
,where Y: output, K: capital, L: labour, TE: technical efficiency between 0 to 1, error: stochastic
errors with mean at one, and i represents an individual producer. For a firm operating on the frontier,
technical efficiency is equal to one, and between 0 and 1 for those off the frontier.
To understand the effect of labour quality, human capital is incorporated in the function. While the
literature suggested shortage of skilled labour in the African manufacturing sector, production
workers in Kenyan garment firms seem to deal with more variety of tasks than Bangladeshi firms,
and accordingly, indicators of human capital (i.e. share of skilled labour and average tenure) are
higher in Kenyan firms than Bangladeshi firms (will be discussed in the next section). If our
indicators correctly represent labour quality, ignorance of it is likely to overestimate technical
efficiency of Kenyan firms. Then, firstly as a rough measure of human capital, labour is separated to
skilled labour, Ls, and semi-skilled labour, Lu. Secondly, following Hall and Jones [1999], number
of semi-skilled worker is adjusted by their average skill represented by worker’s education and
tenure, as hiLui where . This formulation is similar to the Micerian earning
function in the labour literature, and if earning is related with individual’s productivity, application
Education Tenuer
i
e
of Micerian function will be justified. 1 Then, a production function turns to be,
(
)
Education Tenuer i i i i i i i ie
h
error
TE
Lu
h
Ls
K
Y
2 1 3 2 1 π π β β βα
+=
∗
∗
=
. (1)Estimation is based on log form.
i i i i i i
K
Ls
Lu
Tenuer
Experience
u
v
Y
=
+
ln
+
ln
+
ln
+
(
+
)
−
+
ln
β
0β
1β
2β
3β
3π
1π
2 , (2)where β0=exp(α), ui = - ln(TEi), ui >0 and vi = ln(errori). Inefficiency, ui, is assumed to follow a half
normal distribution, N+(0, σu 2
), or a truncated normal distribution, N+(μ, σu 2
), and the error
component, vi, is assumed to be normally distributed with mean zero, N(0, σv 2
). Separation of vi and
ui from regression residuals (εi= -ui+vi) follows the methodology by Jondrow et al. [1982], which
utilizes the conditional distribution of u given ε derived from the distributional assumption on u and
v. 2 To have a consistent estimation of efficiency between Kenyan and Bangladeshi samples, an
assumption of a common production frontier must be held.
Value added was used instead of gross output as output, because many of the sample firms take
subcontract orders in which material is provided by a buyer. Given that output is measured in value
(will be transformed to quantity index by deflator), subcontractor’s gross outputs do not include
material value, and thus, use of gross output underestimates their outputs. Bruno [1978] justified use
of value added in a production function when share of material to gross output is constant (Leontief
type) and material price is determined in a competitive market. To measure efficiency of
transformation from inputs to output precisely, capital value is adjusted by utilization rate.
There are two potential problems in the estimation. As we have only cross-sectional data, a
distributional assumption on inefficiency component in residuals (u) must be made. Choice of the
distribution may affect estimates of function parameters and technical efficiency, but we do not have
prior knowledge. Then, two different distributions, half normal and truncated normal distribution,
1
Although wages of all the sample firms differ by tenure but not by education, we followed a standard formulation. Soderbom and Teal [2004] and Fraser [2005] used a similar estimation model for firm-level data.
2
were assumed, where the latter is more flexible. Also following Olson et al. [1980], the production
function was estimated without distributional assumption by OLS, and then, technical efficiency was
obtained by method of moments approach. Although distributional assumption is held in the second
step, the possible bias in parameter estimates will be avoided. 3
Secondly, the endogeneity problem on input choice, first discussed by Marschak and Andrews
[1944], may arise, if a firm determines amount of input, particularly labour, knowing its own
productivity that is unobservable for us. Fixed effect model and some estimation procedures, for
example those by Olley and Pakes [1996] and Levinson and Petrin [2003], have been suggested, but
they are not applicable to cross-sectional data. Then, alternatively we take a nonparametric approach
based on the index number theory, which is free from the endogeneity problem. Following Caves et
al. [1982], productivity of individual firm is measured relative to a hypothetical average firm with
average inputs, output, and factor shares by the following formula.
(
) (
)
(
)
(
)
(
Lu
L
u
)
s
s
s
L
Ls
s
s
K
K
s
s
Y
Y
TFP
TFP
i Lu Lu i i Ls Ls i i K K i i iln
ln
2
ln
ln
2
ln
ln
2
ln
ln
ln
ln
−
⎟
⎟
⎠
⎞
⎜
⎜
⎝
⎛
+
−
−
⎟
⎟
⎠
⎞
⎜
⎜
⎝
⎛
+
−
−
⎟
⎟
⎠
⎞
⎜
⎜
⎝
⎛
+
−
−
=
−
,where sn (n = K, Ls, Lu) is factor share of capital, skilled and semi-skilled labour, and the variables
with upper bar (i.e.
ln
Y
) is sample average. Since total factor productivity is deterministically drawn, unlike stochastic frontier model, measured TFP include random shocks on production as wellas measurement errors. It also assumes constant returns to scale and cost-minimization of firms (no
allocative inefficiency is allowed).
2.2 Contribution of inefficiency to competitiveness
With efficiency measures, we then want to know the contribution of efficiency to competitiveness.
In the garment market, competition is determined primarily by quality, delivery and price, while
price and delivery are most important for low-priced products that Kenyan and Bangladeshi firms
3
are producing (Lall and Wignaraja [1994]). Although it is not the sole determinant, price is crucial in
determining the competitiveness of products. Assuming that price competitiveness is represented by
unit cost, we attempt to know how much of the difference of unit costs between Bangladeshi and
Kenyan firms is explained by inefficiency.
Exploiting the duality of the Cobb-Douglas function, the cost function can be obtained from the
production function and the cost minimization condition. With the production function (1), a firm
minimizes cost, Ci = riKi+ wsiLsi + wui(hiLui), where ri is rental price of capital, wsi is wage for
skilled worker and wui is wage for semi-skilled worker adjusted by skill (hi). It is assumed that the
firm may misallocate inputs, and then, actual cost becomes greater than minimum cost (allocative
inefficiency). The first order conditions of cost minimization with allocative inefficiency are
expressed as i i i i i i i i i i i i i i i i i
AE
ws
wu
Lu
h
Ls
AE
r
wu
Lu
h
K
AE
r
ws
Ls
K
3 3 2 2 3 1 1 2 1β
β
β
β
β
β
=
=
=
, (3)where AEni >0 for all n, and it is equal to one when factor allocation is optimal given factor price
ratios.
From the above four equations, the input demand functions are given by
β β β β β β β β β β β β β β β β β β β β β β β β β β β β β β β β β
α
β
β
β
α
β
β
β
α
β
β
β
1 2 3 1 2 2 1 2 1 1 2 2 1 1 2 1 3 1 3 3 1 1 3 1 3 1 1 3 3 1 1 3 1 2 1 3 2 2 1 3 2 3 2 1 3 3 2 2 3 2 1 ⎥ ⎥ ⎦ ⎤ ⎢ ⎢ ⎣ ⎡ ⎟⎟ ⎠ ⎞ ⎜⎜ ⎝ ⎛ ∗ = ⎥ ⎥ ⎦ ⎤ ⎢ ⎢ ⎣ ⎡ ⎟⎟ ⎠ ⎞ ⎜⎜ ⎝ ⎛ ∗ = ⎥ ⎥ ⎦ ⎤ ⎢ ⎢ ⎣ ⎡ ⎟⎟ ⎠ ⎞ ⎜⎜ ⎝ ⎛ ∗ = − − + − + − + − + + − + i i i i i i i i i i i i i i i i i i i i i i i i i i i i AE AE error TE Y wu ws r Lu h AE AE error TE Y ws wu r Ls AE AE error TE Y r wu ws Kwhere β=β1+β2+β3. Multiplying respectively by a factor price, the cost function is given by
i i i i i i i i i i i i i i
r
K
ws
Ls
wu
h
Lu
A
r
ws
wu
Y
TE
AE
C
β β β β β β β β1 2 3 1 1ˆ
)
(
ˆ
=
+
+
=
− , (4)where β α β β β 1 − ⎟⎟ ⎠ ⎞ ⎜⎜ ⎝ ⎛ =
∏
n n n A n=1,2,3,Y
iK
iLs
i(
h
iLu
i)
TE
i 3 2 1ˆ
=
α
β β β (predicted output), and⎥⎦ ⎤ + − −β β β β β β β 3 2 1 2 3 3 3 1 i i i AE AE AE ⎢⎣ ⎡ + = −β β β β β β β β β 2 1 3 2 2 1 1 1 i i i i AE AE AE
AE . The first through sixth terms
on the right hand side compose the cost frontier function, and the last two terms represent dispersion
of actual cost from the frontier; they are the costs of technical inefficiency and allocative inefficiency
respectively.4
AE
≥
1
and equality holds when AEn=1 for all n; the cost of allocative inefficiencyis null when there is no inefficiency in input allocation.
Note that the cost expressed in (4) accounts only for utilized inputs, since capital in the production
function is adjusted by the utilization rate. Thus, actual cost is greater than the cost given by (4) if
the firm has idle capital (in fact most of firms do), and this also should be included in the cost of
allocative efficiency. Adding the cost of idle capital, η, in multiplicative form, the actual cost is
described as
i i i
C
C
=
ˆ
η
,where η≥1. Dividing the cost by predicted output, the unit cost is expressed by factor prices,
production scale, and inefficiency.
i i i i i i i i i i
A
r
ws
wu
Y
TE
AE
Y
C
D
β βη
β β β β β β β1 2 3 1 1ˆ
ˆ
− −=
=
.A comparison of unit cost between Kenyan and Bangladeshi firms and the contribution of each
component to this difference are of our interest. By taking the ratio of the unit cost of firm i to firm j,
we have the following identity.
j j i i j i j i j i j i j i j i
AE
AE
TE
TE
Y
Y
wu
wu
ws
ws
r
r
D
D
η
η
β β β β β β β β β⋅
⋅
⎟
⎟
⎠
⎞
⎜
⎜
⎝
⎛
⎟
⎟
⎠
⎞
⎜
⎜
⎝
⎛
⎟
⎟
⎠
⎞
⎜
⎜
⎝
⎛
⎟
⎟
⎠
⎞
⎜
⎜
⎝
⎛
⎟
⎟
⎠
⎞
⎜
⎜
⎝
⎛
=
− − 1 1 3 2 1ˆ
ˆ
(5)The first to third terms in the right hand side are contributions of the difference of factor prices to the
difference of unit costs, and the fourth term represents the contribution of scale economy. The fifth
4
In the frontier analysis literature, costs of technical and allocative inefficiency are jointly termed as cost (in)efficiency (see for example, Kumbhakar and Lovell [2000]).
term is the contribution of technical inefficiency followed by allocative inefficiency. Use of
production function for decomposition has advantage that effect of technical efficiency and
allocative efficiency can be measured separately, and in more practical aspect, rental price that is
often unobservable is not needed for production frontier estimation. Possible measurement error of
rental price affect only on allocative efficiency estimates but not on parameter estimates and
technical efficiency. Decomposition of unit cost using production function was proposed by
Nishimizu and Page [1986], and our methodology differs with it in incorporating stochastic
efficiency and allowing cross-sectional comparison.5 Also, while Nishimizu and Page [1986]
assumed zero profit to measure cost of allocative inefficiency, non-zero profit is allowed in the
above procedure.
To have decomposition by (5), a cost function must be known. It is noted that the cost function (4)
is deterministic because the stochastic error is absorbed by Yˆ=Y error. Parameters and technical efficiency are given by the production function, and the cost of allocative inefficiency, AE, is calculated from AE, which is estimated from the equation (3). From the definition, η is given by
dividing C by . With this information, the difference of the unit costs of two firms can be
decomposed to factor prices, scale economies and inefficiencies.
Cˆ
2.3 Data
Firm data were collected in Bangladesh and Kenya in 2003 under the UNIDO COMPID project.
The sample was drawn from firms with more than 10 employees, and the data consist of 222 firms in
Bangladesh and 71 firms in Kenya. The number of samples reflects the size of industry, where the
Bangladeshi industry has more than 3000 firms and the Kenyan industry is estimated to consist of
120-150 firms.6 While the Bangladeshi sample was drawn by stratified sampling method, the
Kenyan sample is a result of exhaustive survey based on several incomplete firm lists due to
5
Nishimizu and Page [1986] decomposed growth rate of unit cost based on time-series data, while we decompose ratio of unit costs across observation units.
6
non-existence of a complete list. 7 It is noted that main characteristics of Kenyan sample are
comparable with those from the World Bank firm survey in 2003. Excluding outliers and those with
insufficient information, 165 firms in Bangladesh and 47 in Kenya were retained for analysis.
Output values were collected in local currency. Although purchasing power parity (PPP) is the
standard instrument for converting value in local currency to quantity index utilizing it as an
international price deflator, we have used exchange rate instead of PPP because of the following
reasons. All products of Bangladeshi firms and multinational firms in Kenya are exported and priced
in US or EU markets, and thus, conversion by exchange rate is appropriate. On the other hand, most
Kenyan local firms supply to the domestic market, but comparisons of prices in the Kenyan and
US/EU markets showed that exchange rate is more consistent international price deflator than PPP. 8
Since the exchange rate gives a higher price to Kenyan products than the PPP, deflation by the
exchange rate leads to a smaller output quantity index of Kenyan local firms, and results in lower
technical efficiency estimates than deflation by the PPP.
Capital value and the number of employees are used as input, where capital value was constructed
using the perpetual inventory method and converted by the exchange rate.9 Use of the exchange rate
is reasonable provided that all equipment is imported in the both countries.
Regarding factor prices, wages are obtained as labour costs per worker, while capital rental price
is not explicitly observable. Rental price can be estimated from capital service cost, which is
available in the dataset, but reported capital service cost does not include interest and/or dividends
for owner’s contribution to capital purchase. Therefore, rental price was estimated from the arbitrage
condition of investment. Assuming all investments yield the same rate of return and perfect foresight,
the arbitrage condition is
),
(
, 1 , , , ,t it it it it i ir
p
p
p
p
R
=
−
δ
+
+−
where R: rate of return (real interest rate), δ: depreciation rate, and pt: asset price of capital at t. Since
7
The last census of Kenyan industry was carried out in 1977. See Appendix 1.1 for sampling method.
8
See Appendix 1.4 regarding choice of an international price deflator.
9
all firms have used imported equipment, it is assumed that asset prices are same for all samples, pi =p.
Arranging the arbitrage condition, rental price is given as
t t t t i t i
p
p
p
p
R
r
⎟⎟
⎠
⎞
⎜⎜
⎝
⎛
−
−
+
=
+1 ,δ
. (6)The real interest rates of Kenya and Bangladesh were obtained from World Development Indicators.
For multinational firms which often finance investment in a home country, the real interest rate of
India where many of them originate was used. The asset price change was calculated from the US
deflator, and thus, it is common to all observations. Given all equipments imported, asset price, pt, is
assumed constant for all observations, and is normalized at pt=1. Consequently, the rental price of
capital varies with nationality of firms and does not consider individual price variation according to,
for example, credit constraint.
This may cause downward bias in estimation of allocative efficiency for firms suffering severe
credit constraint (these firms may be misestimated as less efficient than actual). To check the bias,
alternative rental price is estimated from the reported capital service cost and compared with one
based on the equation (6). The two estimates are similar and the main results of analysis do not alter
(see Appendix 1.5). Note that estimates of production function parameters and technical efficiency
are not affected by the estimates of rental price.
3. Empirical Analysis
3.1 Overview of the Statistics
Reflecting the strong export orientation of the Bangladeshi garment industry, all Bangladeshi
samples are exporting their products to the US and/or EU markets. On the other hand, only seven
firms export to those markets in the Kenyan samples and the rest supply to the domestic or African
markets. Major exporters are multinational firms established after 2000, and they are registered as an
in operation at the time of the survey, of which five firms are included in the sample. Growth of
exports was so rapid that production for the US market has far exceeded that for the domestic market,
but local firms in Kenya have not responded to the export boom and remained in the domestic
market with a few exceptions.
Basic production statistics of the sample firms are described in Table A. It shows that on average,
Bangladeshi firms are about five times larger than Kenyan local firms in production, while Kenyan
EPZ firms are the largest among the three groups. In terms of inputs, Kenyan firms are more capital
intensive than Bangladeshi firms on average, and this is consistent with the relative factor prices as
we will see later. It also indicates that Bangladeshi firms are highly profitable; the average share of
profit to value added is about 70%, while the profit share of Kenyan firms, including EPZ firms, is
much less.
From the author’s field observation, the production system appears different between Kenyan
local firms (non-exporters) and other firms (exporters) in two aspects. Exporters to US/EU markets
have highly decomposed assembly lines where machine operators specialize in small tasks, while
Kenyan local firms have less decomposed lines, or sometimes no assembly line in the sewing
process. In such cases, one operator sews a whole product. Secondly, the number of floor-level
workers per sewing machine in Kenyan local firms is less than that of exporting firms. 10 This means
that they allocate fewer helpers to assembly lines, and thus, operators in a Kenyan local firm have to
cover a wider range of processes than those in an exporting firm. Accordingly, Kenyan local firms
show the longest average tenure of operator and highest share of skilled worker among all (Table A).
This may indicate that labour is substituted by skill of workers. Kenyan EPZ firms, on the other hand,
maintain a highly decomposed assembly line whereas number of worker per machine is less than
Bangladeshi firms. They equip new and high-tech equipment (i.e. specialized and computerized
sewing machine), and thus, labour seems to be substituted by machines.
Unit cost is defined as capital and labour service costs per value added, and capital service cost
10
The average number of floor-level workers per sewing machine is 1.78 for Bangladeshi firms, 1.47 for EPZ firms and 1.13 for Kenyan local firms (the number of sewing machines is adjusted by the utilization rate and workers are restricted to those working in sewing section so that the figure reflects the production characteristics in sewing process).
includes only equipment. The average unit cost of a Kenyan local firm is 2.46 times higher than that
of Bangladeshi firms. It is partly explained by the labour cost per worker, given that the labour cost
in Kenyan local firms is 2.84 times higher, while the rental price and average labour productivity is
almost same between the two groups. Cost statistics of EPZ firms shows a similar trend though their
unit cost and labour cost are slightly lower.
Cost structure is consistent with market performance of the garment industry in two countries.
With high production costs, Kenyan firms cannot compete with imports in the domestic market. In
the export market, increased competition due to abolishment of the quota system leads to stagnation
of Kenyan export while the Bangladeshi industry has kept growing. Cost statistics clearly shows that
the Bangladeshi industry performs better than the Kenyan industry in the liberalized export market.
Cost statistics also shows that wage in Kenyan firms is strikingly high; the average wage in
Kenyan local firms is 2.8 times higher than that of Bangladeshi firms. Due to relatively high wages,
Kenyan firms have employed more capital and less labour than their Bangladeshi counterparts, but
capital intensity does not raise labour productivity enough to cancel the high labour cost. Simple
statistics, however, do not indicate why labour productivity has remained relatively low. It can be
attributed to misallocation of inputs (too little capital), inefficient production, or smaller size of
Kenyan local firms in the case of increasing returns to scale. The sources of the unit cost difference
will be approached in the following sections.
3.2 Measurement of Technical Efficiency
The main production activity in the garment assembly process includes two different types of
work; sewing and knitting. While woven garments such as woven shirts and trousers are made by
only a sewing process, knitting garments like T-shirts and sweater are made by a knitting process and
occasionally a sewing process. The technology of the two processes differs, and thus a dummy
variable, Sewing, is included in the estimation model to distinguish the firms with a sewing process
from those who have an only knitting process. Heteroskedasticity test indicated group-wise
auxiliary models are added to estimate σui and σvi, as lnσui= δ1(1, Sewingi) and/or lnσvi= δ2(1,
Sewingi). Significant correlation is reported only for σvi. A dummy for Kenyan local firms, Klocal, is
also added to pick up possible difference in productivity according to production system.
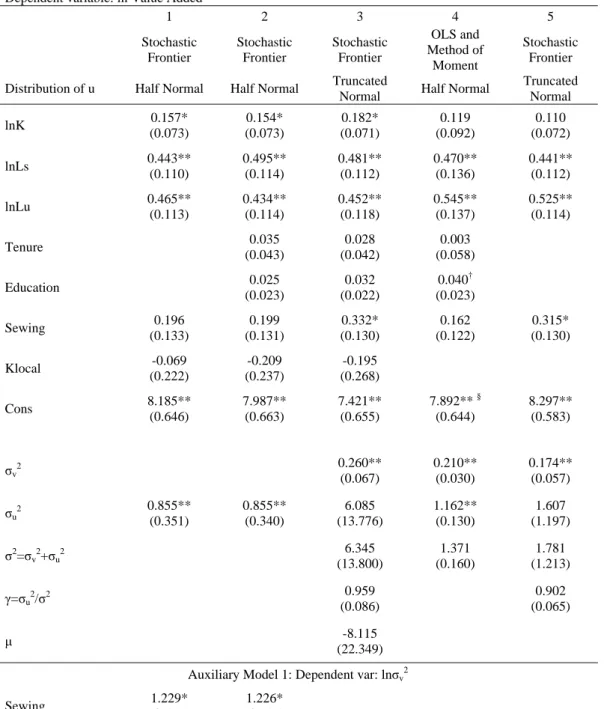
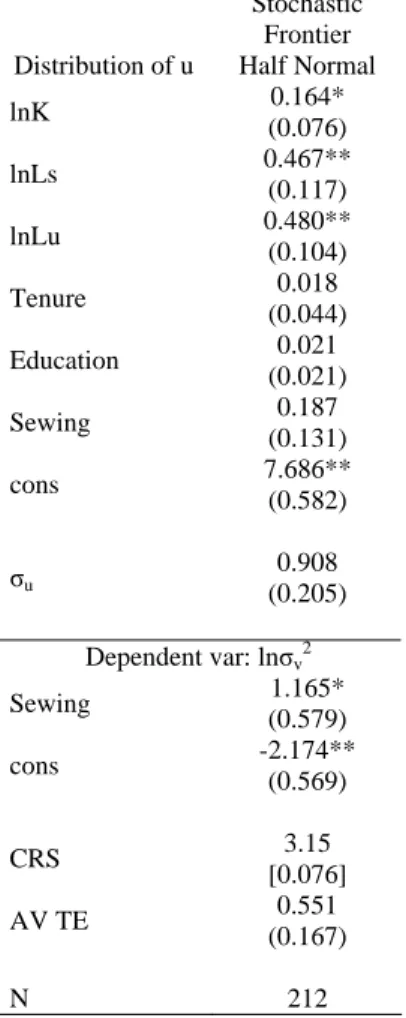
The benchmark model assuming a half normal distribution for inefficiency has yielded
significant coefficients on inputs and the process dummy (Sewing), and variance of inefficiency (σu)
is also significantly different from zero at 5% level (column 1 in Table C). Estimated coefficient for
capital is 0.16 and those for skilled and semi-skilled labour are 0.44 and 0.47 respectively. Though
elasticity of skilled worker is slightly smaller, marginal productivity is substantially greater than
semi-skilled worker. 11 Constant returns to scale can not be rejected at 10% level. The Kenyan local
dummy is also not significant, and this implies that Kenyan local firms are not technically different
from the others. In column 2, a model with average tenure and education was reported. While
parameter estimates for inputs are remained similar, those for average tenure and education had a
right sign but not significant.
The assumption of a half normal distribution of inefficiency was replaced by a truncated normal
distribution that allows a mode of distribution having any positive values (column 3). The result is
quite similar to the benchmarked model with slightly larger coefficient for capital. It is noted that
variance and the mode of inefficiency (σu and μ) do not significantly differ from zero, that is, there is
no statistical support for a truncated normal distribution. OLS estimate which does not require
distributional assumption on inefficiency is reported in column 4. It yielded lower parameter for
capital and higher parameter for semi-skilled worker, but they are relatively small change. Overall,
parameter estimates are stable over variation of estimation models.
The result that production system dummy, Klocal, was insignificant suggests that production
system of Kenyan local firms is technologically equivalent to that of exporters. 12 This is reasonable
because a short assembly line is more efficient when production scale is small. Two systems share
11
Marginal productivities for skilled and semi-skilled worker at the mean level are $10523 and $1179, respectively. Reversal of the relationship between elasticity and marginal product is due to smaller number of skilled worker than semi-skilled worker.
12
Different coefficient on inputs for Kenyan local firms is also rejected at 10% level (the result not reported).
the same technology but differ in the optimal size of production. We predicted that labour is
substituted by skill of worker rather than capital in Kenyan local firms from the field observation.
Parameter estimates for skilled and semi-skilled worker are robustly significant and suggested
skilled worker has higher marginal productivity, while tenure and education remained insignificant.
Education may not represent skill given that education does not affect wages in semi-skilled worker.
In contrast, the wages differ by tenure. Tenure that counts experience only in the current firm may be
an incomplete measure of skill if skills are not firm specific and experience in other firms can be
effective. This is left for further investigation. However, it is noted that Kenyan local firms
substituted semi-skilled labour by skilled labour in order to reduce total labour intensity.
Based on the above results, technical efficiency is recalculated excluding the Kenyan local
dummy from the estimation model to avoid that insignificant but negative effect of the dummy gives
overestimation of Kenyan local firms. Group-wise heteroskedasticity is kept controlled as ignorance
yields a bias in estimates of technical efficiency (Kumbhakar and Lovell [2000]). The averages of
technical efficiency are 0.55 (column 1 and 2 in Table C). These estimates are comparable to results
of the other studies measuring technical efficiency of garment industry.13 Sample is divided to
Bangladeshi, Kenyan local and Kenyan EPZ firms and group averages of the technical efficiency are
also listed. Comparison demonstrated that difference among the three group averages is small in the
both models. In particular, the average of Kenyan local firms and Bangladeshi firms are very close,
and difference is not significant at 10% level in all the estimates. Because of control of labour
quality of semi-skilled worker, the average technical efficiency of Kenyan local firms in column 2 is
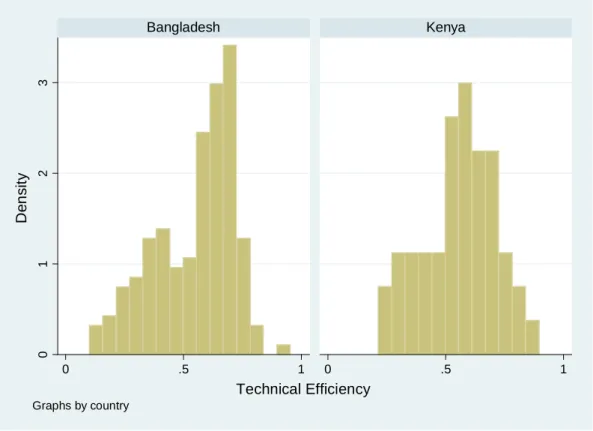
slightly smaller, while it is opposite for the Bangladeshi average. Distribution of technical efficiency
indicates that outlier does not affect the averages (Figure A).
Alternative methodologies did not alter the relationship of average efficiencies by the firm group.
The method of moments approach based on OLS residuals yielded lower technical efficiency overall
(0.503), but the average of Kenya local firms does not significantly differ from the Bangladeshi
13
The studies of Columbian and Indonesian textile and garment industries reported that the average technical efficiency is 0.55 and 0.63 (Tyler and Lee [1979], Hill and Kalirajan [1993]). The studies of African textile and garment industries reported mean technical efficiency ranging from 0.40 to 0.69 (Biggs et al. [1995], Mazumdar and Mazaheri [2003], Mlambo [2002], Lundvall et al. [2002]).
average (column 3 in Table C). For relative TFP by the index number approach, while Kenyan local
firms marked lower score, the averages of the two groups are not statistically significant (column 4).
In terms of transformation of input to output, Kenyan local firms are on average as efficient as the
Bangladeshi firms that have been competitive in the US and EU markets for more than two decades.
Estimation also indicates that the technical efficiency of firms participating in the global
production network is not higher than those not participating. This result appears inconsistent with
the literatures on FDI spillover and learning-by-exporting that showed technological advantage of
the firms in global production network.14 It may not be surprising, because, as mentioned, exporters
are not necessarily a technical leader of the production system for a domestic market. In addition,
average technical efficiency of Kenyan local firms may have been increased by shrink of the
industry for a last decade, which accelerated inefficient producer’s exit. Yet, this does not necessarily
mean that local firms can start production for the export market immediately. From the author’s field
interviews, it appears that local firms attempting to enter the export market have learned the design
of production lines, quality control, sewing skills, and market linkages from EPZ firms and
expatriates. Participation in the global production network needs substantial learning by firms as
argued in the literature. Our results indicate that Kenyan local firms manage their own production
system as efficient as Bangladeshi exporters do, but they do not imply that Kenyan firms are capable
to supply to the export market without learning.
Impacts of business environment and managerial skill, which are argued as a source of poor
performance of the African manufacturing sector were investigated. Firm-level information of
business environment and manager’s characteristics is collected (Table D). It shows that delay of
material delivery is most frequently occurred in EPZ firms probably because of import of Asian
fabrics, and duration for sales collection is longest in Kenyan local firms. The most frequent
blackout is reported by Bangladeshi firms. Overall, no clear difference in the business environment
was detected between the two countries. This is consistent with the fact that Bangladesh is evaluated
14
Although causality between export performance and productivity, and foreign ownership and productivity can be endogenous, superior performance of multinational firms than local firms are generally supported by empirical studies (Crespo and Fontoura [2007]).
as one of the worst countries in terms of governance. For instance, World Bank Institute [2007]
ranked it in the bottom quarter of the world with respect to ‘rule of law’ and ‘control of governance’.
In terms of manager’s characteristics, managers of export firms were received higher education
whereas experience is longer for those in Kenyan local firms.
Their impacts on technical efficiency were tested. Following the method by Kumbhakar, Gosh and
McGuckin [1991], an exogenous variable is assumed to be correlated with efficiency through the
mode of its distribution (μ) as
i i i i i i i i
K
Ls
Lu
u
v
Y
φW
=
+
−
+
+
+
=
μ
β
β
β
β
ln
ln
ln
ln
0 1 2 3 , where ui ~ N + (μi, σu 2 ) , vi ~ N (0, σv 2). 15 Wi is a vector of the variables related with manager’s
characteristics and business environment, namely manager’s education dummy (M-edu, =1 with post
secondary education and =0 otherwise), years of manager’s total experience in the industry (M-exp),
frequency of delivery delay (Delivery), days to collect sales (Sales Collection), days of blackout
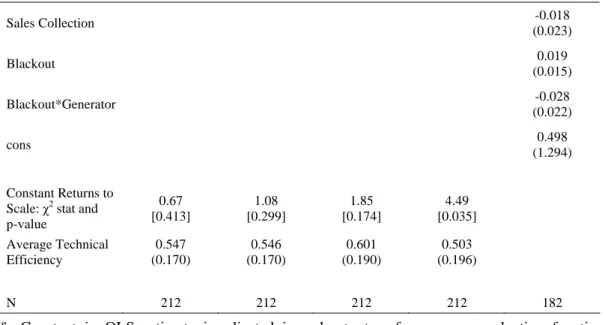
(Blackout) and its interaction with possession of a generator (Blackout*Generator). The result is
shown in Table C (column 5). Coefficients of all the variables except Sales Collection have right
sign, where a negative sign means that increase of the variable leads to reduction of inefficiency, and
higher technical efficiency. However, they are not statistically significant at 10%. Business
environment and human capital appear to have a weak association with productive performance.
This may be interpreted that due to simple and matured technology, production of low-priced
garments is less sensitive to business environment, and dose not necessarily require high education
and experience. Analysis of production function indicated that gap of technology, human capital and
surrounding business environment between internationally competitive firms and local firms is not
large, and this allows many firms in low-income countries to compete in the world market.
3.3 Decomposition of Unit Cost Difference
15
This method can avoid unrealistic assumption that exogenous variables (Wi) are irrelevant to
output, which is necessary when they are directly regressed on technical efficiency (Kumbhakar and Lovell [2000]).
Based on the estimates of technical efficiency, allocative efficiency, and parameters of the
production function, unit cost difference and its decomposition are estimated by the equation (5).
Production function estimate is based on the model without worker’s tenure and education and the
Kenyan local dummy, because of the persistent insignificant signs. So, human capital weigh in the
equation (5), hi, is assumed to be one.
The first column of Table E shows the estimations of each component of equation (5) based on the
mean values of Bangladeshi and Kenyan local firms, benchmarking on the Bangladeshi mean (it is a
denominator). It indicates that the mean unit cost of Kenyan locals is 2.39 times higher than that of
Bangladeshi firms.16 The following figures in the column are contribution of factor prices, scale
economies and inefficiencies and if it is greater (smaller) than one, the component contributes to
increase (decrease) the unit cost of Kenyan local firms relative to Bangladeshi firms. The difference
in semi-skilled wages between the two groups makes the greatest contribution, inflating Kenyan unit
cost by 56.2%, followed by skilled wage that pushed up the cost by 31.2%. Jointly, wage increased
the cost of Kenyan local firms by 104.9% (1.562*1.312 = 2.049). This is primarily because of the
large difference of wages between the two groups and relatively large contribution of labour to
production. The average of semi-skilled and skilled wages in Kenyan local firms is higher than the
Bangladeshi average by 2.8 times and 2.3 times respectively.
Relatively small size of production of Kenyan local firms increased cost by 14.4% due to scale
economy. Technical inefficiency actually contributed to decrease relative costs by 8.0%, because the
average of Kenyan local firms is slightly higher. Contribution of allocative inefficiency is estimated
to increase by 15.6% and rental price slightly contributed to lower the cost by 1.1%. These two
contributions are prone to the possible measurement error of rental price, but estimation using the
alternative rental price estimates based on the reported data generated only slight changes to them. 17
16
This figure is slightly different from ratio of the average unit costs obtained from Table A. This is because the figure in Table E is calculated from mean factor prices, scale economy, and efficiencies
tail.
of Bangladeshi and Kenyan local firms, while the figures in Table A are simply the sample average of unit costs. The figure in Table E indicates the difference of unit costs between the hypothetical average Kenyan and Bangladeshi firms endowed with average characteristics.
17
With the alternative rental price, contributions of allocative efficiency is 1.136 (13.6% increase) and rental price is 1.004 (0.4% increase) respectively. See Appendix 1.5 for the de
The comparison based on the average demonstrates that the large gap of unit costs between the two
groups is mainly resulted from the difference in wages and to a much lesser extent, by scale
economy and allocative inefficiency. Joint contribution of technical and allocative efficiencies is
6.4% increase (0.920*1.156 = 1.064), almost neutral to the cost. The same picture emerges when
comparing EPZ firms with Bangladeshi firms (column 2 in Table E).
Kenyan local firms are separated to two groups according to unit cost (lower 50% and upper
50%) and compared with the Bangladeshi mean respectively (Figure B). Comparing the two groups,
the lower 50% group is found to produce at half cost of the upper 50% group. The former has lower
value for all the components except the rental price set to be equal, and in particular contribution of
wages for both skilled and semi-skilled are substantially lower than the upper 50% group. While
better performers have higher technical and allocative efficiency, cost reduction is brought mainly by
lower wages.
Wage table of the sample firms indicates that wage of semi-skilled worker differs by tenure but
not by education and gender (Fukunishi et al [2006]). Given the considerable difference in the
average tenure between Kenyan local and the other firms, a part of the wage gap can be attributed to
the difference of tenure. Although the average tenure was not significantly correlated with
production, netting out its effect on wage will exclude a possible effect of skill on wage. Then,
conditional wage at the mean tenure gives comparison of the wage netting out the difference in
tenure. Mincerian wage function was estimated,
i i i
i i
i
Tenuer
Sewing
Klocal
Kenya
w
=
ρ
0+
ρ
1+
ρ
2+
ρ
3+
ρ
4+
ε
ln
,where Kenya is a country dummy. The process and Kenyan local dummies (Sewing and Klocal) are
to incorporate a possible systematic difference of wage by process and production system. The
country dummy is expected to capture difference of the labour markets in the two countries.
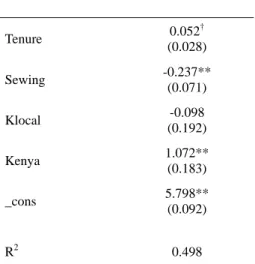
The regression yielded significant coefficient estimates for tenure, the process dummy, and the
country dummy (Table F). It indicated small elasticity for tenure; 1% increase of tenure leads to
0.05% of increase of wage, while change of the country dummy from one to zero is associated with
s reduction of wage to half. That is, most of wage difference between Kenyan and Bangladeshi firm
is associated with country specific factors such as labour market conditions. Based on the result,
wage conditioned by tenure was calculated and its impact on unit cost was obtained (Table G). As
expected, it does not make substantial change in contribution of wages.
World Bank report on Kenyan manufacturing sector noted high wage level in the sector. It
reported that unit labour costs of Kenyan industries are higher by 20-50% than that of India and
C
that minimum
w
. Conclusion
gued that African firms have performed lower productivity than firms in other
eveloping countries, and it is a critical source of weak competitiveness under globalization. A
hina (Blattman et al [2004]). Our result showed that difference is greater when compared with
low-income Asian countries, with which Kenyan firms are competing in the domestic and export
markets. And more importantly, it demonstrated that such difference is brought mostly by wage
difference while technical and allocative efficiencies plays minor role. Most of the wage difference
was not attributed to skill in the comparison of Kenyan and Bangladeshi industries.
What causes the wage difference between Kenya and Bangladesh despite quite similar GDP per
capita? Although responding this question is beyond scope of this paper, it is noted
ages in the two countries show a large divergence; 64.5US$ per month in Kenya and 16.0US$ in
Bangladesh. 18 As semi-skilled wage is affected by the level of minimum wage, it is a basis of the
large wage gap. Furthermore, wages converted by PPP shows much smaller difference; the
semi-skilled wage for Kenyan firms is higher by only 33.8% than that of Bangladeshi firms
(conditioned at the mean tenure). This indicates that much of the difference of wages (and minimum
wages) reflects difference of price level of the two countries, and Kenyan workers are not better off
than Bangladeshi workers as appeared in the exchange-rate converted wages.
4
It has been ar
d
18
The minimum wages are from Kenya Gazette Supplement No.43 and Bangladesh Gazette on January 12, 1994, converted by the exchange rates in 2003. The Bangladeshi minimum wage has been raised to US$28.6 in 2006 after a long freeze since 1994, which is closer to the semi-skilled wage in our data.
comparison of Kenyan firms with Bangladeshi firms in the garment industry indicates that Kenyan
local firms operate as efficiently as Bangladeshi firms on average in terms of transforming input to
output, despite conservative estimates. This result is robust to methodology of productivity
measurement. It is notable because Kenyan local firms have little experience in the US/EU markets
while Bangladeshi firms have been successfully competing in the world market for decades. As
argued in the literature, business environment and human capital (particularly for production
workers) is poor in Kenyan firms. Yet, because of relatively simple and matured technology, the
garment industry is less sensitive to business environment and does not require high human capital.
Poor endowment does not seem to significantly affect productivity of Kenyan local firms, and
furthermore, internationally competitive Bangladeshi firms are also operating in poor business
environment.
However, a large gap between the two groups was found in price competitiveness measured as
unit cost; the unit cost of Kenyan local firms was 2.5 times greater on average. The difference of
ge in Southern African countries is as high as one in Kenya.19 Wages in CFA Fran
average unit costs was decomposed based on the production frontier estimation. It revealed that the
difference of wages between the two groups explained most of the unit cost difference, and technical
inefficiency contributed to slightly reduce the cost gap. Kenyan local firms incur higher unit cost
primarily due to higher wages, and the inefficiency of technological management makes a minor
contribution.
Relatively high labour cost to Asia is not peculiar to Kenya. According to Gibbon [2003],
operator’s wa
countries are also generally higher than Asian countries (Rama [2000], Mbaye and Golub [2003]).
Adverse effect of wages on competitiveness is likely to be most significant in garment industry
considering its labour intensiveness. However, given that it is most technically feasible for
low-income countries, and it preceded industrialization in many of Asian countries, wage may be
one of the important factors in African industrial development. Since the wage gap is corresponded
19
The monthly wage for operators in Lesotho is 100 US dollars, 80 US dollars in Swaziland, 130-180 US dollars in urban areas of South Africa (Gibbon [2003]), while our data in Kenya is 87-89US$ for local firms, and 68-80 for EPZ firms.
with the poverty line gap in our case, reduction of wage is likely to aggravate poverty in the region.
As the Mauritian case shows, the industry can remain competitive with relatively high labour cost
through improvement of efficiency and upgrading from bottom-end to middle rage market. 20
Improvement of productivity is a possible solution for African manufacturing sector.
20
References
Adenikinju, Adeola, Ludvig Södering, Charles Soludo and Aristomène Varoudakis [2002] "Manufacturing Competitiveness in Africa: Evidence from Cameroon, Cote d'Ivoire, Nigeria, and Senegal," Economic Development and Cultural Change, Vol.50, No.3.
Biggs, Tyler, Manju Shah and Pradeep Srivastava [1995] Technological Capabilities and Learning in African Enterprises, World Bank Technical Paper No.25, Washington D.C.: World Bank.
Bigsten, Arne and Mulu Gebreeyesus [2007] “The Small, the Young, and the Productive: Determinants of Manufacturing Firm Growth in Ethiopia,” Economic Development and Cultural Change, Vol.55, No.4, PP.813-840.
Bigsten, Arne, Paul Collier, Stefan Dercon, Bernard Gauthier, Jan Willem Gunning, Anders Isaksson, Abena Oduro, Remco Oostendorp, Cathy Pattilo, Mans Soderbom, Michel Sylvain, Francis Teal and Albert Zeufack [2000] Exports and Firm-level Efficiency in African manufacturing,
Center for the Study of African Economies Working Paper 2000-16, Oxford University.
Blattman, Christopher, Linda Cotton, Vyjayanti Desai, Ibrahim Elbadawi, James Habyarimana, Jean Michael Marchat, Vijaya Ramachandran, Manju Keida Shah, Kehnide Ajayi, Peter Kimuyu, Rose Ngugi, Arne Bigsten and Måns Söderbom [2004] Enhancing the Competitiveness of Kenya’s Manufacturing Sector: The Role of the Investment Climate, Africa Private Sector
Group, Word Bank.
Bruno, Michael [1978] “Duality, Intermediate Inputs and Value-added,” in Fuss and McFadden eds.,
Production Economics: A Dual Approach to Theory and Applications, Amsterdam;
North-Holland Publishing Company.
Collier, Paul [2007] The Bottom Billion: Why the Poorest Countries Are Failing and What Can Be Done about It, New York; Oxford University Press.
Collier, Paul and Jan Willem Gunning [1999] “Explaining African Economic Performance “, Journal of Economic Literature, Vol.37. No.1, pp.64-111.
Crespo, Nuno and Maria Paula Fontoura [2007] “Determinant Factors of FDI Spillovers: What Do We Really Know?”, World Development, Vo.35, No.3, pp.410-425.
Fafchamps, Marcel [2001] “Networks, Communities and Markets in Sub-Saharan Africa: Implications for Firm Growth and Investment,” Journal of African Economies, No.10 (Suppl.2),
No.1, pp109-142
Frazer, Garth [2005] “Which Firms Die? A Look at Manufacturing Firm Exit in Ghana,” Economic Development and Cultural Change, Vol.53. No.5, pp585-617.
Fukunishi, Takahiro, Mayumi Murayama, Akio Nishiura and Tatsufumi Yamagata [2006]
Industrialization and Poverty Alleviation: Pro-poor industrialization strategies revisited,
UNIDO Research Programme Report, United Nations Industrial Organization.
for Clothing,” World Development, Vol.31, No.11.
Hall, Robert E. and Charles Jones [1999] “Why Do Some Countries Produce So Much More Output Per Worker than Others?” The Quarterly Journal of Economics, Vol.114, No.1, pp.83-116.
Hill, Hall and Kalirajan, K.P. [1993] “Small Enterprise and Firm-Level Technical Efficiency in the Indonesian Garment Industry”, Applied Econometrics, Vol.25, No.9, pp.1137-1144.
Jondrow, J, C.A.K. Lovell, I.S. Materov, and P. Schmidt [1982] “On the Estimation of Technical Inefficiency in the Stochastic Frontier Production Function Model,” Journal of Econometrics, Vol. 19, No.2-3, pp.233-238.
Kumbhakar, S.C., S. Gosh and J.T. McGuckin [1991] “A Generalized Production Frontier Approach for Estimating Determinants of Inefficiency in US Dairy Farms,” Journal of Business and Economics Statistics, Vol.74, No.2, pp.231-239.
Kumbhakar, Subal C. and C.A. Knox Lovell [2000] Stochastic Frontier Analysis, Cambridge;
Cambridge University Press.
Lall, Sanjaya ed. [1999] The Technological Response to Import Liberalization in SubSaharan Africa,
London: MacMillan Press LTD.
Lall, Sanjaya and Ganeshan Wignaraja [1994] “Foreign Involvement and Garment Exports by Developing Countries,” Asia-Pacific Development Journal, Vol.1, No.2, pp.21-48.
Levinson, James and Amil Petrin [2003] “Estimating Production Functions Using Inputs to Control for Unobservables, Review of Economic Studies, Vol.70, No.2, pp.317-341.
Lindauer, David L. and Ann D. Velenchik [1994] “Can African Labour Compete?” in David L. Lindauer and Michael Romer eds., Asia and Africa: Legacies and Opportunities in Development, San Francisco; Institute for Contemporary Studies, pp.269-304.
Lundvall, Karl, Walter Ochoro and Lennart Hjalmarsson [2002] “Productivity and Technical Efficiency,” in Bigsten and Kimuyu eds., Structure and Performance of Manufacturing in Kenya, Hampshire: Palgrave, pp.151-172.
Marschak, Jacob and William H. Andrews [1944] “Random Simultaneous Equations and the Theory of Production”, Econometrica, Vol.12, No.3&4, pp.143-205.
McCormick, Dorothy, Peter Kimuyu, and Mary Njeri Kinyanjui [1999] Institutions and the Industrialisation Process: A Proposal for a Study of the Textile and Textile Products Industry in Kenya, IDS Working Paper, No.527, Nairobi; University of Nairobi.
McCormick, Dorothy and Christian Rogerson eds., Clothing and Footwear in African Industrialisation, Pretoria; Africa Institute of South Africa.
Mbaye, Ahmadou Aly and Stephen Golub [2003] "Unit Labour Costs, International Competitiveness, and Exports: The case of Senegal," Journal of African Economies Vol.11 No.2, pp.219-248.
Mazmudar, Depak and Ata Mazaheri [2003] The African Manufacturing Firm: An Analysis Based on Firm Surveys in Seven Countries in Sub-Saharan Africa, London: Routledge.