Chapter 1 Thai Labour Market in Transition
Toward a Knowledge-Based Economy
権利
Copyrights 日本貿易振興機構(ジェトロ)アジア
経済研究所 / Institute of Developing
Economies, Japan External Trade Organization
(IDE-JETRO) http://www.ide.go.jp
シリーズタイトル(英
)
ASEDP
シリーズ番号
66
journal or
publication title
Human Resource Development Toward A
Knowledge-Based Economy: The Case of Thailand
page range
1-39
year
2003
Chapter 1
THAI LABOUR MARKET IN TRANSITION
TOWARD A KNOWLEDGE-BASED ECONOMY
Chanin Mephokee 1. INTRODUCTION
The revolution of information and communications technology (ICT) has been progressing on a global scale with the rapid advancement of computer and communications technologies. The ICT Revolution, like the Industrial Revolution in the 18th century, has changed world society. While the Industrial Revolution changed agricultural society to industrial society, the ICT Revolution is going to change contemporary society into a knowledge-based society.
Thailand has long opened itself to the global economy. As a small developing country, Thailand plays the role of the ICT consumer that adopts this new technology, for both consumption and production, to improve the quality of life and to improve productivity. Moreover, Thailand also plays the role of an ICT producer; the country has been attracting foreign direct investment in the ICT industry.
The necessary condition to be successful as both an ICT consumer and an ICT producer is the quality of human capital. In 2002, there were 34 million people in Thailand’s labour force. As the country moves toward a knowledge-based economy (KBE), its labour force will be affected directly and i n d i r e c t l y. The knowledge-based economy will change the employment patterns in job creation, job destruction and job switching.
There are two objectives for this chapter. First, it attempts to explain the structural change in the Thai labour market and the structural change in Thai industry. The paper points out that, due to the changes in Thai industry, the country has been moving toward a knowledge-based economy,
skills. However, the Thai labour market has not improved significantly in labour quality. Therefore, the Thai labour market is not ready for the new era of knowledge-based economy.
The second objective is to investigate the attempt by both public and private sectors to cope with the era of a knowledge-based economy. The first part investigates ICT-related industrial policies in regards to human resource development, and then it investigates the strategies by Thai firms in ICT-related industries on human capital improvement.
2. STRUCTURAL CHANGE IN THE LABOUR MARKET 2.1 Labour Force
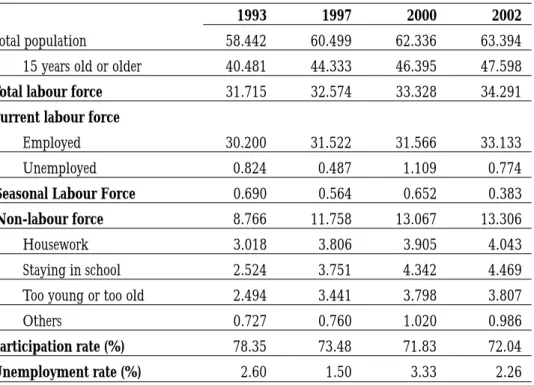
According to the Thai Labour Act 1998, all workers must be aged 15 years or older. In 2002, the total population in Thailand was estimated to be 63.39 million people. Among them, 75.07 percent, or 47.59 million persons, were aged 15 or older. The average increase in this age group annually is 74,817 persons, which is higher than the average increase of the total population at 553,179 persons. However, the increase of people in this age group has been decreasing for the past ten years by 221,167 persons a year, on average. Therefore, Thailand is entering the beginning stage of an aging society. This phenomenon can be seen in most developed countries.
Among the 47.59 million people in the 15 and older population group, 34.29 million, or 72.95 percent, of them comprise the total labour force. The remaining 13.3 million persons are not in the labour force; they may work at home, are in school or are too old to work.
However, the growth rate of the total labour force is lower than the growth rate of persons outside the labour force. Therefore, the labour force participation rate has been decreasing for the past decade. In 1993, the labour force participation rate was 78 percent, but in 2002 it was 72 percent.
The main reason for staying outside the labour market is school enrolment. Approximately 34 percent, or 4.469 million persons, were enrolled in schools in 2002. As a result of social and economic development for the past ten years, more teenagers are willing to stay longer in school. Compared to the
population in this age group in 1993, the number of people staying in school in 2002 had increased by 77.06 percent.
For the past ten years, the number of employed people increased at the same rate as the labour force, except during the financial crisis that began in late 1997 and continued through 1999. During that period, the unemployment rates soared to 3.99 percent (1998) and 4.08 percent (1999). Since 2000, the Thai labour market appears to be recovering. Details on the Thai labour force are shown in Table 2.1.
Table 2.1: Population by Labour Force Status, 1993-2002
unit: millions
1993 1997 2000 2002
Total population 58.442 60.499 62.336 63.394
15 years old or older 40.481 44.333 46.395 47.598
Total labour force 31.715 32.574 33.328 34.291
Current labour force
Employed 30.200 31.522 31.566 33.133
Unemployed 0.824 0.487 1.109 0.774
Seasonal Labour Force 0.690 0.564 0.652 0.383
Non-labour force 8.766 11.758 13.067 13.306
Housework 3.018 3.806 3.905 4.043
Staying in school 2.524 3.751 4.342 4.469
Too young or too old 2.494 3.441 3.798 3.807
Others 0.727 0.760 1.020 0.986
Participation rate (%) 78.35 73.48 71.83 72.04
Unemployment rate (%) 2.60 1.50 3.33 2.26
Source: Labour Force Survey 1993-2002, National Statistics Office
The Thai labour market has shown high flexibility to the changes in economic variables for the past ten years and has had a long-running steady growth along with an aging society.
2.2 Employment Employment by sector
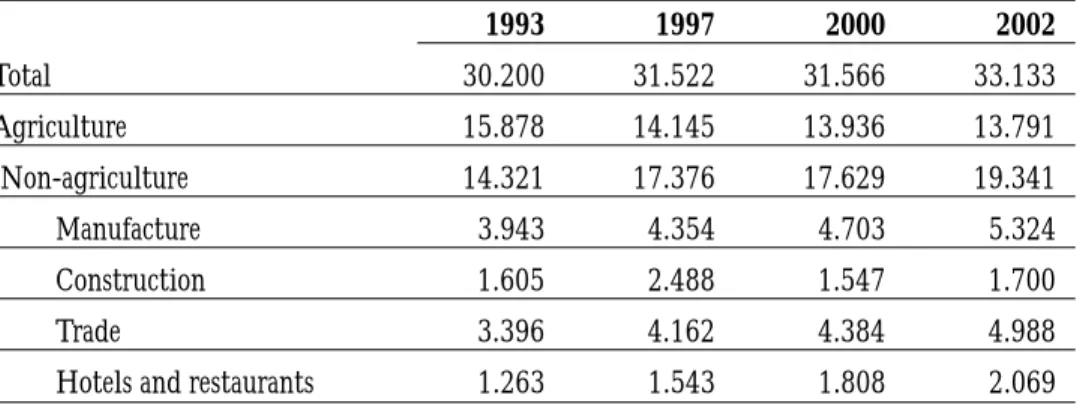
For the past ten years, the labour market has experienced significant structural change in employment. In 1993, the majority of Thai workers, 15.50 million persons or 52.58 percent, worked in the agricultural sector and the rest of the 47.42 million employed persons worked in the non-agricultural sector. Since 1993, the number of workers in the agricultural sector has been declining continuously. In 1995, the number of non-agriculture workers outnumbered the agriculture workers. In 2002, there were 19.34 million workers in the non-agricultural sector and only 13.79 millions, or 42 percent, were in the agricultural sector.
Industrialization in Thailand, which started in the 1960s, had significant effects on the employment in the agricultural sector. However, the financial crisis that began in Thailand in late 1997 had a reverse effect. During the period of 1993-1996, the number of workers in the agricultural sector decreased from 15.87 million to 13.95 million, a decline on the average of 642,326 persons annually. In 1997, when the crisis first hit, the number of workers in the agricultural sector increased to 14.14 million people. Because of the crisis, many workers moved from the non-agricultural sector back to agriculture and have stayed in that sector since. This phenomenon can be shown by the employment figures in the agricultural sector since the financial crisis began. The employment figures in agriculture remained constant at approximately 13.8 million in the period 1998-2002.
Meanwhile, during 1993-1997, non-agriculture employment increased from 14.32 million to 17.37 million, an increase of 818,460 people a year.
In 1998, after the crisis began, employment in this sector fell to 16.71 million people. But the economic recovery that started in 2000 affected the declining trend. In 2002, employment in non-agriculture businesses increased to 19.39 million people.
Even though the number of agriculture workers continues to decline, the sector remains the largest source of employment. In 2002, 41.62 percent of the country’s labour force worked in agriculture. The second largest employing sector is manufacturing with 16 percent of the total workforce. Approximately
15 percent of all employed persons work in the trading sector and 6 percent work in hotels and restaurants. Employment in the construction sector followed a rapidly increasing trend to a peak in 1996 at 2.631 million workers; heavily hit by the impact of the financial crisis, employment in this sector fell dramatically to 1.421 million workers in 1999. But it has been experiencing a resurgence of growth, and employment climbed to 1.7 million workers in 2002. The details of working persons by employment status are shown in Table 2.2.
Table 2.2: Number of Employed Persons by Employment Status, 1993-2002 unit: millions 1993 1997 2000 2002 Total 30.200 31.522 31.566 33.133 Agriculture 15.878 14.145 13.936 13.791 Non-agriculture 14.321 17.376 17.629 19.341 Manufacture 3.943 4.354 4.703 5.324 Construction 1.605 2.488 1.547 1.700 Trade 3.396 4.162 4.384 4.988
Hotels and restaurants 1.263 1.543 1.808 2.069
Source: Labour Force Survey 1993-2002, National Statistics Office
Employment by age group
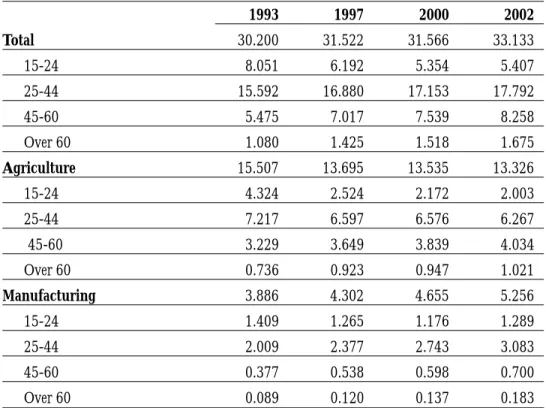
According to Table 2.3, most employed persons in Thailand are 25-44 years old: In 2002, 17.792 million employed people were 25-44 years old, accounting for 53.7 percent of total employment. Approximately 25 percent of the workforce was 45-60 years old and 16 percent was 15-24 years old. Only 1.675 million people, or 5.28 percent, were older than 60 years.
Enrolment data indicates teenagers are staying longer in school, which explains why employment of people aged 15-24 years has been declining. In 1993, employment in that age group reached 8.051 million people; in 2002, this number had fallen to 5.407 million – a decrease of 48 percent.
In 2002, the number of agricultural workers aged 25-44 was less than the average of that age group in the total workforce. But the number of agriculture workers older than 45 years was higher than the average of that age group in the total workforce. This indicates that the younger generation of workers has moved to non-agriculture jobs and the majority of farm workers are of older age.
Meanwhile, in the manufacturing sector, the number of 15- to 24-year-old workers was higher than the average in that age group of the total workforce. And the number of people older than 45 years was less than the average of that age group in the total workforce.
Comparing sectors, manufacturing workers are relatively younger. This implies that they are relatively more flexible in improving their skills or migrating across sectors.
Table 2.3: Number of Employed Persons by Age Group
unit: millions 1993 1997 2000 2002 Total 30.200 31.522 31.566 33.133 15-24 8.051 6.192 5.354 5.407 25-44 15.592 16.880 17.153 17.792 45-60 5.475 7.017 7.539 8.258 Over 60 1.080 1.425 1.518 1.675 Agriculture 15.507 13.695 13.535 13.326 15-24 4.324 2.524 2.172 2.003 25-44 7.217 6.597 6.576 6.267 45-60 3.229 3.649 3.839 4.034 Over 60 0.736 0.923 0.947 1.021 Manufacturing 3.886 4.302 4.655 5.256 15-24 1.409 1.265 1.176 1.289 25-44 2.009 2.377 2.743 3.083 45-60 0.377 0.538 0.598 0.700 Over 60 0.089 0.120 0.137 0.183
Employment by level of education attainment
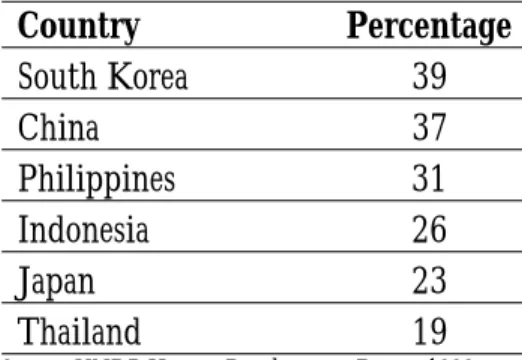
Thailand’s work force is relatively low educated. According to the United Nations Development Programme’s (UNDP) Human Development Report (1999), the percentage of science and technology students among the total university students is only 19 percent – compared to 39 percent in South Korea, 37 percent in China, 31 percent in the Philippines and 26 percent in Indonesia (see Table 2.4).
Table 2.4: Percentage of Science and Technology Students in 1995
unit: % Country Percentage South Korea 39 China 37 Philippines 31 Indonesia 26 Japan 23 Thailand 19
Source: UNDP Human Development Report 1999
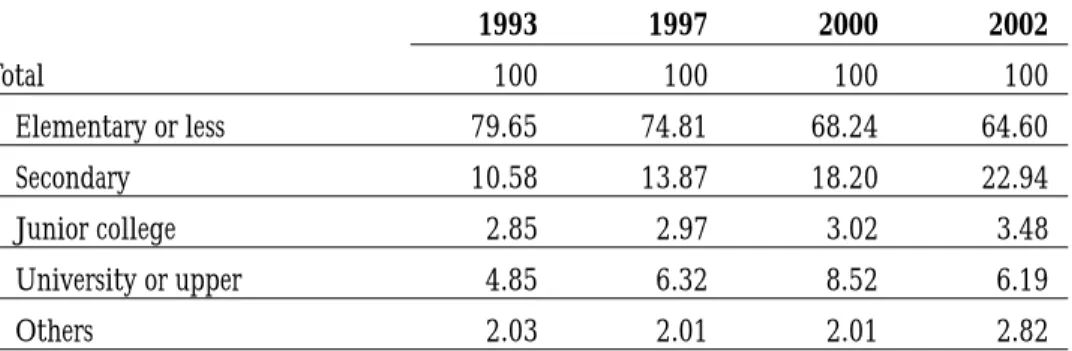
According to Table 2.5a, in 2002, 64.6 percent of all Thai workers had only an elementary or less education (less than six years), while 23.07 percent of all workers had up to a secondary level of education. Only 6.19 percent of all Thai workers had studied at the undergraduate level or higher.
However, those figures actually represent a significant increase in the education levels of Thai workers. In 1993, nearly 80 percent of all workers had an elementary or less education while only 10.58 percent had studied at the secondary level. Unfortunately, the percentage of university graduates in the workforce had increased only slightly.
Table 2.5a: Percentage of Employed Persons by Level of Education Attainment, 1993-2002 unit: % 1993 1997 2000 2002 Total 100 100 100 100 Elementary or less 79.65 74.81 68.24 64.60 Secondary 10.58 13.87 18.20 22.94 Junior college 2.85 2.97 3.02 3.48 University or upper 4.85 6.32 8.52 6.19 Others 2.03 2.01 2.01 2.82
Source: Labour Force Survey 1993-2002, National Statistics Office
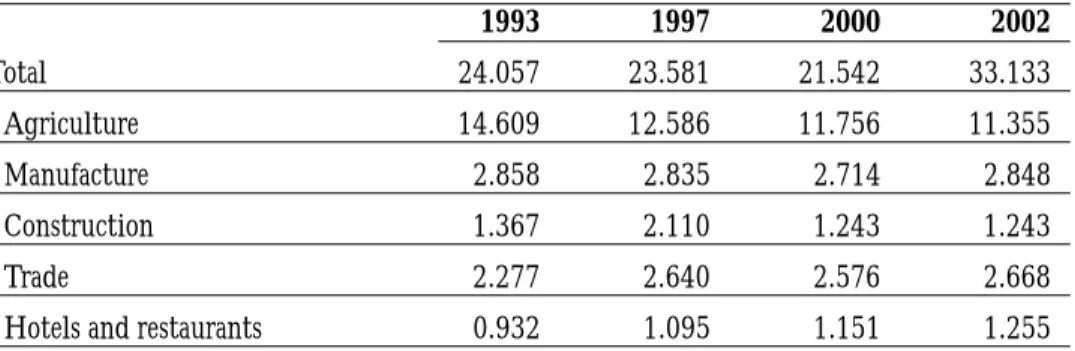
Table 2.5b explains the number of employed persons with an elementary or less educational level. In comparing sectors, agriculture workers remain the least educated. This reality may be the major reason for slow technological change in the agricultural sector. Low use of technology in agriculture doesn’t encourage a need for highly educated workers. Of all agriculture workers, some 85 percent had an elementary or less education in 2002; only 13.65 percent graduated from secondary school.
In the manufacturing sector, nearly 35 percent of all workers had graduated secondary school, which represents a proportion higher than the average (23 percent) of all workers with that level of education.
From official data, it appears that the agriculture and construction sectors employ more poorly educated workers while the manufacturing, trading and hotel and restaurant sectors employ more workers with at least a secondary level of education.
Table 2.5b: Number of Employed Persons with Elementary or Less Education unit: millions 1993 1997 2000 2002 Total 24.057 23.581 21.542 33.133 Agriculture 14.609 12.586 11.756 11.355 Manufacture 2.858 2.835 2.714 2.848 Construction 1.367 2.110 1.243 1.243 Trade 2.277 2.640 2.576 2.668
Hotels and restaurants 0.932 1.095 1.151 1.255
Source: Labour Force Survey 1993-2002, National Statistics Office
2.3 Unemployment
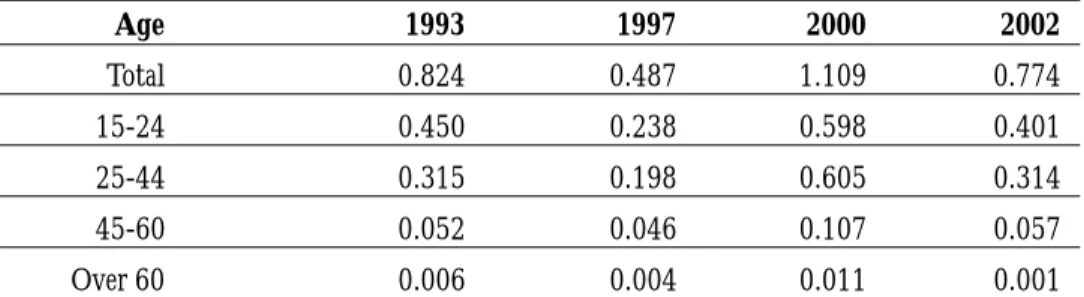
The total number of unemployed people in Thailand remained at less than one million a year from 1993 until 1998 when it jumped over that mark due to the financial crisis. It stayed above one million until 2002, when the number of unemployed persons fell to 774,609 people.
The majority of unemployed persons are aged between 15 and 24 years. In 2002, 51.81 percent of all unemployed persons were 15-24 years old, while 40.57 percent were 25-44 years old (see Table 2.6). The financial crisis seems to have hit younger workers hardest: In 1998, 89 percent (1.203 million people) of all unemployed persons were aged between 15 and 44 years old.
Comparing education levels, most unemployed people, not surprisingly, are poorly educated. In 2002, 46.1 percent of all unemployed people had an elementary or less education. That percentage is an improvement from 1993, when 79.96 percent of all workers had that same education level (in 1997, it was 64.1 percent). However, the number of unemployed people who have graduated secondary school has not followed a similar declining trend. And worse, the number of university graduates among the unemployed soared after the financial crisis began. Before 1997, the percentage of university graduates kept at a 5-7 percent level; because of the crisis, it jumped to 13.43 percent in 2001 and fell slightly to 11.51 percent in 2002.
Table 2.6: Number of Unemployed Persons by Age Group, 1993-2002 unit: millions Age 1993 1997 2000 2002 Total 0.824 0.487 1.109 0.774 15-24 0.450 0.238 0.598 0.401 25-44 0.315 0.198 0.605 0.314 45-60 0.052 0.046 0.107 0.057 Over 60 0.006 0.004 0.011 0.001
Source: Labour Force Survey 1993-2002, National Statistics Office
R e l a t i v e l y, unemployment is not a serious issue in Thailand. The unemployment rate since 1993 has kept at a low rate, between 1.5 and 2.6 percent. Despite the financial crisis that had the heaviest impact on the Thai economy in the country’s history and led to negative growth of 10 percent between 1997 and 1998, the highest unemployment rate was only 4.08 percent in 1999. This may be attributed to the agricultural sector, which was able to absorb the huge excess from the non-agricultural sector. However, the labour migration to agriculture creates the problem of underemployment in agriculture and leads to the problem of low levels of labour productivity.
2.4 Labour Productivity
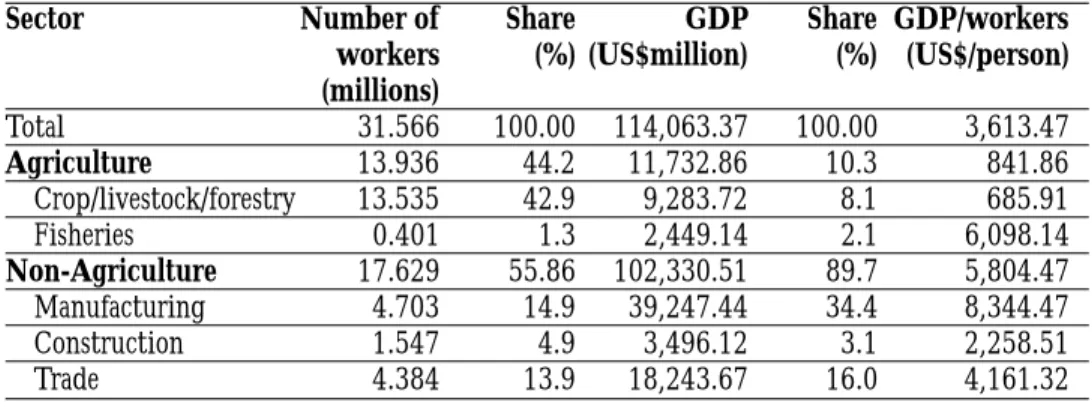
It is difficult to estimate labour productivity. In order to find some estimation, the value-added amount of labour ( ) is used. This may be misleading because of underemployment. The result may be incorrect as well since the increase in value-added can be the result of an increase in capital productivity. However, using this ratio may help to compare the productivity of labour across sectors. By estimating the ratio of gross domestic product (GDP) to the number of workers in each sector, it was found that in the year 2000 workers in the manufacturing sector had the highest productivity level of US$8,344 per worker (see Table 2.7). Agriculture workers had the lowest at US$841 per worker. Surprisingly, workers in the fishing sector had the second-highest productivity level at US$6,098 per worker. The high value added in this
Q 2
sector should be the result of capital-intensity use, not the result of human-capital improvement.
Table 2.7: Labour Productivity, 2000
Sector Number of Share GDP Share GDP/workers
workers (%) (US$million) (%) (US$/person) (millions) Total 31.566 100.00 114,063.37 100.00 3,613.47 Agriculture 13.936 44.2 11,732.86 10.3 841.86 Crop/livestock/forestry 13.535 42.9 9,283.72 8.1 685.91 Fisheries 0.401 1.3 2,449.14 2.1 6,098.14 Non-Agriculture 17.629 55.86 102,330.51 89.7 5,804.47 Manufacturing 4.703 14.9 39,247.44 34.4 8,344.47 Construction 1.547 4.9 3,496.12 3.1 2,258.51 Trade 4.384 13.9 18,243.67 16.0 4,161.32
Note: 43 baht = US$1
Source: National Economic and Social Development Board (NESDB)
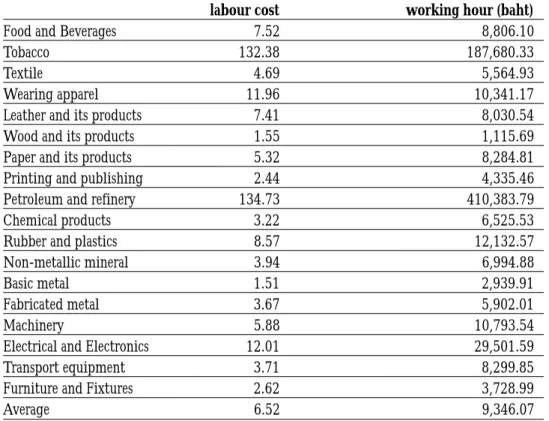
Since labour productivity can be used as the indicator of the quality of the workers, Mephokee (2001) estimated Thailand’s 1998 labour productivity in two ways: First, he calculated the output per labour cost ratio by dividing the output value of each manufacturing sector by its total labour cost. This ratio implies that every baht spent on labour factor has a return value. By this calculation, it was found that the sectors with the highest ratios are petroleum refineries and petroleum products (134.73) and tobacco (132.38). However, the average ratio for the whole manufacturing sector is 6.52. For the ICT-related industry such, as electrical and electronic products, the ratio is 12.01 (see Table 2.8a).
Labour productivity also can be calculated in terms of the value of output per one hour of work. This ratio is estimated by dividing the value of output by the total number of working hours in each sector. The results are the same as in the first calculation: petroleum refineries and petroleum products and tobacco show the highest value at 410,383 baht and 187,680 baht, respectively. Compared to the average value of 9,346 baht per hour, the electrical and electronic products show the highest performance with a value of 29,501 baht per hour.
Table 2.8a: Thailand Labour Productivity in 1998
Sector Output value per Output value per
labour cost working hour (baht)
Food and Beverages 7.52 8,806.10
Tobacco 132.38 187,680.33
Textile 4.69 5,564.93
Wearing apparel 11.96 10,341.17
Leather and its products 7.41 8,030.54
Wood and its products 1.55 1,115.69
Paper and its products 5.32 8,284.81
Printing and publishing 2.44 4,335.46
Petroleum and refinery 134.73 410,383.79
Chemical products 3.22 6,525.53
Rubber and plastics 8.57 12,132.57
Non-metallic mineral 3.94 6,994.88
Basic metal 1.51 2,939.91
Fabricated metal 3.67 5,902.01
Machinery 5.88 10,793.54
Electrical and Electronics 12.01 29,501.59
Transport equipment 3.71 8,299.85
Furniture and Fixtures 2.62 3,728.99
Average 6.52 9,346.07
Note: Labour cost includes wages, bonus and income-in kind. Source: Mephokee (2001)
Table 2.8b shows labour productivity for the total economy. Labour productivity is defined as value added per worker, which is obtained when dividing the value added of manufacturing establishments by the number of employees or people engaged in those establishments. Table 8b illustrates that during 1980-1984, one Thai employee could produce about US$11,000 per year of added value for the economy. This value reached US$19,900 per year during 1995-1999; this was considered high compared to other countries in the region, such as Indonesia (US$5,139), Malaysia (US$12,661) and Philippines (US$10,781). However, compared to Japan (US$92,582) and Singapore (US$40,674), Thai labour productivity is relatively low.
Table 2.8b: Comparison of Labour Productivity
unit: US$ per year
Country Value added per worker
1980-1984 1995-1999 Indonesia 3,807 5,139 Japan 34,456 92,582 Malaysia 8,454 12,661 Philippines 5,266 10,781 Singapore 16,442 40,674 South Korea 11,617 40,916 Thailand 11,072 19,946
Source: World Development Indicators 2001
2.5 Demand for and Supply of Labour Demand for labour
Table 2.9 shows the forecast on labour demand by industry. In the year 2005, it is estimated that 3.329 million workers will be needed for the manufacturing sector. Most of the labour needed in 2005 will be in the food and textiles sectors; a projected 0.726 million, or 21.81 percent, of workers will be needed in 2005. The increase in demand in these two sectors from 2001 to 2005 will be only 7.08 percent, higher than the average growth of 5.65 percent. The electrical equipment and electronics sectors, which are considered elements of modern industry, will need 310,494 workers in 2005, or 9.32 percent of the total labour demand.
The sectors that show the fastest demand growth are plastics (15.08 percent) and footwear and leather (11.09 percent).
Table 2.9: Labour Demand Forecast within the Industrial Sector
unit: persons
Sector 2001 2002 2003 2004 2005
Food and animal feeds 348,648 350,308 352,690 355,388 358,711
Textiles 329,366 335,637 344,632 354,868 367,554
Footwear and leather 92,950 94,642 97,065 99,817 103,220
Wood and its products 122,440 124,051 126,383 129,056 132,393
Petrochemicals 7,514 7,716 7,997 8,307 8,677
Pharmaceuticals and
chemical products 44,989 45,908 47,249 48,801 50,760
Rubber and its products 72,482 73,172 74,167 75,302 76,710
Plastics 126,050 129,156 133,702 138,997 145,725
Ceramic products
and glassware 43,334 44,207 45,480 46,954 48,813
Iron and steel 25,395 25,942 26,731 27,633 28,758
Electrical equipment
and electronics 294,841 297,401 301,088 305,288 310,494
Motor vehicles and parts 100,583 101,935 103,892 106,137 108,939
Precious stones
and jewellery 29,487 30,247 31,360 32,658 34,311
Others 1,512,932 1,505,176 1,516,274 1,524,114 1,554,345
Total 3,151,013 3,165,499 3,208,712 3,253,320 3,329,409
Source: www.oie.go.th/TDRIWEB1/MOIWebISAPI.DLL/GenDPage?YrSel=2544
Table 2.10 shows the forecast of demand for workers in the science and technology field as estimated by the Office of Industrial Economics (OIE). In 2005, around 366,460 workers will be required in the S&T industry. Most of the need will be in the modern sectors, such as electrical equipment and electronics and motor vehicles and parts. These two sectors will require 51,654 S&T workers, or 14.1 percent of the total demand. The textiles and footwear sectors will require the highest share of labour demand in 2005 but will only need 11,348 S&T workers, or 3.1 percent of the total demand for S&T workers. The food and animal feeds sector will require 24,139 S&T workers in 2005.
The sectors that will require fewer numbers of S&T workers are ceramic products and glassware (867) and precious stones and jewellery (567).
The OIE estimates that from 2001 to 2005, the average growth rate in demand for S&T workers will be 8.42 percent. However, it was found that the demand growth in electrical equipment and electronics will be 5.82 percent and 11.35 percent for the motor vehicles and parts sector.
Table 2.10: Forecast of Demand for S&T Workers within the Industrial Sector
unit: persons
Sector 2001 2002 2003 2004 2005
Food and animal feeds 23,546 23,644 23,784 23,943 24,139
Textiles 9,444 9,545 9,690 9,852 10,051
Footwear and leather 1,201 1,217 1,240 1,265 1,297
Wood and its products 2,863 2,891 2,931 2,977 3,033
Petrochemicals 4,514 4,730 5,036 5,383 5,809
Pharmaceuticals and
chemical products 4,418 4,507 4,636 4,787 4,976
Rubber and its products 5,922 5,988 6,084 6,194 6,330
Plastics 6,901 7,024 7,203 7,409 7,668
Ceramic products
and glassware 791 803 821 841 867
Iron and steel 4,748 4,922 5,175 5,471 5,849
Electrical equipment
and electronics 25,032 25,270 25,612 26,003 26,488
Motor vehicles and parts 22,600 23,011 23,609 24,299 25,166
Precious stones and jewellery 535 540 547 556 567
Others 225,471 228,505 232,896 237,932 244,219
Total 337,986 342,596 349,265 356,912 366,460
Source: www.oie.go.th/TDRIWEB1/MOIWebISAPI.DLL/GenDPage?YrSel=2544
Table 2.11 represents the increase in demand for manpower in the S&T field. In 2005, the Thai economy will require 16,686 more workers in the S&T field. Table 2.11 shows that the number of additional S&T workers that the Thai economy needs each year would be increasing as the economy moves toward a knowledge-based economy. For example, it was estimated that the economy needed 1,705 additional workers with an engineering degree in 2002; but this demand will increase to 2,495 persons in 2005. Moreover, to cope with the ICT era, the OIE estimates that the demand shortage for workers with a Bachelor’s degree in the S&T field will increase from 105 additional workers needed in 2002 to a need for 148 additional workers in 2005.
Table 2.11: Marginal Demand in Science and Technology Field
unit: persons
Programme 2002 2003 2004 2005
Total 11,370 13,521 14,632 16,686
Diploma level (2 years)
Industrial trade 2,658 3,157 3,414 3,891
Diploma level (3 years)
Industrial trade 5,359 6,392 6,926 7,914
Bachelor’s degree – S&T 3,248 3,850 4,160 4,735
Science 1,305 1,556 1,686 1,925
Physics, chemistry and biology 471 570 621 715
Mathematics and statistics 74 87 94 106
Other science programme 760 899 971 1,104
Engineering 1,705 2,024 2,190 2,495
Industrial trade, machine
mechanics and metal technology 1,004 1,194 1,293 1,475
Electronics and electrical technology 397 469 506 575
Infrastructure and
construction technology 74 87 94 107
Other engineering programme 231 275 297 338
Agriculture Science 238 269 285 314
Food science/technology 113 127 134 148
Other agriculture science 125 142 151 167
Higher than Bachelor’s degree 105 122 131 148
Note: The rate of labour exit is assumed to be 0.0200
Source: www.oie.go.th/TDRIWEB1/MOIWebISAPI.DLL/GenDPage?YrSel=2544
Supply of labour
As seen in Table 2.12 in terms of supply, the number of university graduates by faculty can indicate the supply flow of skilled workers. In 2003, it is estimated that there will be 3,850 university graduates from the sciences field and 3,390 persons from the engineering field. Another 332 persons will graduate in the agriculture science area.
Table 2.12 Forecast of the Number of University Graduates by Faculty
unit: persons
Faculty 2000 2001 2002 2003
Male Female Male Female Male Female Male Female
Education 8,536 13,216 9,225 14,284 9,848 15,254 10,292 15,938
Teacher training 3,216 7,167 3,477 7,747 3,712 8,272 3,879 Humanities 1,375 2,620 1,485 2,831 1,587 3,022 1,656 Social science,
commerce and law 44 262 47 282 50 302 53 315
Programme 2000 2001 2002 2003
Male Female Male Female Male Female Male Female
Science 1,097 2,149 1,185 2,322 1,265 2,482 1,321 2,592 Engineering 2,621 186 2,833 203 3,024 217 3,163 227 Agriculture science 159 117 172 126 183 134 191 141 Health and welfare
Services 24 715 26 773 27 825 29 Humanities and arts 2,014 4,640 2,178 5,017 2,326 5,353 2,432 5,595 Arts 1,291 1,040 1,397 1,123 1,491 1,200 1,558 Humanities 723 3,600 781 3,894 835 4,153 874 Social science 12,912 36,489 13,955 39,440 14,902 42,115 15,570 44,000 Source: www.oie.go.th/TDRI/frmISCED_3_0.html
Table 2.13 explains the new supply of S&T manpower entering the Thai labour market from 2002 to 2005. In 2005, it is estimated that a total of 27,592 new workers will enter the market. Most of them (58.4 percent) will be three-year diploma level graduates. Only 96 workers with an educational level higher than a Bachelor’s degree are estimated to enter the industrial sector in 2005.
Table 2.13: Estimation of the Rate of Science and Technology Labour Entering the Industrial Sector
unit: persons
Programme Estimation of 2002 2003 2004 2005
the rate of labour entry
Total 26,627 25,655 27,266 27,592
Diploma level (2 years)
Industrial trade 0.4609 4,486 3,504 4,278 4,152
Diploma level (3 years)
Industrial trade 0.3175 15,820 15,441 16,016 16,114
Bachelor’s degree – S&T 6,238 6,622 6,881 7,230
Science 973 1,033 1,071 1,124 Physics, chemistry and biology 0.1467 400 424 440 462 Mathematics and statistics 0.1467 493 523 542 569 Other science programme 0.1467 80 86 89 93 Engineering 4,462 4,738 4,926 5,178 Industrial trade, machine mechanics
and metal technology 0.5986 2,975 3,159 3,284 3,452
Electronics and electrical technology 0.1922 922 979 1,018 1,070 Infrastructure and construction technology 0.1034 253 269 280 294 Other engineering programme 0.1859 312 331 344 362 Agriculture Science 802 851 884 928 Food science/technology 0.1467 262 278 289 303
Other agriculture science 0.1467 540 573 595 625
Higher than Bachelor’s degree 0.0304 83 88 91 96
Note: Estimated by employing the data between 1996 and 1999 Source: www.oie.go.th
Table 2.14 shows the disequilibrium in the S&T labour market. Totally, the market will be facing an excess supply of S&T labour in the industrial sector by 2005. However, there are shortages in some areas, such as the area of science in the Bachelor’s degree level. A shortage exists also in the levels higher than Bachelor’s degree. By 2005, it is estimated there will be shortages in physical, chemistry, biology and other science programmes.
Table 2.14: Excess Supply of Science and Technology Labour in the Industrial Sector
unit: persons
Programme 2002 2003 2004 2005
Total 15,257 12,134 12,634 10,905
Diploma level (2 years)
Industrial trade 1,828 347 863 262
Diploma level (3 years)
Industrial trade 10,461 9,049 9,090 8,200
Bachelor’s degree – S&T 2,991 2,772 2,720 2,495
Science -331 -524 -614 -801
Physics, chemistry and biology -71 -146 -181 -253
Mathematics and statistics 419 436 449 463
Other science programme -679 -814 -882 -1,011
Engineering 2,757 2,714 2,736 2,682
Industrial trade, machine
mechanics and metal technology 1,971 1,965 1,992 1,977
Electronics and electrical technology 525 510 511 494
Infrastructure and construction
technology 180 182 186 187
Other engineering programme 81 57 47 23
Agriculture Science 564 582 599 614
Food science/technology 149 151 154 156
Other agriculture science 416 431 445 458
Higher than Bachelor’s degree -22 -34 -40 -52
Source: www.oie.go.th
International comparison
Compared with several countries in the region, the number of human resources in S&T in Thailand is relatively small. This small workforce will be a burden for the Thai economy in moving toward a knowledge-based economy. According to the UNESCO World Science Report (1998), in 1995, Thailand had 68,899 scientists and engineers and 2,346 technicians; China had 422,700 scientists and engineers and 242,900 technicians. For the one-researcher-per-10,000-population ratio, Thailand is facing a relatively low research-population ratio. During the period of 1992-1995, the number of researchers per (/) 10,000 population ratio was 2.2 in Thailand, while it was 80/ in Japan, 43/ in Korea, 34/ in Singapore, 5.5/ in China, 2.4/ in Philippines and 2.3/ in Malaysia (see Table 15). Thailand needs to develop human capital in S&T in both quantity and quality. The goal set by the former Ministry of
Ministry of Sciences and the Ministry of ICT) is to promote the production of human resources in S&T to reach 70,000 in the undergraduate level, 7,000 at the Master’s degree level and 700 at the Ph.D. level per year by 2007. The goal also includes increasing the number of researchers to 3/10,000 population by 2007.
Table 2.15: International Comparison of Science and Technology Human Capital
Country Year Scientists Technicians Researchers per
and engineers (persons) 10,000
(persons) population Australia 1994 56,520 14,133 48.0 China 1995 422,700 242,900 5.5 Japan 1995 787,402 103,400 80.0 South Korea 1994 117,446 14,141 43.0 Malaysia 1992 1,633 1,655 2.3 New Zealand 1995 6,102 2,838 29.0 Philippines 1995 9,960 1,399 2.4 Singapore 1995 7,695 997 34.0 Thailand 1995 68,899 2,346 2.2
Source: Vanichseni, S. (2002), Human Resource Development in S&T in Thailand
3. STRUCTURAL CHANGE IN THAILAND’S INDUSTRY 3.1 Share in GDP
For the past ten years, industrialization has changed the structure of Thailand’s industry. Table 3.1 explains the structural change in terms of share in GDP. In 1993, the share of manufacturing in GDP was 28.19 percent; it increased to 32.03 percent in 2000. Meanwhile the share of agriculture has remained constant at 10 percent since 1993. The services sector has been increasing rapidly since 1993 as well. In 1993, its share was 12.87 percent and that rose to 15.09 percent in 2000.
However, Thailand’s industrialization has increased the geographical industrial concentration. Manufacturing activities are concentrated in Metropolitan Bangkok. In 1987, 77.5 percent of GDP in manufacturing was located in this area. The relatively complete infrastructure, such as the
trans-portation network, communications network and supporting-industry network, provides a strong incentive for investors to locate in the Bangkok area. The Eastern Seaboard Project, which started in the 1980s and has been operating effectively since the 1990s, plays an important role in industrial dispersion. Currently, the country’s manufacturing activities are concentrated in Metropolitan Bangkok and the eastern region.
Table 3.1: Share of Agricultural and Non-Agricultural Sectors
unit: %
1993 1997 2000
Agriculture 10.11 10.86 10.29
Non-agriculture 89.89 89.14 89.71
Mining and quarrying 1.4 1.74 2.38
Manufacturing 28.19 28.76 32.03
Construction 6.97 5.74 3.07
Electricity and water supply 2.44 2.51 2.98
Transportation and communications 7.51 7.82 8.09
Wholesale and retail trade 16.88 16.12 15.99
Banking, insurance and real estate 7.34 6.82 3.21
Ownership of dwellings 2.57 2.43 2.55
Public administration and defence 3.72 3.83 4.33
Services 12.87 13.37 15.09
Source: Calculated from data of the National Economic and Social Development Board (NESDB)
According to Table 3.2, the share of manufacturing activities in Metropolitan Bangkok declined from 67.89 percent in 1993 to 58.46 percent in 2000. Meanwhile, the share of manufacturing activities in the eastern region increased rapidly from 12.93 percent in 1993 to 21.46 percent in 2000.
However, there was slow manufacturing activity growth in the rest of the country. For example, only 3.89 percent of all manufacturing activities in 2000 were located in the North and only 2.11 percent were in the South.
Table 3.2: Share of Manufacturing Sector in Each Region unit: % Region 1993 1997 2000 Metropolitan Bangkok 67.89 60.83 58.46 Central 5.68 5.89 5.71 East 12.93 19.45 21.46 North 3.76 3.79 3.89 Northeast 4.49 4.87 5.04 South 1.96 1.99 2.11 West 3.29 3.18 3.33 Total 100 100 100
Source: Calculated from data of the National Economic and Social Development Board (NESDB)
3.2 Number of Establishments
In 1993, the total number of industrial establishments was 104,507. Among them, 48.57 percent were basic agro-industry businesses. The share of modern-sector businesses, such as machinery and electrical products and transport equipment, was very small: only 7.19 percent and 6.93 percent, respectively. As shown in Table 3.3, by 2001 there was a significant change in the number of industrial establishments. The number of businesses in basic agro-industry declined to 44,736, or 11.87 percent of total establishments. Meanwhile, other sectors experienced increases: The number of transport equipment establishments was 11,436, which was 100 percent higher than in 1993. Food industry businesses in 2001 numbered 7,159, which was 152.52 percent higher than in 1993. This data reflects the variation in growth of manufacturing activities in the past ten years.
Table 3.3: Number of Establishments in Industrial Manufacturing unit: establishments Industry 1993 1996 2001 Basic agro-industry 50,763 49,555 44,736 Food industry 2,835 2,969 7,159 Beverage industry 283 283 395 Textiles 2,503 2,575 3,091 Wearing apparel 2,345 2,469 2,548
Leather products and footwear 488 460 1,167
Wood and wood products 5,714 5,560 5,771
Furniture and fixture NA NA 2,877
Paper and paper products 834 908 1,004
Printing, publishing and allied products 1,685 1,859 2,087
Petroleum products 694 706 1,859
Rubber and rubber products NA NA 270
Plastic products 2,533 2,891 4,238
Non-metal products 2,390 2,322 6,640
Basic metal products 779 854 1,092
Fabricated products 6,946 7,396 10,365
Machinery, electrical machinery
and supplies 7,510 7,266 8,562
Transport equipment 7,243 6,889 11,436
Other manufacturing industries 8,109 8,039 6,893
Total 104,507 103,947 124,079
Source: Information Centre, Ministry of Industry
In 2001 overall, the number of total manufacturing establishments was 124,079, which was 18.73 percent higher than in 1993. Basic agro-industry businesses declined in terms of number though they still maintained the highest share of the total manufacturing establishments at 36.05 percent. However, the number of establishments in the modern sectors, such as chemical and chemical products, plastic products, fabricated products, machinery and electrical machinery and transport equipments, increased dramatically.
4. INDUSTRIAL POLICY WITH REGARD TO ICT
Although industrialization has occurred in Thailand for many decades, technology development is still at a low level, which leads to a low level of productivity and thus, poor competitiveness. This is a major issue in Thailand’s industrial sector. Some causes responsible for the situation are:
1) Weakness of government institutions and repetition of policies.
Several departments of the Government that are responsible for technology development usually employ similar measures to motivate development among private enterprises (the obvious example is the tax policy employed by both the Board of Investments (BOI) and the Ministry of Finance), especially the ones relevant to tax privileges. There are many studies indicating that these policies are ineffective in changing behaviours of firms.
For more than 40 years, the repetition of responsibilities among government departments has been a major problem for industrial development. For example, both the Ministry of Industry and the Ministry of Information and Communications Technology are responsible for the development of ICT-related industries. In addition, there has also been a problem of good governance due to a concentration of responsibility for research and development (R&D) activities within only some government institutions, such as the National Science and Technology Development Agency (NSTDA), which is responsible for both arranging funds and conducting R&D activities. Moreover, there have been several research projects conducted by government institutions or by private institutions receiving funds from them that are inapplicable or don’t respond to the needs of private firms.
2) Low investment in research and development among private enterprises.
Research and development is a public good that provides social benefits greater than private benefits. The benefits are enjoyed by both R&D investors and those who do not invest. With the weakness of property-rights protection, the ones who do not invest can obtain the benefits of R&D carried out by others
without bearing the risk of failure. The practice of copying products created by others discourages R&D activities among private enterprises. As a result, Thailand is experiencing low investment in R&D among private enterprises.
3) Poorly developed human resources in the labour market.
Because most of the existing human resources in the labour market are low-educated and weak in some important and basic subjects necessary for technology development, such as science and technology, mathematics and foreign language, then private enterprises opt to utilize simple production processes to suit the characteristics of the labour force rather than investing in high technology systems that require skilled workers.
The Government seems to realize the negative impact of these situations on both the industrial sector and ultimately the country. The Ninth National Economic and Social Development Plan introduced in 2002 contained two specific policies relevant to ICT development – a technology development policy and a policy and plan for development of labour quality. In addition to these policies, an ICT master plan was initiated from the cooperation between the National Electronics and Computer Technology Center (NECTEC) and the National Economic and Social Development Board that aims to develop both human resources and the environment to enable the country to compete and survive in the new economic order of a knowledge-based economy.
The goals of the S&T 2020 Plan, set by the Thai Government are:
- Provide S&T learning to the public for seeking solutions to problems. - Produce 200,000 Bachelor’s degree graduates, 20,000 Master’s degree
graduates and 2,000 Ph.D. graduates per year.
- Organize continuing education in S&T for the workforce.
- Arrange for personnel exchange between the public and private sectors. - Emphasize human resources development (HRD) for sustainable
The details of the human resources development regarding ICT are as follows:
1) Initiate policies related to improving the role of the Government in supporting technology development.
i. Decrease the role of Government from supplier of technological development to become the supporter of the private firms in creating their own technological development projects.
ii. Decrease a repetition of the role or responsibility of several departments of the Government in supporting technology development (“Institutional Specialization”).
iii. Extend the definition of research and development activities that are eligible for tax privileges.
iv. Improve the regulations and procedures of asking for tax privileges or tax exemptions to make these measures more effective in supporting research and development activities. For example, there could be a progressive rate
of tax exemption or setting up a minimum percentage of R&D investment for receiving some privileges to stimulate private firms to invest more.
2) Initiate policies to support technology development among the private enterprises.
i. Stimulate the private enterprises to improve their knowledge and to increase their demands for technology development. Private entrepreneurs are
classified into two groups – the ones who do not know that their firms lack some skills as well as do not know what kind of skills they lack, and the ones who know what skills they need to learn. The Government will then provide different policies for each group as follows:
Private entrepreneurs
Group 1: Those who do not know that their firms lack some skills as well as do not know what kind of skills they lack.
Group 2: Those who know what skills they need to learn.
Policies
- Make the entrepreneurs recognize the effects of changing internal and external environments, such as the impact of being a member of the World Trade Organization on the competitive situation of business.
- Help private firms in comparing different types of production processes in order to select the best way of technology development that suits them individually.
- Support technology research projects in cases where firms do not know what exactly are their problems.
- Provide information about sources of investment funds.
- Demonstrate utilization of new technology.
- Set up industrial forums to share knowledge and experiences among private firms.
- Help entrepreneurs in technology research.
- Facilitate the entrepreneurs in approaching new sources of technology. - Provide a financial facility for private
firms. Provide consultants for short-term technology transfer. - Establish a centre for inexpensive
product quality-testing. - Support the small and medium
enterprises to draft a plan for productivity improvement.
ii. Support private firms in starting technology development.
- Set up a skills-developing fund to support any labour skill-development project of private enterprises.
- Improve the tax incentives for the firms that invest in research and development.
- Offer subsidies for private enterprises to develop their own technology.
- Offer funds with low interest for firms investing in modern machinery or investing in some technology development activities. - Extend the cooperation between the private entrepreneurs and
universities in order to produce researchers to truly respond to the needs of these firms in technology development.
- Create links or cooperation between educational institutions and private firms, especially in the improvement of labour skills.
iii. Encourage technology transfer among private firms.
The Board of Investment can provide tax privileges to attract foreign software companies on condition that there must be technology transfer to Thai partners.
iv. Increase the technological potential of small and medium enterprises.
Since the small and medium enterprises usually have less technological potential than larger ones, the Government can encourage these firms to apply information technology in their businesses by:
- Creating the right attitude and understanding in the benefits of using information technology.
- Creating incentives to set up an alliance among these firms in each industry to help one another in the application of new information and telecommunications technology.
- Encouraging large firms to help small and medium enterprises in adopting or utilizing information technology.
3) Initiate policies that aim to increase the potential of research and development.
i. Increase the number of researchers, especially in the software industry.
- Set up professional training centres to produce highly skilled researchers and software developers.
- Import workers with software knowledge to work with local labourers to facilitate technology and knowledge transfers.
ii. Promote the quality and skills of software researchers.
- Support foreign and Thai experts to cooperate in doing research and development activities.
iii. Create cooperation between the public and private sectors in improving the attitude of the public toward occupations that are relevant to research and development activities.
iv. Set up a systematic mechanism to gather and analyze information about IT progress in order to provide some plans and strategies for supporting research and development activities.
4) Initiate policies related to promoting the level of education and skills of the workforce.
i. Increase the number of highly educated workers.
Increase the level of education of labourers already in the marketplace by setting up education classes in private factories. Also, increase the proportion of science and technology students in universities. The Government aims to produce 2,000 more S&T students per year or to increase the proportion of S&T students from 20 percent to 21.4 percent by 2008 by offering subsidies to universities to launch S&T-related courses.
ii. Reform all levels of education.
Some relevant departments, such as the Ministry of Education, Religion and Culture, as well as government and non-government educational institutions will be encouraged to cooperate more with each other to improve and develop current curricula to enable a development in the thinking process and fundamental skills among students. In addition, courses related to information technology will be included in the curricula at all levels of education.
iii. Offer access and opportunities to utilize information technology.
The Government will provide subsidies for several educational institutions to set up IT libraries and to develop IT-related educational media to make students more accustomed to information technology and increase the opportunities for applying their knowledge and creativity.
iv. Increase the number of human resources in subjects that are truly needed by industrial firms.
- Send more S&T teachers to private firms as consultants to provide theoretical support and to then gain experience in theoretical applications.
- Establish apprentice-type situations whereby students receive direct experience from practicing within private factories, which allows them to apply their knowledge in the actual production process.
- Provide incentive to experts in the industrial sector to become teachers in educational institutions.
- Encourage private entrepreneurs to support their low-skilled and low-educated labourers to further their studies.
v. Increase the number and quality of teachers.
Extend both quantity and quality of teachers of courses such as science, mathematics and foreign language by giving an incentive to the retired employees of private enterprises to become university teachers.
vi. Increase the knowledge and skills of human resources in the industrial sector.
- Set up a skills-development fund as well as provide incentives to support on-the-job training projects of private firms.
- Establish cooperation between the public and private sectors to survey the situation of skills and knowledge of workers that are needed in the industrial sector and develop suitable training curricula to respond to this demand.
- Develop product design skills of labourers by improving relevant training courses in educational institutions.
- Encourage product designers to protect their innovations through copyright and property rights laws.
5) Initiate policies to create an atmosphere of a knowledge-based society. To help people adapt themselves to a knowledge-based society, the Government will pursue the following strategies:
i. Extend a network of IT infrastructure to decrease the digital divide problem.
- The Government will extend its telephone network to reach every village, and it aims to establish at least seven telephone numbers in each village by 2006.
- The Government will set up institutions according to the IT Infrastructure Development Act to be responsible for extending a network of IT infrastructure around the country.
ii. Increase the capacity of IT networks and reduce the price of IT services.
The telecommunications and other IT-related industries will be freer in order to increase an intensity of competition that leads to higher quality of services at less cost. Moreover, in order to support or facilitate such activity, the Government issued a Frequency Allocation Law in 1997; currently, it is formulating a National Telecommunications Commission.
iii. Encourage more utilization of existing infrastructure networks by the private sector.
- Support local government organizations to provide their services through the Internet.
- Support small and medium private firms or cooperatives to operate their businesses through the Internet.
6) Initiate policies related to the development of knowledge-based industries.
i. Develop the software industry.
- Increase the value of the software industry to make it competitive with both the external and internal markets. Government-led projects can be used to create opportunities for domestic firms to gain more experiences in software development.
- Initiate institutional restructuring to promote development in the software industry. The Government will set up two agencies: One will be the Software Industry Promotion Board (SIPB), which will be responsible for providing the master plan for development and approving relevant policies. The second will be the Software Industry Promotion Agency, which will be responsible for bringing the SIPB-approved plans into action and providing funds in the form of seed money, venture capital or soft loan to support the research and development activities of the private entrepreneurs.
- Develop quality of software products and relevant services. International standards of quality testing will be employed and a quality-testing centre will be established.
- Support research and development in IT-related industries by setting up an Intelligence Centre to gather and to stimulate an application of innovations resulting from R&D.
ii. Develop the hardware industry.
- The Government will support private firms to invest more in the hardware industry, such as electronics and computer hardware used in the telecommunications and automotive industries, both in terms of number and variety to create industrial clusters.
- The Government will try to enact laws or resolutions to facilitate any business operation in the information technology economy, such as a law relevant to electronic financial transfers or an information protection law.
5. A CASE STUDY IN THAI ICT-RELATED FIRMS
Thailand is a host country to firms investing in the ICT industry. Many multinational firms, especially from Japan and the United States, have been investing in Thailand since the 1960s. The first ICT-related firm in Thailand was Japan’s Matsushita Corporation that set up a company under the name “National Thai” to produce radio and television sets for the domestic market. In this period, the only non-Japanese foreign-affiliated firm was the one set up by ITT, an American company, to produce telephone receivers and electronics parts.
In terms of trade, ICT products have been the major items for both exporting and importing. The share of computer products and integrated circuits (IC) in 2001 was 18 percent of the country’s total export value. The share of these ICT products to total export value has been constant at about 18 percent since 1998. Meanwhile, IC is the major imported item as well. In 2001, the share of IC was 8.8 percent of total import value. For IC, Thailand is the net importing country. In 2001, the value of IC imports was US$1,906 million greater than that of IC exports.
Table 5.1: Five Major Thai Export Items
Item 1998 1999 2000 2001 2002 (Jan-Nov) US$ Share US$ Share US$ Share US$ Share US$ Share million (%) million (%) million (%) million (%) million (%) Computer peripherals 7,851.0 14.4 8,121.6 13.9 8,739.5 12.2 7,947.5 12.2 6,883.8 12.2 Integrated circuits 2,278.7 4.2 2,944.6 5.0 4,484.0 6.4 3,512.2 5.4 3,141.8 5.4 Vehicles and parts 1,241.0 2.3 1,902.3 3.3 2,419.4 3.5 2,655.0 4.1 2,713.9 4.1 Garments 2,986.8 5.5 2,915.6 5.0 3,132.7 4.5 2,914.4 4.5 2,480.4 4.4 Jewellery 1,815.1 3.3 1,766.3 3.0 1,741.8 2.5 1,837.2 2.8 2,001.4 2.8 Source: Development of Business Economies.
Table 5.2: Five Major Imported Items
Item 1998 1999 2000 2001 2002 (Jan-Nov) US$ Share US$ Share US$ Share US$ Share US$ Share million (%) million (%) million (%) million (%) million (%) Electric machines 5,739.8 13.5 5,405.8 10.8 6,860.0 11.0 7,280.9 11.8 6,935.4 11.8 Industrial machines 3,989.2 9.4 3,966.2 7.9 5,546.1 8.9 6,051.4 9.8 5,856.7 9.8 Crude oil 2,877.0 6.8 3,856.3 7.7 6,105.6 9.8 5,756.0 9.3 5,312.3 9.3 Integrated circuits 3,556.2 8.4 4,412.7 8.8 6,441.8 10.4 5,418.8 8.8 5,035.3 8.8 Chemical products 3,636.7 8.6 3,939.9 7.9 5,175.1 8.3 4,815.6 7.8 4,832.6 7.8 Source: Development of Business Economies.
The 1970s was the development stage for integrated circuits in Thailand, characterized by the direct investment of major IC producers, such as National Semiconductor, Signeties and Data-General. The 1980s was a period of expansion and diversification of the ICT industry. Most firms, initially Japanese and American companies, invested in several kinds of ICT products. Currently, the main ICT products produced in Thailand are computer peripherals (such as monitors, printers, keyboards, hard disk drive and parts and PCBs) and integrated circuits.
Normally, the production process in Thailand is an assembling process that requires all important components brought in from abroad and products created locally are low-end. For example, Canon produces mainly dot matrix printers while Fujitsu produces HDDs that are mainly desktop drives. Both are low-end products. Therefore, the technology used in Thailand’s ICT industry is low-technology and labour-intensive requiring less skill. Since the production process is a downstream industry and products are for export, there does not exist a systematic forward and backward linkage in the industry. Even some components that the foreign affiliates purchase domestically are produced by the foreign affiliates. For example, the HDD makers in Thailand (IBM Storage, Fujitsu, Union Technology and Western Digital) purchase HDD components from foreign affiliates located in Thailand: They purchase spindle motors from Nidec, slider fabrication from Read-Rite and the base and cover from NHK Spring.
As noted, it can be seen that Thailand’s ICT-related firms play a small subcontracting role by supplying minor components for foreign firms in the ICT industry.
In order to understand the manpower situations in Thailand’s ICT-related firms, 11 firms were surveyed. The details of that survey are shown in Table 5.3.
Table 5.3: List of ICT-Related Firms for Case Study
Name Products Location (Province)
1. Circuit Electronic Industries Integrated circuit Pathumthani
2. NS Electronics Integrated circuit Bangkok
3. Drago PCB PCB Pathumthani
4. KCE Electronics PCB Bangkok
5. KR Precision Electronic components Ayuthaya
6. Kal-Com Electronics Electronic components Bangkok
7. Hana Microelectronics Electronic components Bangkok
8. Kyo Dai Enterprise PCBA Chachensao
9. SVI PCBA Nonthaburi
10. Team Precision PCBA Prachinburi
11. Technology Applications
Computer System PCBA Bangkok
Source: Interview survey by the author
According to the survey, there are four main reasons why firms in this industry have to import these components from foreign suppliers: First, the production technology belongs to foreign parent companies. Second, there are no domestic components because the production technology is not available in Thailand. The first and second reasons are related to each other. If the technology, which is specified to parent companies, is not transferred to firms in Thailand, components cannot be produced domestically. The third reason is that the quality of domestic components cannot meet the foreign parent company’s requirements. The last reason is that it is easier to deal with foreign suppliers who have already created long-term relationship with their parent companies.
However, Thai firms have small room to play in the Thai ICT industry. The ICT-related companies that produce final ICT products find that it is cost-efficient to secure some minor parts from Thai small firms. To control the quality and production costs of components, the ICT companies may force their suppliers to improve management systems, production facilities, monitoring systems or even add some production process that increases costs to
the suppliers. The ICT companies may support their suppliers technically as well. In some cases, the ICT companies help their suppliers in mould production that are specific for producing certain kinds of components or lend some machines and equipment to their suppliers. In several cases, the ICT companies send engineers to solve production problems and train suppliers’ staffs. In addition, ICT companies may also employ a reward system to motivate competition among suppliers.
Since most Thai firms are minor-components suppliers, for example, PCB and electronic parts, highly skilled labourers are not required. The labour skill requirement depends on the technology required for certain products. For example, the single-sided PCB and PCBA producers need only semi-skilled labourers. Therefore, they employ Thai workers who graduated from universities and junior colleges. They face fewer problems with a skilled-labour shortage, and they pay less attention to in-house training. Their main labour problem may be in the area of marketing. Several Thai firms have to employ Japanese or other foreigners to operate their marketing department. Foreign language and marketing skills are the weak points of Thai workers still.
Electronics-parts producers and multilayer PCB producers who need to apply higher technology are facing a shortage in skilled labour. The main problem is the academic institutes are not able to create a programme that produces graduates suitable for the needs of businesses, such as a process engineer, mechatronic engineer, manufacturing manager and IT director. The lack of English skills is a weak point of Thai engineers as well.
To cope with the skilled labour shortage, several firms have to employ foreign workers on a short-term contract basis. The main tasks of foreign workers are to solve the production problems, to operate the marketing department and to transfer know-how to Thai workers.
Firms that have reported having no skilled manpower shortage are ones that have decided to continue producing low-end components. In the current market situation, it may be too risky to invest in product development. Therefore, the semi-skilled manpower in use can satisfy the low-level production technology currently employed. The technical assistance received from the ICT-related companies or through a partnership system is able to solve the production problems in the short term. The partnership system is the
relationship between small Thai firms and foreign firms in both production and marketing. Thai firms may be the foreign firms’ suppliers or may be the producers of products under the foreign firms’ brand name. In return, foreign firms provide technical assistance and marketing assistance to Thai firms.
6. CONCLUDING REMARKS
For the past ten years, the Thai labour market has shown significant structural change. First, the market has shown high flexibility to changes in economic variables and has experienced long-run steady growth and an aging society. The average increase in the number of workers per year has been greater than the average increase of the overall population per year. The workforce of 25-44 year olds has increased by two million people in a ten-year period. Moreover, for the past ten years, the number of employed persons has been increasing at the same rate as the increases of people in the labour force.
Second, the majority of Thai workers have moved to non-agricultural sectors. The high growth rate of employment is seen in the manufacturing and service sectors.
Third, with the new compulsory education law, the educational level of Thai workers has been increasing – the number of workers with secondary schooling (nine years) has been increasing. However, the majority of Thai workers still only attain an elementary or less level of education.
Fourth, Thai labourers have been improving in labour productivity, especially in exporting manufacturing activities. However, compared to the labour productivities of neighbour countries, Thai labour productivity is still low.
Finally, with the changes in structure of industry, the demand for Thai labour has changed in both quantity and quality. The demand for labour in the manufacturing sector has been increasing dramatically. Meanwhile, the need for high-quality labour also has been increasing sharply, such as the demand for S&T manpower. In view of this, Thailand is facing a shortage of S&T manpower.
In order to cope with the new era of knowledge-based economy, the development of human capital is unavoidable. The Government has set up several agencies, such as the National Science and Technology Development
Agency and the Ministry of Information and Communications Technology. There have been several plans and policies to deal with human resources development in ICT in Thailand, such as the Ninth National Master Plan, the IT-2010 Plan and S&T-2020 Plan. The main targets are improving both quantity and quality of human resources in science and technology in Thailand.
Thai ICT-related firms play a minor role in Thailand’s ICT industry. The major players are foreign affiliates that produce final products in Thailand for export. Thai firms are their suppliers for the minor components that require low-technology skills to produce. Thus, they require less-skilled labours. For firms that produce higher-technology products, they solve the skilled labour shortage by employing foreign workers under short-term contract. These foreign workers not only help firms to solve production problems and operate marketing offices, but they also train the local workers.
REFERENCES
Asian Development Bank (ADB). 2002. “Technology and Poverty Reduction in Asia and the Pacific”, preface by Jorge Braga de Macedo and Tadao Chino. Development Centre Seminars.
Department of the Labour Protection and Welfare (2002). Year Book of Labour
Statistics. Ministry of Labour and Social Welfare.
Mephokee, Chanin (2001), “Impacts of Thai Industrialization on the Labour Market”, UNIDO research paper.
Mephokee, Chanin (2002). “Information Technology: Some Implications for Thailand”, in Kagami and Tsuji (eds.) Digital Divide or Digital Jump: Beyond “IT” Revolution. Institute of Developing Economies, Japan External Trade Organization.
Office of the National Economic and Social Development Board (2002). The Ninth Economic and Social Development Plan B.E. 2545-2549.
Office of the National Education Commission (ONEC) (2002). Synopsis of the National Scheme of Education B.E. 2545-2559.
United Nations Development Programme (UNDP) (1999). Human Development
Report. Oxford University Press. New York.
Vanichseni, S. (2002). “Human Resource Development in S&T in Thailand: Background for Discussion”, presentation paper, 26 December.
World Bank (2001). World Development Indicators. Washington DC. USA. www.industry.go.th www.nesdb.go.th www.nectec.or.th www.nitc.go.th www.nso.go.th www.oie.go.th