Vol. 3, pp. 1-6 Copyright©2004 by Chugokugakuen
Original Article
CHUGOKUGAKUEN Journal http://www.cjc.ac.jp/The Relation of Bone Mass to Experience of Fractures,
Diet, Exercise and Progress Years of Post-menarche
in Female Junior College Students
Sanae KoDepartment of Human Nutrition, Faculty of Contemporary Life Scieru:e, Chugokugakuen University, Okayama 701-0197, Japan
The quantitative ultrasound (QUS) method was used to measure the bone mass of the calcaneus among Chugoku Junior College students. The subject numbers and average age were 187 persons and
19.4
years, respectively. The osteosono-assessment index (OSI) calculated from the propagation speed of ultrasound (SOS) and transmission index (TI), a self-written history of bone fractures and diet, the number of years since the subject's menarche, and a personal history of exercise of each subject were analyzed and the following results were obtained.1.
A
majority of the subjects(32
persons) with a history of bone fractures broke bones in their fingers or hand, between the ages of nine and eleven. There is no significant difference of the bone mass parameters between subjects having bone fracture experience and those not having the experience. No correlation was observed between present bone mass parameters of the subjects and their past experience of bone fractures.2.
The present bone mass of the subjects is not significantly related to any previous dietary restrictions or the number of years since the subject's menarche.3.
The OSl and SOS were positively correlated to the total exercise scores of the subjects. Present bone mass related most intimately to exercise experienced during high school and then to the present exercise-regimen.A multiple regression analysis was conducted using OSI as the dependent variable and the exercise score and BMI (body mass index) as independent variables. The standard regression coefficient is higher between OSI and exercise scores than between OSI and BMI. The results strongly suggest that continuation of exercise after the teens is a very effective way to increase bone mass and to maintain peak bone mass (PBM).
Key Words: QUS, OS1, Fractures, Diet, Menarche, Exercise, Female junior college students
Introduction
Correspondingto:
Sanae Ko
Department of Human Nutrition, Faculty of Contemporary Life Science, Chugokugakuen University, 83, Niwase, Okayama 701-0197, Japan Tel&FAX; +81 86 293 1186
Itis very important for female students around the age of 20 to have a life style which can help to increase bone mass and to maintain the maximum bone mass attainedin
the latter half of their teens [lJ. However, there are many factors contributing to the decrease of bone mass
among the current generation of junior college students. These factors include a decrease in exercise compared with high school time and the disturbance of dietary habits due to a solitary life style, bad diet and so on. The author has analyzed the bone mass and dietary intake of female college students, and previously reported that the subjects with high bone mass (high osteosono-assessment index) have good nutritional habits, however the subjects with low body weight (BMI less than 18.5) have low osteosono-assessment index (OSI), possibly due to deviated dietary habits, such as a high intake of snacks and soft drinks, a low intake of vegetables, and a lack of exercise activities such as low number of steps per day [2J. In the present paper, the author analyzed the correlation between bone mass and some bone mass-influencing factors (history of bone fractures, diet, years since the subject's menarche and a history of exercise of the subjects) obtained from a questionnaire.
Subjects and Methods
1. Subjects
The subjects were 222 healthy female college students. In this report the author used the data of 187 subjects who answered the questionnaire completely (effective collection rate: 84.2%). Among them, 119 subjects (66. 6%) were students of Department of Human Nutrition at Chugoku Junior College and the others were students from different departments of the same college or from other colleges. Sixty of the students from Department of Human Nutrition were the same subjects reported in a previous paper [2J, in which the relation of bone mass to physical constitution, physical strength and dietary intake was examined.
2. Bone mass analysis
Bone mass of the right calcaneus was measured with the quantitative ultrasound method by using AOS-100 (Aloca Co., Ltd., Japan). The bone mass index in the present paper indicates the osteosono-assessment index, (OSI) calculated from the propagation speed of ultrasound (SOS) through the calcaneus and transmission index (TI) by the formula, [OSI= TI x SOS2J [3J. The OSI measured and calculated was compared with the standard OSI for the same age and sex. The percentage of the subject's OSI to the standard was expressed as Z score.
3. Items of questionnaire and analysis of the
results
1) The question for the experience of bone fractures:
Name of the bone broken and age when the injury occurred.
2) The question for the experience of dietary weight control: Frequency of dietary weight control; 0, 1, 2 or more times. Period of the dietary restrictions; approximately 1 month, 2 months, 3 months or more. Frequency and period of dietary restriction were scored (given marks), and the total score is shown as diet score.
3) The question for the menarche: The number of years since menarche was calculated by subtracting the age of menarche from the present age. Results are shown in years and months.
4) The question for the history of exercise: The following items related to the subject's history of exercise were examined and exercise was evaluated as follows. For elementary school ages, outdoor games and sports played outside of regular class work, kinds of sports were provided. For junior and senior high school ages, name of school sports club, length of participation in the club and extent of exercise were ascertained (mea-sured in terms of eagerness to participate, occasional absence from club activities, almost no participation in the club); Non-school related sports activities were examined according to the kind of sport and the extent of exercise (exercise frequency/week). For junior college ages (including the present situation), questions were concerned the name of sports clubs in which the subject has been participating, the extent of exercise, the extent of daily activity and matters kept in mind in daily life. Answers to these questions were scored (given marks) and evaluated according to the kind, length and extent of the exercise.
4. Statistical analysis
Comparison of average values was done with a signifIcance test of the student's t-test. The relationship of the ultrasound method parameters to the experience of exercise and the other items answered in the questionnaire was attained by performing a Pearson correlation analysis. They were performed with stepwise multiple regression analysis. These tests were done with signifIcance level of 5%or 1%. These statistical analyses were conducted by using Excel Statistics 2000.
Results and Discussion
1. Characteristics of the subjects
Table I. Characteristics of the subjects!)
!)The subjects examined 187 female students in a junior college BMI: Body mass Index
SOS: Speed of sound TI: Transmission Index
OSI: Osteosono-assessment Index
report are shown in Table 1. Comparing physical status of the subjects with that of the data of the 2001 National Nutrition Survey, the mean height of the subjects is almost the same as the national average. Although the body weight and BMI of the subjects are slightly higher than those of the national average, the overall physical status of the subjects is roughly in line with the national standard. The Z score, the percentage of the sample to the standard OSI, is 102%. This indicates that the subjects, as a group, have average characteristics. The correlation coefficient, obtained by simple regression analysis, with parameters of the quantitative ultrasound method and several factors (including physical status, exercise score, diet score, number of years since
menar-Age (years) Menarch age (years)
Progres years of post-menopause(years) Height (em) Body weight(kg) BMI (kg/m') SOS TI OSI (X106 ) Mean±SD 19.4± 1.0 12.2 ± 1.3 7.2
+
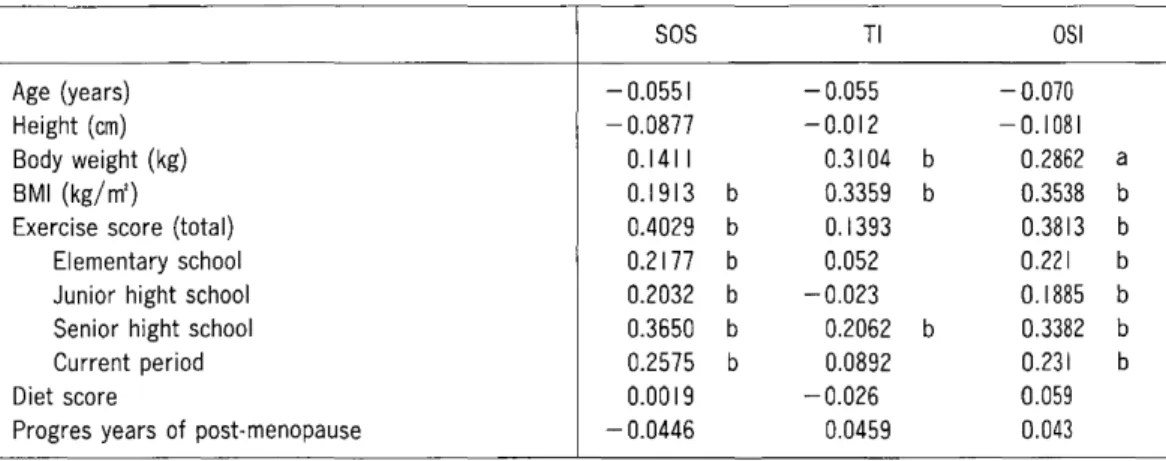
1.6 157.5 ± 4.9 52.5 ± 8.0 21.2 ± 3.1 1569 ± 26 1.126 ±O.132 2.769±0.3171che) is shown in Table 2. As reported previously [5], there was no correlation between bone mass (OSI) and age, or between bone mass and height in subjects younger than 40. Bone mass of the calcaneus, a load bone, is influenced by weight [2, 5J. Among parameters of the quantitative ultrasound method, the parameter directly influenced by weight was not SOS but TI (Table 2). This result is in agreement with the data reported in a previous paper [6].
2. Experience of fractures
Thirty-two subjects (17.1%of the analyzed subjects) experienced a bone fracture. These included three people who broke bones two times (Table 3). Bone fractures occurred most frequently (16 cases; 45.7%) in the fIngers, and the sum total of fractures of fmgers, upper extremities and clavicles amounts to 82.9%. The age at which the injuries occurred were largely (19 cases; 51.4
%)between 9 and 11 years old. This corresponds to the age at which a spurt in height occurs in females [5
J.
The long bones in females of these ages lengthen so rapidly that the strength cannot match the growth speed, there-fore, the long bones weaken and the frequency of bone fractures increases [6J.
The present result corresponds to the physiological change of strength of the long bones. No correlation was observed between present bone mass parameters of the subjects and their past experience of bone fractures (Table 3). Although there is a report [7J that indicates that bone mass was influenced by the immobility of broken bones during medical treatment, the present subjects do not exhibit such influences.It
is possible that because the bone fractures in the subjectsTable 2 Correlation coeficient due to simple regression analysis with ultrasound method's parameters and each factors Age (years) Height (em) Body weight (kg) BMI (kg/m2 )
Exercise score (total) Elementary school Junior hight school Senior hight school Current period Diet score
Progres years of post-menopause
SOS - 0.0551 - 0.0877 0.1411 0.1913 b 0.4029 b 0.2177 b 0.2032 b 0.3650 b 0.2575 b 0.0019 - 0.0446 TI - 0.055 -0.012 0.3104 b 0.3359 b 0.1393 0.052 - 0.023 0.2062 b 0.0892 -0.026 0.0459 OSI - 0.070 -0.1081 0.2862 a 0.3538 b 0.3813 b 0.221 b 0.1885 b 0.3382 b 0.231 b 0.059 0.043 a: p<0.05 b: p<0.0 I
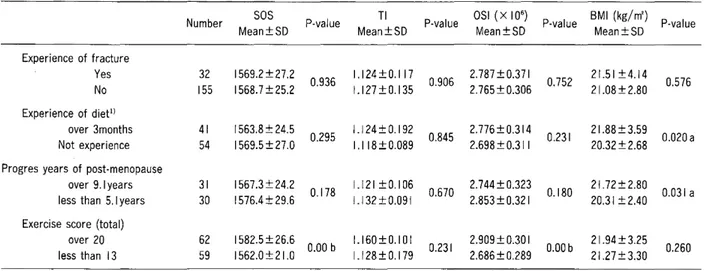
Table 3 The examination of significant difference of each question items
Number SOS P-value TI P-value OSI (x10
6 )
P-value 8MI (kg/m') P-value
Mean±SD Mean±SD Mean±SD Mean±SD
Experience of fracture Yes 32 1569.2 ± 27.2 0.936 1.124±0.117 0.906 2.787 ± 0.371 0.752 21.51 ±4.14 0.576 No 155 1568.7 ± 25.2 1.127 ± 0.135 2.765 ± 0.306 21.08 ±2.80 Experience of diett) over 3months 41 1563.8 ± 24.5 0.295 1.124±0.192 0.845 2.776±0.314 0.231 21.88±3.59 0.020 a Not experience 54 1569.5 ± 27.0 1.118±0.089 2.698 ± 0.311 20.32 ± 2.68 Progres years of post-menopause
over 9.1 years 31 1567.3 ± 24.2
0.178 1.121 ± 0.1 06 0.670 2.744±0.323 0.180 21.72± 2.80 0.031 a less than 5.1 years 30 1576.4 ± 29.6 1.132±0.091 2.853 ± 0.321 20.31 ±2.40 Exercise score (total)
over 20 62 1582.5 ± 26.6
0.00 b 1.160±0.101 0.231 2.909 ± 0.30 I O.OOb 21.94 ±3.25 0.260 less than 13 59 1562.0±21.0 1.128 ± 0.179 2.686 ± 0.289 21.27±3.30 a: p<0.05 b: p < 0.01
The subjects examined were 187 female students in a junior college.
occurred mostly in the upper extremities, there was almost no limitation of physical activity required, and therefore, the bone mass of the calcaneus, a load bone, was not influenced by the bone fracture.
3. Experience
ofdiet
Seventy-one percent of the subjects experienced diet-ary weight control (dietdiet-ary restriction for cosmetic rea-sons) (Tables 2 and 3). No signifIcant correlation is observed between diet score and bone mass parameters (Table 3). There is no signifIcant difference of bone mass between subjects who did not diet and those who dieted for longer than 3 months. In the case of the present subjects, the average weight and BMI were signifIcantly lower in those who did not diet than in those who did. Subjects who did not diet (29.3%)showed a significantly higher incidence of low body weight (BMI less than 18.5) than those who dieted. This group has problems with eating habits and daily activity as described in the Intro-duction. The present result confrrmed that it is necessary for a slim person to pay more attention to diet and daily activity.
4. The number of years since menarche
The mean age of menarche for the present subjects was 12.2 years old, and mean number of years since menarche, which are coincident with exposure period to estrogen, was 7.2 years (Table 1). Although there was almost 6 years difference in the minimum number of years (3.9 years) and the maximum number of years (10.0 years) since menarche, no correlation was observed between the number of years since menarche and bone mass
parame-ters (Table 3). The same result was observed when the effects of BMI and exercise experience were excluded. No difference in bone mass parameters was observed between the group with a long time (more than 8.9 years) elapsed since menarche and the group with a short time (less than 5.1 years) elapsed since menarche. Many reports suggest that there is positive correlation between the age of menarche and bone mass [8, 9
J.
These fmdings are not conclusive, however, as it was also reported that even when menarche was late, the effect of menarche on bone mass is not signifIcant, being overshad-owed by the effects of other factors such as body weight, nutrition, exercise and so on [10, IIJ. Nakane, et al. reported that effect of age of menarche on bone mass is limited to within 10 years after menarche and then the effect decreases gradually over time [12J. In the case of the present subjects, there was no correlation between the age of menarche and bone mass even though the numberTable 4 Correlation coeficient due to partial regression analysis with ultrasound method's parameters and each exercise score
Exercise score SOS OSI
Total 0.380 I b 0.3366b
Elementary school 0.0192 0.0491 Junior hight school 0.1087 0.0953 Senior hight school 0.2427b 0.1968b Current period 0.1544a 0.1095 a: p<0.05 b: p<0.0 I
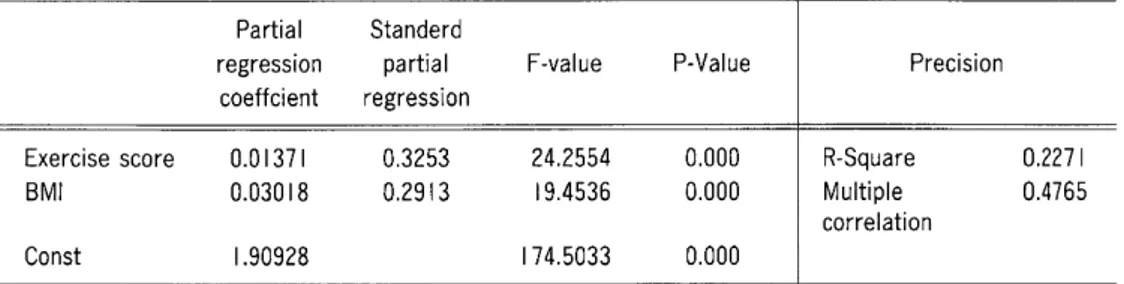
Table 5 The result of stepwise multiple regression analysis
Partial Standerd
regression partial F-value P-Value Precision coeffcient regression
Exercise score 0.01371 0.3253 24.2554 0.000 R-Square 0.2271
8MI 0.03018 0.2913 19.4536 0.000 Multiple 0.4765
correlation
Const 1.90928 174.5033 0.000
The Subjects were 187female students in a junior college. The dependent variable is the OSI (osteosono index). F-value is significant in p<0.05.
Table 6 The Analysis of variance
Factor
Regression Residual
OF Sum of squares Mean square
2 4.2474 2.1237 184 14.4574 0.0786 F-Value 27.0285 P-Value 0.000 F-value is significant in p<0.05.
of years since menarche is less than ten, this is probably due to the fact that the estrogen effect on bone mass in the years after menarche is overshadowed by the effects of other factors as reported [10-12J.
5. Experience of exercise
The OSI and SOS were positively correlated to the total exercise score (r= 0.403, p
<
0.01, r= 0.381, p<
0.01) of the subjects (Table 4). This result was significant even after adjustment for age and body weight. Concerning the age period of the exercise, OSI and SOS correlated most significantly to the exercise experience during high school (SOS r=
0.365,<
0.01 OSI r=
O. 338, p<
0.01), and then to present exercise (r=
0.258, p<
0.01 r= 0.231, p<
0.01) (Table 2). The experience of exercise in elementary school and in junior high school was not signifIcant after adjustment for age and body weight. It is thought that the calcaneus attains peak bone mass around 15 years of age (8).These results suggest that the stimulation of the bone from exercise contributes to increased bone mass, and that the most effective period for exercise, on bone mass increment, is during senior high school ages, a time when bone growth stops, and bone mass increases. Omasu et al. (6) reached the same conclusion.
6. The result of stepwise multiple regression analysis
The factors determining bone mass are divided largely
into heredity factors and environmental factors. However, consensus on the contribution rate of each of these to bone mass has not yet been determined (13). Neither has the contribution rate of nutrition and exercise to bone mass been determined. Here, experience of exercise and BMI were extracted from the factors which affect bone mass. Then, the' multiple regression analysis by using OSI as a dependent variable and by using exercise score and BMI as independent variables was conducted. The results are shown in Table 4. The standard regression coefficient is higher between OSI and exercise scores (r= 0.325) than between OSI and BMI (r= 0.291).
The multiple correlation is low (R=0.227), but result of examination of a coefficient of determination is also significant (P
<
0.000) (Table 5). It has been concluded from the above results that experience of exercise is an influencing factor on OS1.The conclusion is that continuation of exercise during and after the late teens is effective in attaining increment of bone mass and maintaining peak bone mass (PBM), and that the exercise has a stronger effect on bone mass than the load of body weight.
Acknowledgments. This work was supportedinpartbya Grant of the Promotion and Mutual Aid Corporation for Private School of Japan(toS.K.).
References
I. Bonjour JPH, Theintz G, Buchs B, Siosman D and Rizzoli R: Critical years and stages of puberty for spinal and femoral bone mass accumulation during adolescence. J Clin Endocrinol Metab(1991)73,
555-563.
2. Ko S: The relation of bone mass to physical constitution, physical strength and dietary intake in female students of a junior college. CHUGOKUGAKUEN Journal (2002) 1, 19-25.
3. Aloca Co.Ltd: The strong points of the quantitative ultrasound device, AOS-IOO. 5-1I. (in Japanese)
4. A Society for the Research of Health and Nutrition: The national nutrition survey200I. Daiichi-syuppan(2003) 114-115. (in Japanese) 5. Ko S: Bone mass measurement of calcaneus by quantitative ultra-sound method (QUS). CHUGOKUGAKUEN Journal (2003)2, 19-25.
6. Omasu F, Kitagawa J, Koyama K, Tanaka M, Asakawa K and Nakahara V: The relation of calcaneal ultrasound bone parameter to physical activity in Japanese adult females. Osteoporosis Jpn(2002)
1, 99-108.
7. Sakai A: The decrease in bone mass in association with decrease of exercise. Handbook of diagnostic and therapeutic practice of osteopor-osis Nakamura T, Mastumoto Ted. (2002) 60-74. (in Japanese) 8. Nakabayasi T, Hirota T, Yamanisi S, Sirokawa N, Takeda Hand
Hirota K: Factors differentially affecting on lumbar vertebrae,
prox-imal portions of femoral bones and systemic bones in increasing, sustaining and decreasing phases of bones. Osteoporosis Jpn(1997)
5, 213-218. (in Japanese)
9. Takahasi V, Minamitani K and Kobayashi V: Spain and femoral bone mass accumulation during normal adolescence: comparison with female patients with sexual precocity and with hypogonadism. J Clin Endocrinol Metab(1996)81, 799-808.
10. Blum M, Harris SS and Must A: Weight and body mass index at menarche are associated with premnopausal bone mass. Osteoporosis Int(200I) 12, 588-594.
II. Galuska DA and Sowers MR : Menstrual history and bone density in young women. Journal Women's Health Gend Based Med (1999) 8,
647-656.
12. Nakae M, Douchi T, Imamura A, Ube H, Matuo T: Effect of the time of menarche on bone mineral mass after the menarche. Osteoporosis Jpn(2003)3, I I I-I13(in Japanese)
13. Tanaka H: Change of bone mass in a growth phase (from infant phase to sexually ripening phase) Diagnostic and therapeutic handbook of osteoporosis. Nakamura, T., Mastumoto, T. ed. (2002) 60-74. (in Japanese)