IMPLICATION TO ACHIEVE SUSTAINABLE ELECTRICITY
SUPPLY IN INDONESIA -An idea of Decentralized
Electricity
System-著者
Dyani Dindha Ayu Mitra
学位授与機関
Tohoku University
MASTER’S THESIS
IMPLICATION TO ACHIEVE SUSTAINABLE
ELECTRICITY SUPPLY IN INDONESIA
-An idea of Decentralized Electricity System-
Dindha Ayu Mitra Dyani
A9GM5204
TOHOKU UNIVERSITY
July 2011
i
IMPLICATION TO ACHIEVE SUSTAINABLE ELECTRICITY SUPPLY IN INDONESIA
-An idea of Decentralized Electricity System-
Dindha Ayu Mitra Dyani A9GM5204
TABLE OF CONTENTS
Table of Contents ... i
List of Tables ... iii
List of Figures ... iv
CHAPTER 1 – Introduction ... 1
1.1 Background of the Study ... 1
1.2 Objective of the Study ... 4
1.3 Systematic Discussion ... 5
CHAPTER 2 – Framework of the Study ... 7
2.1 Previous Study ... 7
2.1.1 Market Reform Preparation ... 7
2.1.2 Tariff Adjustment to Reflect Costs ... 8
2.1.3 Investment Plan ... 8
2.2 Main Points in Electricity Supply Study in Indonesia ... 8
2.2.1 Electricity Supply ... 8
2.2.1.1 The Generation Process... 10
2.2.1.2 The Transmission Process ... 10
2.2.1.3 The Distribution Process ... 10
2.2.2 Electrification Ratio ... 11
2.2.3 Decentralization ... 11
2.3 Characteristic of My Study ... 12
CHAPTER 3 – Data and Analysis ... 15
3.1 Energy Condition in Indonesia ... 15
3.1.1 Energy Resources Status ... 15
3.1.1.1 Fossil Fuel ... 15
3.1.1.2 Renewable Resources... 17
3.1.2 Energy Production ... 18
3.1.3 Energy Consumption ... 19
3.2 Electricity Situation in Indonesia ... 19
3.2.1 Overview of the Industry ... 19
3.2.2 Power Generation ... 20
3.2.2.1 Electric Power Plants (according to PLN and private) 20 3.2.2.2 Installed Capacity ... 22
ii
3.2.2.3 Electricity Infrastructure ... 23
3.2.3 Electricity Transmission System ... 24
3.2.3.1 Transmission Service ... 24
3.2.3.2 Transmission Loss Rate ... 25
3.2.4 Electricity Distribution System ... 25
3.2.4.1 Electricity Tariffs ... 26
3.3 Indonesian Law Regarding Electricity ... 27
3.3.1 Law of the Republic of Indonesia Number 15 year 1985 ... 27
3.3.2 Law of the Republic of Indonesia Number 20 year 2002 ... 27
3.3.3 Law of the Republic of Indonesia Number 30 year 2009 ... 28
3.3.4 Comparison of Electricity Law ... 28
3.4 Electrification Ratio ... 31
3.5 Electricity Problems and Analyzing... 32
3.5.1 Problems Inside PLN Management ... 32
3.5.1.1 Capital Investment ... 32
3.5.1.2 Tariff ... 33
3.5.1.3 Energy Policy ... 35
3.5.2 Low Electrification Ratio Problem ... 36
CHAPTER 4 – Research Result ... 39
4.1 Legal Basis of Decentralized Electricity ... 42
4.1.1 Law No.32 year 2004 regarding Regional Autonomy ... 43
4.1.2 Government Regulation No.3 year 2005 about the Changes in Government Regulation No.10 year 1989 regarding the Provision and Utilization of Electricity ... 44
4.1.3 Law No.30 year 2009 regarding Electricity ... 45
4.2 Instruments of Decentralized Electricity ... 46
4.2.1 Financing Support ... 46 4.2.1.1 Grant-Based Financing... 46 4.2.1.2 Revolving-Based Financing ... 47 4.2.1.3 Commercial-Based Financing ... 47 4.2.2 Subsidies ... 47 4.2.3 Technical Assistance ... 48
4.3 Decentralized Electricity System Using Micro-hydro ... 48
4.3.1 Stakeholders ... 50
4.3.1.1 Government and Regional Governments ... 50
4.3.1.2 Service Provider ... 50 4.3.1.3 Village Community ... 50 4.3.2 Regulation ... 51 4.3.3 Financing ... 51 4.3.4 Implementation ... 52 4.3.4.1 Cinta Mekar ... 53 4.3.4.2 Garung ... 57 4.3.4.3 Tulak Tallu ... 60 4.3.4.4 Mekarjaya ... 60 CHAPTER 5 – Conclusion ... 63
iii
References ... 65 Acknowledgement ... 68
LIST OF TABLES
No Title Page
1 Indonesian Energy Consumption, Economy and Population Growth 2
2 Oil Reserves (Billion Barrels) 16
3 Natural Gas Reserves (TSCF) 16
4 Renewable Energy Potential in Indonesia (2007) 17
5 Energy Production (Thousand BOE) 18
6 Final Energy Consumption by Type (Thousand BOE) 19
7 Electricity Production (GWh) 22
8 Installed Capacity (MW) 22
9 Length of Transmission Lines (kilometer circuit-kmc) 24
10 Energy Losses (GWh) 25
11 Electricity Tariffs (Rp/kWh) 26
12 Comparison of the Electricity Laws 29
13 Electrification Ratio (%) 31
14 Coal Supply (Thousand Ton) 36
15 Electrification Ratio in ASEAN Countries in 2008 37 16 Illustration on Typical Investment of Diesel Generator and
Micro-hydro Power Plant
41
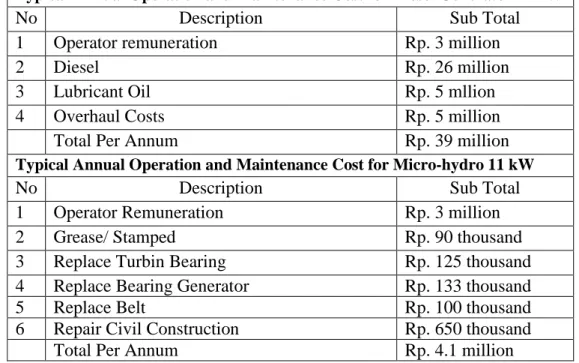
17 Illustration on the Typical Annual Operation and Maintenance Cost of Diesel Generator and Micro-hydro Power Plant
42
18 Micro-hydro Power Plant Installed Capacity 52
19 Basic Information on Three Existing Micro-Hydro Projects 53
iv
LIST OF FIGURES
No Title Page
1 A Generic Electricity Supply Network 9
2 Framework of the Study 13
3 Overview of Power Sector Infrastructure 23
4 Problems inside PLN’s Management 32
5 PLN’s Sales Revenues and Cost of Supply by Region (in US cents) 33 6 Comparison Average Electricity Tariffs and Average Generation
Cost (Rp/kWh)
34
7 The Structure of Legal Basis on Decentralized Electrification 43 8 Proposed Decentralized Electrification System Using Micro-hydro
Power Plant
1 CHAPTER 1 INTRODUCTION
1.1 Background of the Study
Every human being needs at least three basic things to survive, fresh air, clean water and energy. Energy in simple terms can be defined with quantity that is often understood as the ability to perform work [1]. This quantity as the contained energy can be assigned to any particle, object, or system of objects as a consequence of its physical state. Energy is used for all aspects of human life, to meet daily needs, economic and social activities.
Energy sources can be divided into two kinds, namely renewable energy and non-renewable energy resources [2]. The first is energy like solar energy from sunlight, wind, geothermal energy from heat inside the earth, biomass from plants, which includes firewood from trees, ethanol from corn, and biodiesel from vegetable oil and hydropower from hydro-turbines at dam. The second is energy which cannot be replaced or is replaced only very slowly by natural processes. Primary examples of non-renewable energy resources are the fossil fuels such as oil, natural gas, and coal.
Both forms of energy have an important role for the continuity and stability of human life. So that along with economic and population growth, the demand of energy consumption is also increasing, because in everyday life human need energy to warm the body, running the machinery industry, illuminates the highway, and various other energy functions.
Energy sources can be changed or converted into refined oil, LNG, LPG and electricity. Electricity is the flow of electrical power or charge. It is both a basic part of nature and one of human most widely used forms of energy [3]. Actually Electricity is a secondary energy source, also referred to as an energy carrier, which is produced from a primary source [4]. Electricity is a very important commodity in the world. Most of 90% of the population on the earth's surface is dependent on electricity usage. This number will increase, as evidenced by many places built for power plant to generate electricity.
Electricity system includes the generation, transmission and distribution. Generation is the production of electricity which is done in the center of power
2
station. Transmission or distribution is a transfer of power from central power station to a substation that is located adjacent to the location of the consumer in the form of individuals and industry. Distribution aims to distribute electrical energy from substations to distribution substations and the users [5].
Electricity in sufficient quantities is one of important factor in advancing the economy and improves people's welfare. The increasing electricity demand will in line with socio-economic development of society. Changes in lifestyle, the use of high technology are also supporting factors for the increasing electricity demand. This condition also experienced by the state of Indonesia. Economic and population growth in Indonesia have made the demand for energy and electricity continue to increase, with an average growth rate of around 10% per year [6]. Table 1 below shows the growth of nominal GDP as the indicator of economic growth, population growth and the final energy consumption.
Table 1
Indonesian Energy Consumption, Economy and Population Growth
2001 2002 2003 2004 2005 2006 2007 2008 GDP Nominal (Trillion Rupiah) 1,684 1,863 2,014 2,296 2,774 3,339 3,957 4,778 Population (Million) 208 212 215 217 218 222 225 228 Final Energy Consumption (Million BOE) 484 481 519 541 540 538 576 643
Source: Handbook of Energy and Economics Statistics of Indonesia, 2009:1
The rapid growth and progress in various fields entails problems of the increased need for large electricity supply. Therefore, to meet the challenges the development in electricity sector should be planned carefully. Development should consider the balance of demand and supply of electric power in order to avoid oversupply or shortage that could cause huge losses. Oversupply of electricity means a wasted investment, otherwise the electricity supply shortage causes power blackouts which are very detrimental to various socio-economic activities.
Indonesia's electricity sector is handled by the National Electric Power Company (Perusahaan Listrik Negara, hereafter PLN) which was founded in
3
1950. In 1984, PLN's total installed capacity amounted to 4.6 GW, which had increased to 18.94 GW in the year 1997. But the economic crisis in 1997 made growth in installed capacity of electricity different from previous years. The economic crisis made PLN heavy burden. The collapse of Indonesia's currency in 1997 has plummeted the regulated electricity selling prices from about $0.07 per kWh to fewer than $0.03 per kWh. Since then, PLN reported that revenue stream was not able to cover the cost of providing electricity supply, PLN also announced losses of $1.4 billion in 1998 [7].
These losses have an impact on the performance of PLN's power supply. PLN's ability to invest is very limited, whereas after the economic crisis in 1997, Indonesia is still experiencing high growth for electricity demand. Even under the low economic growth, the demand increased at 6-8% annually up to 2010. The relatively high demand growth is associated with the country's low electrification ratio, about 66% and positive economic after the crisis. That means there are about 75 million people who have not been able to access electricity.
In addition to the above problems, there are many more issues facing PLN as an electric energy provider in Indonesia. One of them is in terms of energy availability of primary energy for generating electricicty. It is ironic, Indonesia as a country with abundant natural resources could not meet the need of energy for power generation. For instance, Natural Gas Power Plant with capacity of 5 GW, faces the decreasing production by approximately 15% due to the unavailability of natural gas as primary energy, so this power plant operates using diesel which is more expensive than natural gas [8].
Still in contact with primary energy, until the year 2008 the percentage of electricity production by type of primary energy, oil 36%, coal 35%, natural gas 17%, hydro 9% and 3% came from geothermal. This indicates that PLN use non-renewable energy in large numbers, while fossil fuels are the largest emission production that can damage the environment.
The problems inside PLN management above inhibit equitable access to electricity for Indonesian people. As already stated above, the main problem of electricity in Indonesia is low electrification ratio. There are 34% of
4
Indonesian people who have not been able to access electricity until 2010 [9]. Lack of access to electricity can hamper economic growth and welfare of Indonesian people, especially in villages, where PLN’s service is difficult to reach because of limited distribution. In many poorer countries, electricity is supplied only to major towns, and even then, power cuts are commonplace. This not only reduces the quality of life of those living in such countries, but also hampers productivity and ultimately ensures that those countries have a low GDP [4].
Households that do not have electricity connection yet are generally scattered and are far from centers of electricity demand. To increase the electrification ratio, it is necessary to develop power plants based on local resources. Since Indonesia has limited and depleted oil reserves, it is necessary to develop other energy sources, such as coal, natural gas and renewable energy to increase energy security in the long term, the Indonesian government should encourage the use of new and renewable energy resources as alternatives for power plants.
Considering the geographical condition of Indonesia as an archipelago, with the demand and power plant distribution unevenly distributed across the region and electricity interconnection still limited, it is necessary to make a breakthrough in local energy generation, adopt decentralize electricity to improve local energy independence. Local electricity generation must prioritize use of local energy resources that would be expected to be more economical since transportation/distribution costs would get reduced. This will improve local energy security and ensure sustainability of economic development [10].
1.2 Objectives of the Study
Based on the above background of the study, I am interested in conducting research with the title "Implication to Achieve Sustainable Electricity Supply in Indonesia, an Idea of Decentralized Electricity System". In this research, I will describe the condition of electricity sector in Indonesia, including the generating, transmission and distribution, and explained about
5
the Laws regarding electricity. Then, I will formulate problem facing Indonesia regarding electricity, analyze and provide solution to solve the problem, to enhance the work performance of PLN, government and the cooperation from the citizens. Problem solving is limited into the main problem, low electrification ratio in Indonesia. While the problems inside PLN’s management are beyond this research. In this study I will treat a problem under two heads:
1. To understand electricity situation in Indonesia
2. To consider implication to enhance electrification ratio and achieve sustainable electricity supply in Indonesia
1.3 Systematic Discussion
My study is composed of five chapters and their contents and main items discussed there are as follows:
In chapter I, I will introduce the outline of the research background and research objectives.
In chapter II, I will examine previous study, characteristic of the study, theories related to the research themes, as a basis for discussion and analysis of the main points of the existing problems.
In chapter III, I will suggest a general picture of the research object and data collected, analyze and discuss these data to provide solution for problem discussed.
In chapter IV, the solution of the problem found in previous discussion will be presented and discussed.
Finally in chapter V, I will present the conclusion of the study that can be used as a performance improvement for the company as research object, government and community participation.
6 References 1. http://en.wikipedia.org/wiki/Energy 2. http://www.eia.gov/kids/energy.cfm?page=about_sources_of_energy-basics 3. http://www.eia.gov/kids/energy.cfm?page=electricity_home-basics
4. Beggs, Clive. 2009. Energy, Management, Supply and Conservation, pp.2 and 33. Great Britain: Elsevier.
5. Akhadi, M. 2009. Ekologi Energi (Ecological Energy), p.15. Yogyakarta: Graha Ilmu.
6. Elyza, Rizka and Salim, Nasrullah. 2001. Life after Oil, p.21. Jakarta: Pelangi
7. Nugroho, H., Thamrin, S and Hardjakoesoema, G. 2005. Electricity Industry in Indonesia after the Implementation of Electricity Law Number 20/2002: Proposed Agendas to Support Implementation of the Law. 28th
Annual International Association for Energy Economic Conference. 2005.
Taipei.
8. Iskan, Dahlan. Dampak Pembangkit Listrik yang "Salah Makan" (The Impact of Unsuitable Primary Energy to Generate Electricity). Java Post
Newspaper. 18th Nov. 2009.
9. Ministry of Mineral and Energy Resources. 2010. Handbook of Energy
and Economics Statistics of Indonesia, p.vii. Jakarta.
10. Boedoyo, Sidik and Sugiyono, Agus. 2010. Tech Monitor: Decentralized
Power Generation in Indonesia Current Issues and Prospect, 27.3
7 CHAPTER 2
FRAMEWORK OF THE STUDY
In this chapter I intend to examine previous study and explain characteristic of the study. I also aim to explain briefly about electricity supply, electrification ratio and decentralization. And then, I will explain the framework of my study.
2.1 Previous Study
Firstly, I mention a study which discussed the problems faced by PLN. This study is being carried out by Nugroho, Thamrin and Hardjakoesoema [1]. They examined the problems and recommend solutions to overcome the problems to enhance the work performance of PLN and the government.
They found several problems facing PLN. They said ”in general the major problems in Indonesia’s electricity sector, including its PLN internal organization can be categorized into four main subjects: tariff, debt restructuring, renegotiation of Independent Power Producers (IPPs) and, sector and corporate efficiency”. After discussing the problem, they proposed some recommendations for further restructuring of the Indonesian electricity sector, as follows:
2.1.1 Market Reform Preparation
To be successful in a competitive market establishment, several supporting mechanisms will be required. First, there shall be a competitive market mechanism and security of supply in the primary energy supply side. Second, there shall be sufficient of generation to enter market, along with the availability of open access and sufficient capacity on transmission line to avoid bottlenecking, and reliability of distribution system to ensure the deliverability of electricity to customers. Third, other supporting mechanism, such as financial transaction capability which mandates a better metering and monitoring system, trained human resources to run the competitive market systems must be available. Fourth, a mechanism is mandatory to handle the future IPPs to fill in the necessary additional capacity, in particular on how it can participate in the competitive market, along with IPPs, trader. Fifth, it is necessary to have regulations that support the smooth operation of the market,
8
including taxation, investment, procurement, publish project listing, publish supply and demand on the competitive market and so on.
2.1.2 Tariff Adjustment to Reflect Costs
In electricity sector, where the tariff structure is irrational, Government of Indonesia (GOI) needs to enhance such an adjustment. In doing so, the tariff structure can be divided into the one of commercial based on market mechanism and social function borne by the GOI.
2.1.3. Investment Plan
A schematic and prudent investment plan has to be initiated and schemed to improve additional power capacity. In the short and medium terms, old and inefficient generation facilities of PLN burning coal and petroleum should be rationalized. In the longer term, the new power generation facilities should be able to meet the projected additional demand of electricity.
This study come to the conclusion that to achieve the adequate supply, much more efforts have to be paid with major focus on generating, supervisory, regulatory mechanism and on retails side.
2.2 Main Points of Electricity Supply Study in Indonesia
Here I point out the main points of electricity problems in Indonesia in addition to the study mentioned above.
2.2.1 Electricity Supply
Almost every human activity needs electricity to support their activities. Electricity is a source of energy that is channeled through wires or other conductive [2]. While according to Energy Information Administration (EIA), electricity is the flow of electrical power or charge. It is both a basic part of nature and one of human most widely used forms of energy [3].
Electricity is secondary energy or energy carrier. It is important to appreciate the difference between primary energy and delivered or secondary energy. For example, coal is primary energy which can be burnt in a power station to produce electricity. By contrast, electricity is always a secondary fuel, which is produced from a primary source [4].
9
World Development Indicators noted the importance of electricity for human beings "Use of energy in general, and access to electricity in particular, are important in improving people's standard of living” [5]. Based on that statement it is also important to understand the electricity supply network, like shown in figure 1:
Figure 1
A Generic Electricity Supply Network
Source: Energy, Management, Supply and Conservation, 2009:34
Electricity, as saleable commodity, is generated in power stations, from a variety of primary energy sources. These power stations are all connected to a high voltage transmission grid, which is used to transmit electricity over long distance. At various points in the system, electricity is drawn from the transmission grid and distributed to consumers. This involves the use of local distribution network which distributes electricity at a reduced voltage, say 33kV or 11kV, to local substations, where the voltage is further reduced, say 415 V, before being supplied to consumers. Finally, the electricity is sold to customers and the amount consumed is recorded using meters. In broad term, the various component parts of an electric supply industry can be categorized as follows [4]:
10 2.2.1.1 The Generation Process
This takes place in the power stations and involves the conversion of primary energy from fossil fuel or other sources into electricity. It is at the generating stage that all the pollution associated with electricity production is created. Electricity generation is complex and costly business, which involves the construction, operation and maintenance of large power station and the purchase, transportation and storage of primary energy. Because electricity cannot be stored easily, it is necessary for the generating companies to have enough spare capacity to cope with high peaks in demand which occur at certain times of the year. Therefore, many smaller and less-efficient power stations are rarely used and only operate when demand on transmission grid is high. This situation is very uneconomic because even though these power stations are infrequently used, they still need to be maintained. Consequently, the generating companies have to recover the cost maintaining inactive power stations from the electricity produced by the active ones.
2.2.1.2 The Transmission Process
This is the process whereby electricity is transported through a transmission grid over long distance around the region or country. The transmission grid is operated at a very high voltage, for example, 400kV, in order to minimize the energy wastage. Operating transmission grid involves the constructions and maintenance of a very large piece of infrastructure, which may extend for thousands of miles, sometimes over very inhospitable terrain. Naturally large costs are involved in operating such a network and these must be recovered from the sale of any electricity which is transmitted through the grid.
2.2.1.3 The Distribution Process
Once electricity has been transmitted over a long distance at high voltage, it must then be distributed to the various end-users. At various point along the transmission grid electricity will be siphoned off into local distribution network. These distribution networks are regional grids, operating at a lower voltage, which distributed the electricity around a city or a particular locality. During the distribution process the voltage of electricity is stepped down
11
(through the use of substations) to the voltage required by the consumers. As with the transmission grid, the cost involved in maintaining and operating a distribution network must be recouped from the revenue received from the electricity sold.
2.2.2 Electrification Ratio
According to World Bank, definition of electrification ratio is the percentage of household with electricity [6]. Meanwhile, other definition of electrification ratio is the ratio of people who have access to electricity toward total number of people in one country [7]. Furthermore, it can be concluded that electrification ratio in Indonesia is the percentage of Indonesian people who can access electricity, by calculated ratio between the numbers Indonesian people who can access electricity to the sum of all Indonesian people.
From the above definition, the higher electrification ratio, means the more people who can access electricity. The availability of access to electricity for all people is the development tools in one country. In addition to contributing to improving human living conditions, electricity also serves to encourage economic growth.
2.2.3 Decentralization
In general, decentralization is the delegation of authority in making decisions and policy to the managers or people who are at lower levels within an organizational structure. Implementation of a decentralized system aimed to improve and enhance the effectiveness and productivity of an organization. In terms of government, decentralization is the transfer of accountability on planning, management and improvement, or allocation of resources from central government and various institutions that exist at the various units of government agencies and lower units [8]. Decentralization is expected to have a positive impact on the development of lagging regions within a country.
In terms of electricity, electricity decentralization is considered necessary to achieve energy independence of the region. The provision of electricity through the priority use of local energy sources will be more economical because it does not require transportation and / or distribution, and at the same
12
time will maintain energy security areas because it will ensure the sustainability of economic development in the area [9].
From a technical standpoint, decentralization electricity minimizes distribution losses due to different distances between load centers and power plant location. Also expected to increase the capacity in regional electricity planning, including the potential of natural resources which can be used as energy resources for electricity supply.
In terms of economics, decentralization electricity will facilitate synergies between electricity supply and demand needs in the area. Decentralized electrification can also lead to improve the regional economy and encourage the emergence of new economic centers in the countryside, because of the availability of access to electricity from the state and community-based small scale electricity generation.
2.3 Characteristic of My Study
This study distinguishes two types of problems, the first problems are inside PLN’s management, and the second is Indonesia's electricity problems related to the low electrification ratio. Discussion and provision of solutions is limited to problem related to low electrification ratio, not on problems inside PLN’s management as was done in previous study. I need to discuss and formulate solution for electrification ratio because this number indicates the percentage of Indonesia's population who can access electricity. The higher electrification ratio, means the more people who can access electricity, and vice versa. Equitable access to electricity needs to be improved because it can improve their productivity to reduce poverty.
Providing solutions to the problem of low electrification ratio includes stakeholders, regulation and financing sectors with decentralized electricity system. Decentralized electricity system is expected to overcome inability of poor people who can’t access electricity. Actually the cost of obtaining electricity connection may also impede the expansion of electricity access, especially in poorer areas. PLN normally charges new residential customers and installation fee, a connection charge and an advance deposit [10].
13
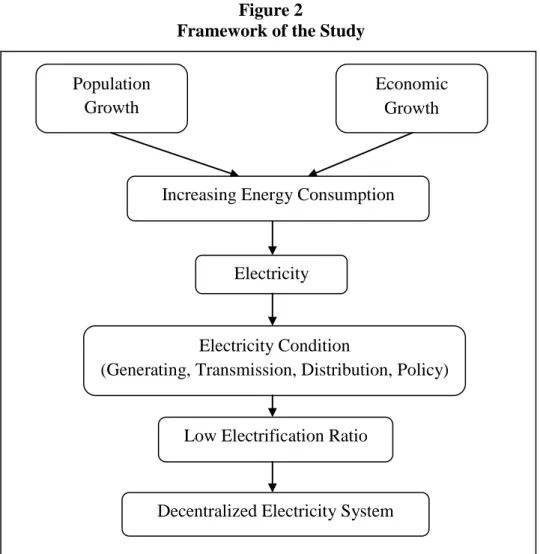
Figure 2 shows framework of the study, the steps from background to conclusions.
Figure 2
Framework of the Study
Every human being needs energy to survive their live, including warming the body, running the machinery industry, illuminates the highway, and various other energy functions. Along with population and economic growth, consumption of energy increases. Both forms of energy, namely renewable and non-renewable energy can be converted into electricity. Electricity in sufficient quantities is one of important factor in developing the economy and improving people's welfare. With the increasing in electricity consumption, I will describe the condition of electricity in Indonesia, such as condition of generating, transmission, distribution and policy regarding electricity. After knowing the electricity sector in Indonesia, then I will formulate the main problem facing Indonesia regarding electricity which is related to low
Population Growth
Economic Growth
Increasing Energy Consumption
Electricity
Electricity Condition
(Generating, Transmission, Distribution, Policy)
Low Electrification Ratio
14
electrification ratio. I focused on this problem because Indonesia has a low electrification ratio, only 66 % Indonesian people who can access to electricity until 2010. This condition inhibits socio and economic development in Indonesia.
After analyzing the problem, I will try to seek a solution to provide electricity and enhance electrification ratio for Indonesian people.
References
1. Nugroho, H., Thamrin, S and Hardjakoesoema, G. 2005. Electricity Industry in Indonesia after the Implementation of Electricity Law Number 20/2002: Proposed Agendas to Support Implementation of the Law. 28th
Annual International Association for Energy Economic Conference. 2005.
Taipei.
2. Susanta, G and Agustoni, S. 2007. Kiat Hemat Bayar Listrik (Electricity
Saving Tips), p.5. Jakarta: Niaga Swadaya.
3. http://www.eia.gov/kids/energy.cfm?page=electricity_home-basics
4. Beggs, Clive. 2009. Energy, Management, Supply and Conservation, pp.33 and 34. Great Britain: Elsevier.
5. World Bank. 2004. World Development Indicators, p.151. The International Bank United States of America.
6. http://www.energycommunity.org/default.asp?action=9&read=1232&fid= 68
7. Marsudi, Djiteng. 2005. Pembangkit Energy Listrik (Electric Power
Generation), p.190. Jakarta: Erlangga.
8. Winarno, Budi. 2008. Globalisasi: Peluang atau Ancaman bagi Indonesia
(Globalization: Opportunity or Threat for Indonesia), p.37. Jakarta:
Erlangga.
9. Boedoyo, Sidik and Sugiyono, Agus. 2010. Tech Monitor: Decentralized
Power Generation in Indonesia Current Issues and Prospect, 27.3
(2010):31.
10. World Bank. 2005. Electricity for All, p.11. The International Bank United States of America.
15 CHAPTER 3 DATA AND ANALYSIS
In this chapter I intend to explain energy condition in Indonesia, especially electricity situation, which contains power generation, transmission and distribution system. I also describe about Law regarding electricity and electrification ratio. Then, after knowing electricity condition, I will distinguish and analyze two kinds of electricity problems facing Indonesia.
3.1 Energy Condition in Indonesia
Indonesia is the world’s fourth most-populous country and is spread over a large archipelago. It is by far the largest economy in ASEAN and accounts for 37 % of the region’s primary energy consumption and 53 % of its production in 2007. Indonesia’s primary energy demand increased more than three-fold between 1980 and 2007, from 57 to 191 million tonnes of oil equivalent (Mtoe). With the exception of oil, Indonesia is self-sufficient in terms of energy supplies. The country became a net oil importer in 2004 and suspended its membership of the Organization of the Petroleum Exporting Countries (OPEC) in 2008.
Preview current energy condition in Indonesia and coherence with electricity sector can be seen under a portrait of the situation regarding the potentiality of existing energy sources and energy production-consumption pattern.
3.1.1 Energy Resources Status 3.1.1.1 Fossil Fuel
Fossil fuel consists of oil, coal and natural gas. Indonesia’s oil reserve (proven and potential) declined by about 16.75% from 9.61 billion barrel in 2000 to 8.00 billion barrel in 2009.The proven reserve itself was 4.30 billion barrel in 2009 and has decline by 16.01% since 2000 [1]. There are still some possibilities to increase the reserve value, because only 16 out of 60 hydrocarbon basins have been producing oil while 7 basins have been explored but not yet in production state. These basins are highly attractive to be further developed due to current global crude oil prices [2].
16 Table 2
Oil Reserves (Billion Barrels) Year Proven Potential Total
2000 5.12 4.49 9.61 2001 5.10 4.65 9.75 2002 4.72 5.03 9.75 2003 4.73 4.40 9.13 2004 4.30 4.31 8.61 2005 4.19 4.44 8.63 2006 4.37 4.56 8.93 2007 3.99 4.41 8.40 2008 3.75 4.47 8.22 2009 4.30 3.70 8.00
Source: Handbook of Energy and Economic Statistics of Indonesia, 2010:46
In the sense of natural gas, Indonesia’s Natural gas reserve (proven and potential) was 159.63 TSCF in 2009 and has decreased by about 6.27% since 2000, whereas proven reserve has increased by about 13.28% from 94.75 TSCF in 2000 to 107.34 TSCF in 2009.
Table 3
Natural Gas Reserves (TSCF) Year Proven Potential Total
2000 94.75 75.56 170.31 2001 92.10 76.05 168.15 2002 90.30 86.29 176.59 2003 91.17 86.96 178.13 2004 97.81 90.53 188.80 2005 97.26 88.54 185.80 2006 94 93.10 187.10 2007 106 59 165 2008 112.50 57.60 170.10 2009 107.34 52.29 159.63
Source: Handbook of Energy and Economic Statistics of Indonesia, 2010:54
Another kind of fossil fuel is coal, which is a potential source if developed seriously to support the development with due regard to the impact of environmental pollution arising from mining and the rest of the results of its utilization. Indonesia's 2008 total coal resources are estimated at 104.76 billion tons, located in 12 coal seams over 6 provinces. Major coal deposits in Indonesia are located in Sumatra (50.1%) and Kalimantan (49.6 %). The remaining is distributed in Java, Sulawesi, Maluku and Papua [2].
17 3.1.1.2 Renewable Resources
Indonesia has the huge potential of renewable resources. This situation can be seen in the table 4:
Table 4
Renewable Energy Potential in Indonesia (2007) Renewable Energy Potential Installed Capacity
Hydropower 75.67 GW 4.2 GW
Geothermal 27 GW 1.042 GW
Biomass 49.81 GW 0 GW
Source: Ministry of Energy and Mineral Resources
Total potential of hydropower in Indonesia is quite large. With the size of the potential for highly varied as well as its location spread in almost all provinces should be able to put the power of water as high energy utilization. Nationally, the potential for electricity generation using hydropower is large enough, which is around 75.67 GW. This potential, although quite large, but its utilization is still relatively small, only about 4.2 GW or 5.5 %.
Around 40% of the world's geothermal resources are located in Indonesia. The active volcanic belt in Indonesia, measuring 7,000 km in length and 50-200 km in width distributes geothermal energy resources along the volcanic lines of Sumatra, Java, Bali, West Nusa Tenggara (NTB), Northern Sulawesi and Maluku. Most of the geothermal energy resources are located at the base or old caldera area of volcanoes. Indonesia's total geothermal energy potential is equivalent to 27 GW of electricity. Of this total, 11,135 MW is confirmed as probable reserve, 1,050 MW as possible reserve and 2,288 MW as proven reserve. The remaining 13,128 MW are still speculative and hypothetical resources [2].
In Indonesia, biomass is still widely used, especially in rural areas. Across Indonesia, an estimated potential of all biomass energy amounted to 49.81 GW when all are used to generate electricity, but until now the use of biomass for electricity has not been too visible.
18 3.1.2 Energy Production
Energy production is the total gross primary energy produced or extracted from underground [1]. Indonesia Energy production includes hydro, geothermal, biomass, coal, natural gas, and crude oil like shown in table 5:
Table 5
Energy Production (Thousand BOE) Year Hydro Geothermal Biomass Coal Natural
Gas Crude Oil Total 2000 25,111 9,179 269,054 323,569 521,088 517,489 1,666,490 2001 29,380 11,796 268,724 388,670 504,164 489,306 1,692,040 2002 29,844 12,200 269,765 433,982 546,321 456,026 1,748,138 2003 30,696 23,372 271,337 479,968 566,682 419,255 1,791,310 2004 32,401 24,858 270,974 555,870 544,212 400,554 1,828,878 2005 35,588 23,744 270,167 639,259 536,167 386,483 1,891,408 2006 24,257 11,183 276,329 813,798 530,556 367,049 2,023,172 2007 28,451 11,422 274,433 913,121 435,238 348,348 2,011,023 2008 29,060 13,424 277,962 961,800 444,238 357,501 2,083,985 2009 28,688 14,973 279,251 1,075,960 459,444 346,469 2,204,786
Source: Energy Balance Table from 2000-2009, Ministry of Energy and Mineral Resources
Since 2000 until 2003, natural gas has composed the major portion of energy production, where the share of natural gas in total energy production made up 31% in 2000 and 32% in 2003. However from 2004 until 2009, coal has taken the place of natural gas and dominated energy production. Share of coal in total energy production made up 30% in 2004 and 49% in 2009.
Almost all energy sources have increased, except for natural gas and crude oil. Hydro has increased by about 14.25% from 25,111 thousand BOE in 2000 to 28,688 thousand BOE in 2009. Geothermal has increased by about 63% from 9,179 thousand BOE in 2000 to 14,973 thousand BOE in 2009. Biomass has increased by about 3.8% from 269,054 thousand BOE in 2000 to 279,251 thousand BOE in 2009. Then coal has increased by about 233% from 323,569 thousand BOE in 2000 to 1,075,960 thousand BOE in 2009. While natural gas has declined by about 12% from 521,088 thousand BOE in 2000 to 459,444 thousand BOE in 2009 as well as crude oil has declined by about 33% from 517,489 thousand BOE in 2000 to 346,469 thousand BOE.
19 3.1.3. Energy Consumption
Energy consumption is amount of energy consumed in a process or system, or by an organization or society [3]. Along with economic and population growth, energy consumption will also increase. Table 6 shows the final energy consumption by type, divided into 8 categories: biomass, coal, natural gas, fuel, other petroleum products, briquette, LPG, and electricity.
Table 6
Final Energy Consumption by Type (Thousand BOE)
Year Biomass Coal
Natural
Gas Fuel
Other Petroleum
Product Briquette LPG Electricity Total
2000 269,042 36,060 87,214 315,272 13,435 85 8,261 48,555 779,924 2001 268,953 37,021 82,235 328,203 25,712 78 8,280 51,841 802,323 2002 270,207 38,698 80,885 325,202 22,688 83 8,744 53,418 799,925 2003 271,974 68,264 90,277 321,384 23,533 77 8,766 55,473 839,748 2004 271,765 55,344 85,459 354,317 37,716 80 9,187 61,393 875,261 2005 270,043 65,744 86,634 338,375 29,614 94 8,453 65,644 864,601 2006 276,271 89,043 83,221 311,913 41,126 94 9,414 69,071 880,153 2007 275,126 121,904 80,178 314,248 39,873 89 10,925 74,376 916,719 2008 277,874 74,939 85,311 312,190 16,658 155 15,718 79,138 861,983 2009 279,145 82,587 118,452 333,962 25,922 219 25,259 82,567 948,113
Source: Handbook of Energy and Economic Statistics of Indonesia, 2010:20
From this table, we know that the biggest share of energy consumption is fuel. The share was 40.6% of the total energy consumption in 2000 and 35.2% in 2009. The next type of energy also widely used is biomass, about 34.6% of the total energy consumption in 2000 and 29.4% in 2009. Biomass is widely used by the villagers, they use wood, charcoal and other biomass energy sources for daily purposes. In terms of electricity, consumption rose 70% from 48,555 thousand BOE in 2000 to 82,567 thousand BOE in 2009, with an average growth of 6.26% per year. Share of electricity in energy consumption is equal to 6.2 % in 2000 and 8.7% in 2009.
3.2 Electricity Situation in Indonesia 3.2.1 Overview of the Industry
In the 19th century, several private Dutch companies built the first electric power plants in Indonesia. During this time, electricity production capacity
20
was still low, around 157.5 MW. These private electric power plants were later taken over and nationalized by Indonesian government.
In the later period, the state continued to play a dominant role in industry: as the regulator as well as the player in industry through the state-owned company, PLN, which was granted the authority to run the electricity business (PKUK), i.e., to produce and distribute electricity (Law number 15 Year 1985). The law also allows private sector and cooperatives to take part in the power sector by operating power plants and captive power generations as long as their interests are not in conflict with that of the state. In other words, they have to deal with PLN if they want to enter the business. However, the role of the private sector in the power industry was rather insignificant until the early 1990s when the government invited private investors to participate in the power sector by operating large scale power plants and sell the electricity to PLN or to other parties (Presidential Decree number 37, 1992).
In anticipation for more severe competition in the later period, PLN went through internal consolidation. In 1996, PLN established three sisters companies which control PLN generation and distribution of East Java, West Java and Bali, and controls the installation, distribution facilities and interconnection system. In 1997 Indonesia was hit by a severe financial crisis which dramatically changed the outlook of the country’s electricity sector industry. Before the crisis, it was predicted that the industry would run a surplus during the first decade of the 21st century when all of the 27 Independent Power Producer (IPP) projects were on line. Because of the crisis most of the 27 IPPs were either postponed or cancelled and as a result the outlook changed from power surplus to power deficit during the period under consideration.
3.2.2 Power Generation:
The generation of electric power shall be the activity to produce electric power [4].
3.2.2.1 Electric Power Plants (according to PLN and private)
As the representative of the government in charge of the electricity (PKUK), PLN is obliged to supply electricity in order to fulfill the over
21
increasing public demand every year. The increase in electricity needs is due to improved society’s wealth level that is also followed by the industry’s development in Indonesia, in line with the limits of PLN’s ability to meet the increasing demand for electricity. Hence PLN not only produce electricity through PLN own power plants but also through power plant’s rental as well as purchasing electricity from private institutions.
The own electricity production (included rented) throughout 2008 was 118,047 GWh, up 6.1 % over the previous year. Of the electricity production, 36 % was produced by PT PLN (Persero) Holding, and 64 % came from Subsidiary Companies, i.e. PT Indonesia Power, PT PJB, PT PLN Batam and PT PLN Tarakan. Of this electricity production 20,189.65 GWh (17%) was produced by natural gas, 41,311.31 GWh (35%) was produced by coal fired, 42,415.17 GWh (36%) was produced by oil, 10,739.97 GWh (9%) was produced by hydro and 3,390.66 GWh (3%) came from geothermal. The share of natural gas, oil and hydropower used for electricity production increased over the previous year, while coal decreased and geothermal was constant respectively.
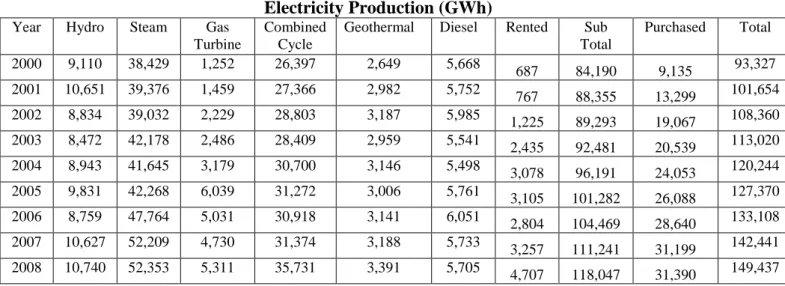
The total production (including purchase from utilities outside PLN) during 2008 was 149,437 GWh, an increase of 6,996 GWh or 4.9% over the previous year. Of this electricity production, the energy purchased from other utilities outside PLN amounted 31,390 GWh (21%). This increased by 190 GWh or 0.6 % over the year 2008. Of the total electricity purchased the greater part were 8,855 GWh (28.2%) from PT Paiton Energy Co, and 8,685 GWh (27.7%) from PT Jawa Power in East Java. The detailed data of electricity production can be consulted in table 7:
22 Table 7
Electricity Production (GWh) Year Hydro Steam Gas
Turbine
Combined Cycle
Geothermal Diesel Rented Sub Total Purchased Total 2000 9,110 38,429 1,252 26,397 2,649 5,668 687 84,190 9,135 93,327 2001 10,651 39,376 1,459 27,366 2,982 5,752 767 88,355 13,299 101,654 2002 8,834 39,032 2,229 28,803 3,187 5,985 1,225 89,293 19,067 108,360 2003 8,472 42,178 2,486 28,409 2,959 5,541 2,435 92,481 20,539 113,020 2004 8,943 41,645 3,179 30,700 3,146 5,498 3,078 96,191 24,053 120,244 2005 9,831 42,268 6,039 31,272 3,006 5,761 3,105 101,282 26,088 127,370 2006 8,759 47,764 5,031 30,918 3,141 6,051 2,804 104,469 28,640 133,108 2007 10,627 52,209 4,730 31,374 3,188 5,733 3,257 111,241 31,199 142,441 2008 10,740 52,353 5,311 35,731 3,391 5,705 4,707 118,047 31,390 149,437 Source: PLN Statistics 2008, 2009:56 3.2.2.2 Installed Capacity
Besides energy production, which can be used as indicators of electricity performance, is installed capacity. Installed capacity is the capacity of one generating unit as written on the generator name plate or on the prime mover, which of both is the smaller [5].
Table 8 shows the largest share of installed capacity in 2000 was combined cycle power plant that is equal to 33%, whereas in 2008, the largest share is steam fired power plant, which represents 34.24% of the total installed capacity. In 2000, the smallest share of total installed capacity is geothermal, amounting to 1.73%, while in 2008, the smallest share is wind power plant, 0.001% of total installed capacity. The installed capacity from 2000 until 2008 is as follows:
Table 8
Installed Capacity (MW)
Year Hydro Steam Gas Turbine
Combined Cycle
Geothermal Diesel Diesel Gas Wind Total 2000 3,015 6,770 1,203 6,863 360 2,550 - - 20,762 2001 3,106 6,900 1,224 6,863 380 2,585 - - 21,059 2002 3,155 6,900 1,224 6,863 380 2,589 - - 21,112 2003 3,168 6,900 1,224 6,863 380 2,670 - - 21,206 2004 3,199 6,900 1,482 6,561 395 2,911 12 - 21,470 2005 3,221 6,900 2,724 6,281 395 2,994 12 - 22,515 2006 3,529 8,220 2,727 7,021 395 2,942 12 - 24,846 2007 3,502 8,220 2,784 7,021 415 2,956 12 0.10 25,223 2008 3,504 8,764 2,497 7,371 415 3,021 22 0.26 25,594 Source: PLN Statistics 2008, 2009:55
23
Total installed capacity has increased by 23.27% from 20,762 MW in 2000 to 25,594 MW in 2008. This was also followed by the growth of installed capacity in each power plant. Hydro power plant has increased by 16.21% from 3,015 MW in 2000 to 3,504 MW in 2008. Fired steam power plant has increased by 29.45% from 6,770 MW in 2000 to 8,764 MW in 2008. Gas turbine has increased by 107.5% from 1,203 MW in 2000 to 2,497 in 2008. This increasing also followed by combined cycle, geothermal and diesel power plant.
3.2.2.3 Electricity Infrastructure
Indonesia consists of five large islands, Java as the most densely island and the center of economic and government activities. Under these conditions, it's no wonder that the Java’s installed capacity in the largest from other islands. Figure 3 shows inequality of electricity services. 74% of installed capacity located on Java Island, as well as the transmission network. While 16% of installed capacity located in Sumatera Island, lengths of transmission system also support access to electricity for the citizen. By contrast, in other island like Kalimantan, Sulawesi, Nusa Tenggara and Papua not all people can access to electricity because of electricity services can’t reach those areas.
Figure 3
Overview of Power Sector Infrastructure
24 3.2.3 Electricity Transmission System
The transmission is the process whereby electricity is transported through a transmission grid over long distance around a region or an island [4]. In Indonesia there are several types of transmission voltage, there are low voltage with 25-30 kV, medium voltage with 70 kV, high voltage with 150 kV, extra high voltage with 275 and 500 kV.
3.2.3.1 Transmission Service
The quality of electricity service is also determined by the length of transmission lines. The longer transmission lines mean the wider range of electricity service that can be enjoyed by consumers. The length of transmission line is shown in table 9. At the end of 2008, the total length of transmission lines was 34,184 kmc, has increased by 3 % over the previous year, of which about 5,092 kmc was 500 kV, 782 kmc was 275 kV, 23,679 kmc was 150 kV, 4,619 kmc was 70 kV and 12 kmc was 25 and 30 kV transmission levels.
Table 9
Length of Transmission Lines (kilometer circuit-kmc)
Year Voltage Total
25-30 kV 70 kV 150 kV 275 kV 500 kV 2000 12 4,933 17,102 - 2,774 24,822 2001 12 4,945 18,183 - 2,849 25,989 2002 12 4,945 19,406 - 3,207 27,570 2003 12 5,035 19,519 - 3,608 28,173 2004 260 4,726 22,229 - 3,578 30,794 2005 260 4,726 22,381 - 3,578 30,945 2006 12 4,619 23,238 - 5,048 32,917 2007 12 4,619 22,703 781 5,048 33,163 2008 12 4,619 23,679 782 5,092 34,184 Source: PLN Statistics 2008, 2009:57
Total length of transmission lines increased significantly in 2004, up 9.30 % from 2003. The increasing of transmission lines were expected to improve the quality and the spread of PLN services.
25 3.2.3.2 Transmission Loss Rate
Loss is the energy loss due to technical and non technical issues. Technical problems are usually caused by the quality of electrical conductivity, the better quality of electrical conductivity the lower losses will occur. While generally non-technical losses are caused by broken installations at home (due to theft) as well as using inappropriate equipment. To reduce energy losses PLN must repair the electricity transmission, reduce electricity theft and repair customer’s meter readings. PLN's efforts to reduce energy losses resulted in the decreasing percentage of energy losses as seen in table 10, both in terms of transmission and distribution.
Table 10 shows energy loss in transmission system was 3,127 GWh in 2008, an increase of 35 % from 2000. This increase also occurred in the energy loss in distribution system in 2008, up to 46% from 2000. But in 2004, there happened significant reduction in energy losses, about 29% from 18,402 GWh in 2003 to 13,132 GWh in 2004. This was also supported by the addition of transmission lines (shows in table 9) in 2004, which rose 9.30 % from 2003 to 2004.
Table 10
Energy Losses (GWh)
Year Transmission Distribution Total
2000 2,308 8,175 10,483 2001 2,337 10,925 13,261 2002 2,707 14,522 17,228 2003 2,686 15,716 18,402 2004 2,711 10,420 13,132 2005 2,794 11,443 14,237 2006 2,905 11,831 14,736 2007 3,081 12,158 15,239 2008 3,127 11,967 15,094 Source: PLN Statistics 2008, 2009:54
3.2.4 Electricity Distribution System
Distribution system is a part of electricity power system. Distribution system is useful to distribute electricity from bulk power source to the consumers [4]. Electric power generated by large power stations with a voltage of 25 kV to 30 kV is increased by a transformer substation to 70 kV, 150 kV, 275 kV or 500 kV then channeled through a transmission line.
26
From the transmission line, voltage is reduced again to 20 kV by step-down transformer voltage at the distribution substations, with the voltage distribution system electric power carried by the primary distribution channel. From this primary distribution channel substations, distributions substations take down the voltage with the voltage transformer to be low voltage distribution system, which is 220/380 Volts. Then distributed to secondary distribution channels to consumers.
3.2.4.1 Electricity Tariffs
Electricity tariffs in Indonesia is a government regulated one. The tariff is structured into several customer categories to enable cross subsidies among customers. The tariff is applied uniformly across the country. The total amount paid by each customer for electricity has two components, a fixed demand or capacity charged, based on the energy delivery capacity in Volt Ampere (VA) of the customer’s connection to the power grid and a variable energy charge, based on the number of kilowatt-hours of electricity used, as registered on the customer’s meter.
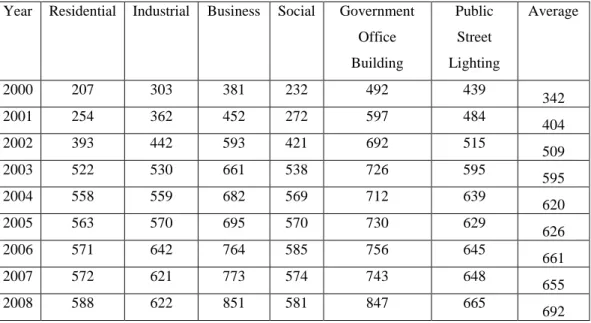
Table 11 shows electricity tariffs from 2000 to 2008 based on six sectors: residential, industrial, business, social, government office building and public street lighting.
Table 11
Electricity Tariffs (Rp/kWh) Year Residential Industrial Business Social Government
Office Building Public Street Lighting Average 2000 207 303 381 232 492 439 342 2001 254 362 452 272 597 484 404 2002 393 442 593 421 692 515 509 2003 522 530 661 538 726 595 595 2004 558 559 682 569 712 639 620 2005 563 570 695 570 730 629 626 2006 571 642 764 585 756 645 661 2007 572 621 773 574 743 648 655 2008 588 622 851 581 847 665 692 Source: PLN Statistics 2008, 2009:52
27
From the above table, can be seen there is increasing electricity tariffs in six sectors every year. The average tariff has increased by 102 % from Rp.342/kWh in 2000 to Rp.692/kWh in 2008, among which residential sector has increased by 184% from Rp.207/kWh in 2000 to Rp.588/kWh in 2008, industrial sector has increased by 105%, business by 123%, social by 150%, government office building by 72% and public street lighting has increased by 52% from Rp.439/kWh in 2000 to Rp.665/kWh in 2008.
3.3 Indonesian Law regarding Electricity
3.3.1 Law of the Republic of Indonesia Number 15 year 1985
This law enacted on 30 December 1985, is composed of 12 chapters and 26 articles. Broadly, this law describes the general provisions, basis and objective of electric energy development, energy sources for electricity, general electric energy planning, electric enterprise, relationship between PLN and private companies for public use and the public in electricity supply operations, supply and utilization of electricity, management and supervision, criminal act clause, investigation, transition clause and the last one is concluding clause.
But along with the development of the time, Law No. 15 Year 1985 was not able to follow the rate of global investment-based competition. Law No. 15 of 1985 limiting the commercialization of motion of electricity commodity, is based on the understanding that electricity including requirements relating to lives of many people. According to this Law, PLN plays a role as a holder of the Electricity Business Authority (PKUK), business people, and once held the regulatory function.
3.3.2 Law of the Republic of Indonesia Number 20 year 2002
Legislation reform in the field of electricity has already done by the government through issuance of Law No. 20 Year 2002. However, this Law was repealed by the Constitutional Court (MK) in 2004 for reasons contrary to Article 33 of the 1945 Constitution, which states that the industry which controls the lives of many people must be controlled by the State, whereas Law No. 20 of 2002 allows private parties to engage not only in the generation sector, but also transmission and distribution sector. Based on Indonesian law,
28
the annulment automatically reverted authority to the previous law, which was Law Number 15Year 1985.
3.3.3 Law of the Republic of Indonesia Number 30 year 2009
After the cancellation of Law No 20 year 2002, then Law No. 15 year 1985 restored to life in Indonesia electricity sector. But the government re-arranged new electricity Law. A new Law was compiled as Law No. 30 Year 2009, which consists of 17 chapters and 58 articles and was approved on 23 September 2009 on the final plenary session of Parliament the service period 2004-2009, after lengthy discussion since 2002. The purpose of the Law is designed as follows:
1. Restoring the financial viability of electricity sector, particularly through the adjustment of tariffs, reduction of production cost, reducing subsidies and giving subsidy for the target only.
2. Introducing competition in the electricity sector, in the beginning by dividing electricity factor into different components.
3. Improving transparency to reduce business uncertainty, among others, by separating the various roles of government (owner, policy makers, and regulators) from PLN mission (social, commercial).
4. Realizing an efficient private sector participation, to meet the needs of investment where government funding is limited.
3.3.4 Comparison of Electricity Law
To know the fundamental difference between Law No. 15 Year 1985 and Law No. 30 year 2009, two electricity laws will be compared as the follows:
29 Table 12
Comparison of the Electricity Laws
Issues Law No.15 Year 1985 Law No.30 Year 2009
Basic Philosophy Recognize the importance of electricity for economic development and the livelihood as well as the equal right and access to electricity for all people. However this law does not explicitly state the importance of providing electricity by the most efficient means through competition and transparency. (Article 2 and 3)
Recognize the importance of electricity for development and equal access to electricity as in Law No. 15 Year 1985. The Law also recognizes the importance of efficiency in providing electricity through competition and transparency in a healthy business environment by providing a level playing field to all business players, and an opportunity to participate in the electricity provision business. Through price policy, the Law also intends to provide electricity access to people living in rural and remote areas. The Law also obligates the Central and Regional government to provide funding for increasing access to rural and remote
communities. (Article 2) Institutional Set-Up Central Government Role:
The role of Central Government is dominant, in term of regulating,
facilitating, operating as well as supervising and controlling. (Article 5,16,17 and 18)
Central Government Role:
The central Government is in charge of policy making and facilitating. The regulator role will be assigned to an independent body especially for competitive regions. (Article 3)
PLN Role and Mission:
The status as Electricity Authorization Holder (PKUK) bestowed PLN with the full authority in electricity provision. (Article 7)
Under Law No.15 year 1985 the role of covering electricity provision business from generation, transmission and distribution is very dominant.(Article 6)
PLN Role and Mission:
Less dominant, as this laws does not acknowledge the role of PLN as Electricity Authorized Holder (PKUK). PLN is considered as one of the business players that provide electricity to customers. (Article 4)
Unbundling the business of electricity provision into 4 aspects, and distribute the license to do these to various Institutions. (Article 10)
Regional government:
Law No 15 Year 1985 does not specifically govern the position, authorities and obligation of regional government. Regional governments participation on planning, granting license and budgeting is not explicitly recognized.
Regional government:
This Law explicitly recognizes the regional government role, obligation to allocate budget specifically for social electricity, authority to grants permits, and setting up price for non-competitive regions. (Article 5)
Social Electricity:
Law No.15 Year 1985 implied that PLN as PKUK holds the mandate for electricity provision in the country, which can be interpreted that PLN hold two missions, commercial and social. (Article 7)
Social Electricity:
Under this Law, the Central and Regional government are obliged to set aside budget for social-mission electricity provision, which include electricity for (Article 4):
30
Source: Law No.15 year 1985 and Law No.30 Year 2009
Low-income communities Under-development region Remote and Borders areas Rural areas
Private Sector/ Community Role and License
The default of electricity business provision bestowed to PLN as the state-owned enterprise as the authorization holder in electricity provision. (Article 7)
The PLN status as PKUK is no longer recognized in the Law and it is treated equally as other business players such as private sector and community on electricity provision. (Article 4)
Classification of the Electricity Provision Business
The electricity provision is divided into three activities (Article 6): Generating
Transmission Distribution
The electricity provision is separated into 4 activities (Article 10): Generating
Transmission Distribution Sales Competition Issues There is no competition principle regulated in Law No 15 Year 1985, instead
it puts most of the authority to PLN as the authorization holder.
The supply of electrical power can be conducted in an integrated way. (Article 10)
The supply of electrical power can be conducted by state-owned company, regional government-owned companies, private business entities, cooperatives, and self-supporting communities. (Article 11)
Subsidy This issue is implicitly stated under Government Regulation relating to Central and Regional government obligation to allocate social electricity funds to specific targeted beneficiaries.
This law focuses subsidy only on social mission. Government and regional government shall provide funds for: group of low income people; development of facilities for the supply of electrical power in least development regions; development of electrical power in remote and borders areas; and development of rural electricity. (Article 4)
Tariff The law governs the tariff setting for PLN. The tariff is regulated by the President, based on proposition from the Minister. As further implementation of Law No.15 Year 1985, under the Presidential decree that regulates PLN Tariff, the GOI adopted the concept of universal tariffs across the region. (Article 16)
This Law encourages the application of regional tariffs to take into account the disparity of cost of supply across the region as well as fair and reasonable competition. (Article 34)
31
From comparison of the Electricity Laws above, it can be concluded that under the current electricity system, the government provides the opportunity for private parties, enterprises, cooperatives and regional government to engage in the electricity supply business. With the variety of electricity providers hence allow for regional tariffs in each region.
3.4 Electrification Ratio
A large number of Indonesians presently do not have access to reliable and affordable electricity services. Until 2010 electrification ratio is still at 66% [1]. It is estimated that over 75 million people in Indonesia are unconnected to electricity and must rely instead on alternative energy sources. The large number of unconnected is a regressive problem, since over 80 % of them are in rural areas where 75% live in poor condition. Furthermore, with over half of those without access to electricity living outside the economic centers of Java-Bali, many stand to miss out on the benefits as well as fail to contribute to the current economic revival in Indonesia.
Table 13
Electrification Ratio (%)
Year Java Outside Java Total Indonesia
2000 55.74 45.88 52.02 2001 56.22 45.54 56.12 2002 56.67 45.88 52.51 2003 57.24 46.37 53.03 2004 57.38 47.01 53.38 2005 57.65 48.27 54.06 2006 63.48 51.49 58.78 2007 65.97 52.73 60.78 2008 67.75 54.19 62.42
Source: PLN Statistics from 2000-2008
Generally, electrification ratio outside Java is lower than Java Island. One of the reasons is the inaccessibility to the distribution areas and affordability of the Indonesian people. Electrification ratio in Java rose 22% from 55.74% in 2000 to 67.75% in 2008, as well as on outside Java rose 18% from 45.88% in 2000 to 54.19% in 2008. While nationally, electrification ratio rose 20% from 52.02% in 2000 to 62.42% in 2008.
32
Seeing above situation Indonesian Government has recognized the importance of increasing access to electricity in order to improve people’s lives and overcome poverty. They also recognize that regional competitiveness, which is critical for economic growth, has also been compromised, since Indonesia legs behind neighboring countries in electrification. In response, the Government has established an ambitious target of expanding electricity access to 90 % of the population by the year 2020. To achieve that target, it takes an average electric generating 3500 megawatts (MW) and transmission along 3,000 kilometer circuit (kmc) with 8,000 MVA, and 20,000 kmc medium voltage distribution networks and low voltage 30,000 kmc with 6,000 MVA.
3.5 Electricity Problems and Analyzing
Based on electricity situation in Indonesia which is handled by PLN above, can be defined two types of problems faced by Indonesia, problems inside PLN management and Indonesia electricity problem which is related to low electrification ratio.
3.5.1 Problems inside PLN Management
There are 3 fundamental problems which are related to each other in the management of PLN as a provider of electricity in Indonesia. These problems are:
Figure 4
Problems inside PLN’s Management
3.5.1.1 Capital Investment
The first problem that hampers the performance of PLN in providing electricity for the Indonesian people are the lack of capital investment. In terms of PLN, lack of capital investment is caused by the high cost of
Capital Investment
Energy Policy Tariff