Evaluation of Automotive Control-Display System
by means of Mental Workload
Atsuo MURATA and Makoto MORIWAKA
Dept. of Intelligent Mechanical Systems, Division of Industrial Innovation Sciences,
Graduate School of Natural Science and Technology, Okayama University
3-1-1, Tsushimanaka, Okayama-shi, Japan
E-mail: [email protected]
Abstract ― The effects of age, task difficulty on
performance and mental workload were discussed in order to provide design guideline of automobile display that is friendly to older adults from the viewpoints of mental attention, speed and accuracy. A dual-task experiment was conducted in which the primary task was first order tracking. The secondary tasks included selection of function (easy condition), and control of an air conditioner, the operation of a radio, and the operation of a CD/MD (difficult condition), by means of a steering wheel mounted switch. The display was arranged in front of a participant. Age affected the performance measures and heart rate variability (HRV). As for the young adults, the task completion time did not differ significantly among easy and difficult (one-, two-, and three-layered) conditions. The performance of older adults was affected by task difficulty. The HRV measures such as CV (coefficient of variance) and RRV8-3 during the task showed different tendency between young and older adults. As for the young group, the HRV measures did not differ significantly between the four task levels (easy, one-, two-, and three-layered). This confirmed that the task difficulty did not induce different mental workload to young adults. On the other hand, as for the older adults, the HRV measures tended to increase with the increase of task difficulty. Although it appears that mental workload was lessened with the increase of task difficulty, such an interpretation was contradictory to the results on performance. This phenomenon was interpreted that the difficult task condition was overloaded for older adults, and was beyond the limit
of mental effort. Based on the results, it could be
concluded that the difficult task condition is not proper for older adults.
1. Introduction
With the growth of intelligent transportation systems (ITS), such as car navigation systems or hands-free cellular phones, driving is becoming more and more
complex[1]. As much of the information provided
contains texts and images, drivers are apt to become distracted and inattentive. Driving a car places a characteristically heavy workload on visual perception,
cognitive information processing, and manual
responses[2]. Drivers often simultaneously perform two
or more tasks; for example, they adjust the volume of a
radio or CD player and control the air conditioner to adjust the temperature while driving. Such sharing of attention may lead to dangerous situations.
Previous research in the area of displays and controls for secondary devices in automobiles is notable for the lack of reported work on compatibility. Most research discusses design of the display or the control, but not the way in which they are to operate together, which includes effects of compatibility.
Lambel, Kauranen, Laakso, and Summala and Lambel, Laakso, and Summala discussed the relationship between display location and performance in car driving
situations[3,4]. Lambel, Laakso, and Summala reported
that the driver's ability to detect the approach of a decelerating car ahead was affected by the display
location[4]. Waller and Green[5]examined switch type and
its location, and pointed out a lack of consensus as to where the control should be located. Proper control (switch) location must be one of the important factors to assure fast responses of drivers.
Makiguchi et al.[6] demonstrated that steering wheel
mounted controls were more effective than controls on the instrumental panel. However, they did not examine the effectiveness of steering wheel-mounted switches by taking the display location factor into account. Although
Wierwille[7] stated that in-car controls and displays
should be designed by taking visual and manual demands into account, he did not give guidelines for where the displays and controls should be located. Murata and
Moriwaka [ 8 ] investigated how the number and
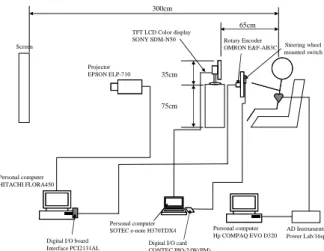
Figure 1. Outline of the experimental system.
Screen Projector EPSON ELP-710 TFT LCD Color display SONY SDM-N50 Personal computer HITACHI FLORA450
Digital I/O board Interface PCI2131AL
Personal computer SOTEC e-note H370TDX4
Digital I/O card CONTEC PIO-24W(PM)
Rotary Encoder
OMRON E&F-AB3C Steering wheel mounted switch AD Instruments Power Lab/16sp Personal computer Hp COMPAQ EVO D320 300cm 65cm 75cm 35cm
Fourth International Workshop on Computational Intelligence & Applications
arrangement of steering wheel mounted switches interactively affected performance. They found that the cross-type arrangement with three switches provided best performance and highest psychological rating.
These studies did not take the memory factors into account to the design of display with layered structures. The display design also should consider the findings on
eye movement characteristics that horizontal eye
movement is faster and easier than vertical eye
movement. Although Murata and Moriwaka[8]
investigated how the control should be designed without taking the display factors into account, the interaction between display and control factors must be investigated in order to obtain a more proper design guideline.
Older adults may have more difficulty in operating a vehicle than younger adults. There are many reports suggesting that older adults exhibit deficits in various
cognitive-motor tasks[9-11]. These authors reviewed the
literature in movement control and discussed the effects of age on cognitive-motor capabilities in driving, from
the viewpoint of movement science. Imbeau et al. [12]
discussed how the aging factor affected display design and driving performance. They made an attempt to provide designers with integrated performance data that helped them answer design questions and evaluate design alternatives. They presented a model that can predict performance (glance time of the display) using age, character size of the display, and contrast of the display. However, they did not discuss the effects of controls.
Smith et al.[13]reviewed the current databases applicable
to automobile design. They pointed out that design approaches and data used in automobile design are mostly for a young population. The design approach and data suitable for an older population has not been provided. They did however review data on the characteristics and problems of older drivers, including physical and motor, sensory and cognitive changes. It is pointed out that working memory of older adults is inferior to that of young adults. As the display and control systems of automobile is becoming more and
more complex with the growth of intelligent
transportation systems (ITS), it is predicted that memory workload would be a crucial factor and distract older drivers. The display design that takes the memory workload would be important especially for older adults.
As mentioned, there are many approaches that made an attempt to evaluate mental workload by means of
heart rate variability (HRV) measures[14]. However, in the
design of automobile cockpit module, the designed systems are evaluated on the basis of performance measures such as response time and accuracy, and psychological rating. There seem to be no attempts that evaluated the cockpit module design on the basis of mental workload. To provide drivers with driving
comfort, not only performance or psychological
measures but also mental workload measures must be used to evaluate the designed cockpit module.
In this study, the effects of age, task difficulty on performance and mental workload were discussed in order to provide design guideline of automobile display
that is friendly to older adults from the viewpoints of mental workload, performance (speed and accuracy) and psychological rating.
2. Method
Drivers in the experiments performed a simulated steering task. The secondary tasks included the control of an air conditioner, the operation of a radio, and the operation of a CD/MD. The control was conducted using either steering wheel mounted switches. The display was arranged on the appropriate panel in front of the participant. Participants were required to perform the secondary task while performing the primary task.
2.1 Participants
Twenty participants took part in the experiment. Ten were male adults aged from 65 to 76 years. All had held a driver’s license for 30 to 40 years. Ten were male undergraduate students aged from 21 to 24 years and licensed to drive from 1 to 3 years. Stature of participants ranged from 160 to 185 cm. The visual acuity of the participants in both young and older groups was matched and more than 20/20. They had no orthopedic or neurological diseases.
2.2. Apparatus
The experimental system is illustrated in Figure 1. The main components were (i) a pursuit tracking system (a personal computer with an I/O board, rotary encoder, and steering wheel). This PC was connected to a
projector to display a tracking task in front of the
participant.), (ii) a personal computer that was used to display speedometer and operational information, (iii) a personal computer equipped with an I/O card and used to enable the participant to operate switches, and (iv)ECG
(Electrocardiogram) measurement system (AD
Instrument, Power Lab/16SP). The CRT was in front of the participant.
2.3 Display
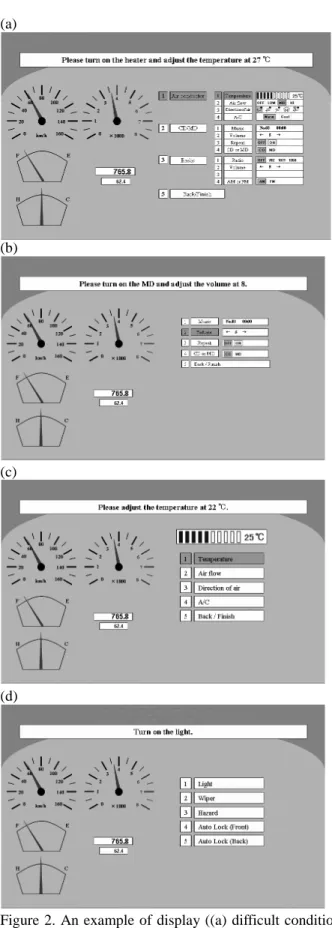
The display includes two static meters (speedometer and tachometer). Three displays show different kinds of information. One displays a task that the participant must perform using the switches. This display did not change until the task was completed. The second display informs the participant of the current state as the task is performed. The third displays a group of selectable menus. The related icons are also shown on the lower left. An icon related to an air conditioner is shown on the left. An icon related to a CD/MD and an AM/FM radio is shown on the right. The icons are for cooling (air conditioning), heating, CD, MD, repeat functions of CD or MD, and AM and FM radio. When these functions are selected, the corresponding icon appears. Examples of four types of displays are shown in Figure 2. In the easy task, using a display shown in Figure 2(d), one of the five alternatives is selected by a single key press. In the
difficult task (Figure 2(a)-(c)), according to the
instruction displayed on the top, the task is performed using multiple key presses.
2.4 Task
There were three types of secondary tasks: (i) control of an air conditioner (temperature, air flow, direction of
(a)
(b)
(c)
(d)
Figure 2. An example of display ((a) difficult condition: one layer, (b) difficult condition: two layers, (c) difficult condition: three layers, (d) easy condition. Only one switch pressing is necessary to complete a task.)
air flow, and A/C -when the air conditioner is on, this switch must be on); (ii) MD/CD operation (selection of
music, volume, set up of the repeat function, and switching between MD and CD) and (iii) radio operation (selection of radio station, volume, auto-tuning function, and switching between AM and FM).
A sample task was presented as follows: "Please turn on the air conditioner and adjust the temperature to 27 ℃ . "Conducting such a task required pressing a switch a minimum number of times. The participant, however, did not always complete the pre-specified task with the minimum number of switch pressings. It is possible to perform the task with more switching than the minimum required. The participant must first touches switch 1 and select the air-conditioner control. Second, the participant selects A/C from the menu, which allows switching from heating to air-conditioning. Next, the information on the current temperature was shown on the second display (status display) in Figure 2(a)-(c). The
participant adjusted the temperature to 27 ℃ by
operating the left- and right- arrow switches. When the participant determined the final state, the "enter" switch placed on the right side was pressed. It was not until the participant pressed the "enter" switch that the task was completed. Once the task was completed, a new task was shown on the task window to be performed by the participant.
The tracking task was one-dimensional with the
horizontal position of a target line changing
pseudo-randomly. The participant was required to follow the movement of a target line with the shorter vertical line controlled by a steering wheel. The target signals were produced by summing a number of harmonically related sinusoids of different phases (fundamental frequency 0.007Hz). This allowed several pseudo-random signals that were non-periodic within the duration of the tracking task. The signal bandwidth was set to 0.2 Hz (±0.1 Hz). In such a way, the position of the vertical target line was generated. The position of the vertical target line changed every 1.5 s. The position of the shorter vertical line controlled by the steering wheel was sampled every 0.1s. This means that the tracking task was one of step input types, rather than continuous. The tracking dynamics were first order in which the cursor responded proportionally to the time integral of the steering wheel (control) position. These dynamics simulate the yawing response of a motor vehicle and hence approximate the visual information processing demands of driving. The error of the vertical cursor from the target line was measured during the tracking duration. The root mean square of the error values was calculated and automatically written to the computer data file.
2.5. Design
The experimental factors were participant age (young and older adults) and task difficulty (work level) (easy and difficult: one-, two-, and three-layers). Age was a between-subject factor; task difficulty was a within-subject factor.
2.6 Procedure
The participant was asked to adjust his seat so that the task could be comfortably performed and the left-side console switches could be pressed by reaching his hand
T a sk c o m p le ti o n ti m e s Task difficulty 0 5 10 15 20 25 30
eas y on e layer two lay er s three layers
Young O lder
naturally (see Figure 1). Before the experimental tasks, the contents of primary and secondary tasks were explained to each participant.
ECG was measures from V5 lead. ECG during a rest condition was measured for seven minutes. Using ECG filed into a data file, R-R intervals were obtained.
Participants were allowed to practice before
performing experimental tasks. When the experimenter judged that the participant clearly understood how to perform a task, the experiment was started. The participant was instructed to keep his left hand on the steering wheel when not performing a secondary task.
The order of four conditions of task difficulty (easy, one-, two-, and three-layered) was counterbalanced across the participants. The participants were required to keep the primary task stable and also to perform the secondary task as fast and accurately as possible. Each task with different task difficulty was carried out once.
2.7 Evaluation measures
The task completion time, percentage correct, and
WWL score of NASA-TLX[15] were used. The
experimental measures of performance were (i) mean RMS tracking error between a moving target and a controlled vertical cursor, (ii) mean completion time of 20 secondary tasks, and (iii) mean percentage correct performance of the secondary task. Here a correct trial was defined as one in which the task was completed correctly, not necessarily with the minimum number of switching actions. As HRV (heart rate variability) measures, CV (coefficient of variance) of R-R intervals (interbeat interval) RRI, and RRV8-3 were used. The CV and RRV8-3 are given by
where
where
RRV8-3 is regarded to represent the function of autonomic nervous system, and it seems that RRV8-3 decreases under higher mental workload.
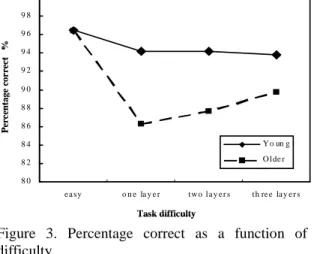
3. Result 3.1 Performance measures
The percentage correct and the task completion time in the secondary task are shown as a function of task difficulty in Figure 3 and Figure 4, respectively. At the easy condition, both measures of older adults were nearly equal to those of older adults. At the difficult condition, both measures of older adults were inferior to those of young adults. As a result of a two-way (age by task difficulty) ANOVA conducted on the percentage correct detected no significant main effect and interaction. A similar ANOVA carried out on the task completion time revealed only a main effect of age (F(1,18)=21.799,
p<0.01). In Figure 5, NASA-TLX score (WWL x 15) is
depicted as a function of age and task difficulty.
3.2 HRV (heart rate variability) measures
RRV8-3 and CV are shown as a function of age and task difficulty in Figure 6 and Figure 7, respectively. A two-way (age by task difficulty) ANOVA conducted on CV revealed main effects of age (F(1,18)=21.832,
p<0.01) and task difficulty (F(4,72)=12.096, p<0.01) and
age by task difficulty interaction (F(4,72)=4.420,
p<0.01). As a result of a similar two-way ANOVA conducted on RRV8-3, significant main effects of age (F(1,18)=23.424, p<0.01) and task difficulty (F(4,72) =14.799, p<0.01) and s significant age by task difficulty interaction (F(4,72)=10.383, p<0.01) were detected.
Figure 3. Percentage correct as a function of task difficulty.
Figure 4. Task completion time as a function of task difficulty.
(1)
CV
RRI
2 2 1 1 1 ( ) 1 N i i N i i RRI RRI N RRI RRI N
8 3
8
3
(2)
RRV
RRV
RRV
8 2 1 8 1 3 2 1 3 1 1 8 ( 8) 8 1 8 8 1 3 ( 3) 3 1 3 3 i i i i i i i i RRV RRI RRI RRI RRI RRV RRI RRI RRI RRI
8 0 8 2 8 4 8 6 8 8 9 0 9 2 9 4 9 6 9 8 1 0 0 e a sy o n e la y e r t w o l a y e r s t h re e la y e r s Y o un g O l de r Pe rc en ta g e co r re c t % Task difficulty 8 0 8 2 8 4 8 6 8 8 9 0 9 2 9 4 9 6 9 8 1 0 0 e a sy o n e la y e r t w o l a y e r s t h re e la y e r s Y o un g O l de r Pe rc en ta g e co r re c t % Task difficulty0 5 1 0 1 5 2 0 2 5 3 0 3 5 4 0 4 5 5 0 r e s t e a sy o n e la y e r tw o l a y e r s th r e e la y e r s Y o u n g O l d e r R R V 8 -3 m /s 2 0 5 1 0 1 5 2 0 2 5 3 0 3 5 4 0 4 5 5 0 r e s t e a sy o n e la y e r tw o l a y e r s th r e e la y e r s Y o u n g O l d e r R R V 8 -3 m /s 2 50 0 60 0 70 0 80 0 90 0 100 0
easy one layer two layers t hree layers Young Older N A S A -T L X S c o r e Task difficulty 50 0 60 0 70 0 80 0 90 0 100 0
easy one layer two layers t hree layers Young Older N A S A -T L X S c o r e Task difficulty 0 2 4 6 8 10 r e st e a sy o n e la y e r tw o la y e r s th r ee lay e r s Yo ung O lder C V m s 0 2 4 6 8 10 r e st e a sy o n e la y e r tw o la y e r s th r ee lay e r s Yo ung O lder 0 2 4 6 8 10 r e st e a sy o n e la y e r tw o la y e r s th r ee lay e r s Yo ung O lder C V m s
Figure 5. NASA-TLX (WWL) score as a function of task difficulty.
Figure 6. CV as a function of task difficulty.
Fig.7 RRV8-3 as a function of task difficulty.
4. DISCUSSION
As for young adults, the task completion time of difficult condition was longer than that of easy condition. Significant differences of task completion time among three difficulty conditions were not detected, although the task completion time of two-layer condition was shorter than that of one- and three-layer conditions (Figure 4)
As shown in Figure 6 and Figure 7, CV and RRV8-3 of young adults tended to be smaller under the rest condition than under the task performing condition (easy and difficult (one-, two-, and three-layer condition)).
(a)
(b)
(c)
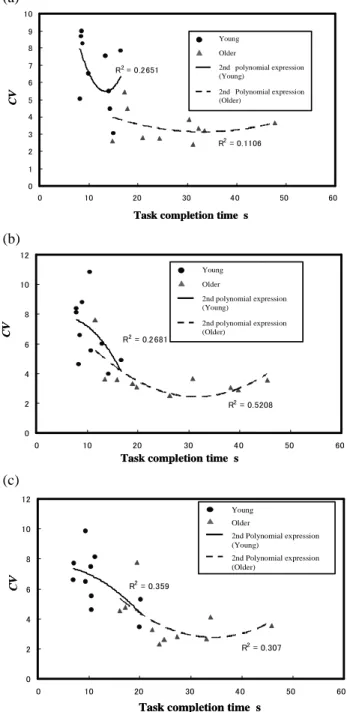
Figure 8. Relationship between task completion time and CV compared between young and older adults. (a) one-layer, (b) two-one-layer, (c) three-layer
This means that the task induced mental workload to each participant. The mental workload, judged from CV and RRV8-3, did not differ significantly among four conditions (easy and difficult conditions (one-, two-, and three-layer)). The relation between task condition and CV or RRV8-3 for older adults showed a tendency different from young adults. As well as the young adults, CV and RRV8-3 of older adults were smaller under easy task condition than under rest condition. However, as the number of layers increases, CV and RRV8-3 tended to increase and finally at three-layer condition became nearly equal to that of rest condition. The reason why such different tendencies were observed is discussed below.
A significant age by task difficulty interaction of CV R2= 0.2651 R2= 0.1106 0 1 2 3 4 5 6 7 8 9 10 0 10 20 30 40 50 60 C V
Task completion time s
Young Older 2nd polynomial expression (Young) 2nd Polynomial expression (Older) R2= 0.2651 R2= 0.1106 0 1 2 3 4 5 6 7 8 9 10 0 10 20 30 40 50 60 C V
Task completion time s
Young Older 2nd polynomial expression (Young) 2nd Polynomial expression (Older) R2= 0.2681 R2= 0.5208 0 2 4 6 8 10 12 0 10 20 30 40 50 60 Young Older 2nd polynomial expression (Young) 2nd polynomial expression (Older) C V
Task completion time s
R2= 0.2681 R2= 0.5208 0 2 4 6 8 10 12 0 10 20 30 40 50 60 Young Older 2nd polynomial expression (Young) 2nd polynomial expression (Older) C V
Task completion time s
R2= 0.359 R2= 0.307 0 2 4 6 8 10 12 0 10 20 30 40 50 60 Young Older 2nd Polynomial expression (Young) 2nd Polynomial expression (Older) C V
Task completion time s
R2= 0.359 R2= 0.307 0 2 4 6 8 10 12 0 10 20 30 40 50 60 Young Older 2nd Polynomial expression (Young) 2nd Polynomial expression (Older) C V
or RRV8-3 shows that the mental workloads induced by the same task demand differ between young and older adults (See Figure 6 and Figure 7). As shown in Figure 4 (task completion time) and Figure 5 (NASA-TLX), we can guess that mental workload under the difficult condition is higher than that under the easy condition. On the other hand, the mental workload evaluation based on HRV measures (Figure 6 and Figure 7) is different from that based on performance and psychological rating measures. As for the young group, the mental workload under the task condition (easy, and difficult (one-, two-, and three-layer) was higher than that under the rest condition. Different from the mental workload evaluation by performance and psychological measures, the mental workload judged on the basis of CV and RRV8-3 did not differ significantly under four task conditions. As for older adults, the variation of R-R intervals (interbeat intervals) was smaller in older adults than in young adults. This corresponds to the aging characteristics of
older adults. The CV and RRV8-3 of older adults under
the rest condition was higher than that under the easy task condition, which means that the mental work load during the easy task condition is higher. On the other hand, CV and RRV8-3 tended to increase under the difficult task condition, and eventually became nearly equal to that under the rest condition. This cannot be interpreted that the mental workload under the difficult task condition, because the mental workload under the difficult task condition can be estimated higher than that under the easy task condition from the viewpoints of performance and psychological measures (See Figures 3,
4, and 5). These results seem to be contradictory with
each other.
How these seemingly contradictory results can be interpreted must be discussed in detail below. Under the dual-task condition where the participants are required to perform both tracking task and the switch pressing task simultaneously, it is too difficult for older adults to carry out a secondary switch pressing task under the difficult task condition. It might be inferred that older adults cannot cope with such high demanding task condition, and they give up making effort to perform high demanding task conditions. Eventually, older adults perform such high demanding tasks with less effort like resting condition. This can be verified using the relationship between the task completion time and HRV measure (CV) in Figure 8 (a)-(c). The curves in Figure 8 corresponds to the approximation curve by 2nd order function. The curves corresponding to older adults in Figure 8 are all lower convex. When the task completion time is shorter than the value at the apex of 2nd order function, CV decreases as task completion time increases like a curve corresponding to young adults. When the task completion time is above this value, CV increases with the task completion time. When the task completion time is longer, older adults seem to perform the secondary switch pressing task so that they would not experience excessive mental workload. Such analyses might suggest that the difficult task condition is beyond their limit of mental effort, and cannot cope with such situations as young adults do. Although the performance and psychological measures did not reveal that the difficult task condition is beyond the limit of older adults’ mental efforts, the mental workload evaluation enabled us to clarify this situation.
ACKNOWLEDGEMENT
This study was partially supported by Japanese Scientific Fund (770:2004-2006).
REFERENCES
[1] Noy, Y.A., Human factors in modern traffic systems, Ergonomics, 40, 1016-1024, 1997.
[2] Wickens, C.D., Sandry, D.L., & Vidulich, M., Compatibility and resource competition between modalities of input, central processing, and output, Human Factors, 25, 227-248, 1983.
[3] Lambel, D., Kauranen, T., Laakso, M., and Summala, H., Cognitive load and detection thresholds in car following situations:safety implications for using mobile(cellular) telephones while driving, Accident Analysis and Prevention, 31, 617-623, 1999.
[4] Lambel, D., Laakso, M., and Summala, H., Detection thresholds in car following situations and peripheral vision: implications for positioning of visually demanding in-car displays, Ergonomics, 42, 807-815, 1999.
[5] Waller, P.F. and Green, P.A., Human factors in transportation, In G.Salvendy(ed) Handbook of Human Factors and Ergonomics (John Wiley & Sons, Inc, New York, NY), 1972-2009, 1997.
[6] Makiguchi, M., Tokunaga, H.,Kanamori, H., A human factors study of switches installed on automotive steering wheel, JSAE Review, 24, 341-346, 2003.
[7] Wierwille, W.W., Visual and manual demands of in-car controls and displays, in B.Peacock and W.Karwowski (eds) Automotive Ergonomics (Taylor & Francis, London), 299-320, 1993.
[8] Murata, A. and Moriwaka, M., Ergonomics of Steering Wheel Mounted Switch -How Number of Arrangement of Steering Wheel Mounted Switches Interactively Affects Performance-, International Journal of Industrial Ergonomics, 35, 1011-1020, 2005.
[9] Goggin, N.L., Stelmach, G.E., and Amrhein, P.C. Effects of age on motor preparation and restructuring, Bulletin of the Psychonomic Society, 27, 199-202, 1989.
[10] Goggin, N.L., and Stelmach, G.E., Age-related differences in kinematic analysis of perceptual movements, Canadian Journal on Aging, 9, 371-385, 1990.
[11] Stelmach, G.E. and Nahom, A., The effects of age on driving skill cognitive-motor capabilities, in B.Peacock and W.Karwowski(eds) Automotive Ergonomics(Taylor & Francis, London), 219-233, 1993.
[12] Imbeau, D., Wierwille, W.W., and Beauchamp, Y., Age, display design and driving performance, in B.Peacock and W.Karwowski (eds), Automotive Ergonomics (Taylor & Francis, London), 339-355, 1993.
[13] Smith, D.B.D., Meshkait, N., and Robertson, M.M., The older driver and passenger, in B.Peacock and W.Karwowski(eds) Automotive Ergonomics(Taylor & Francis , London), 453-467, 1993.
[14] Murata, A. Experimental discussion on measurement of mental workload. -Evaluation of mental workload by HRV measures-, IEICE Transactions of Fundamental of Electronics, Communications and Computer Science, No.2, 409-416, 1994.
[15] Hill,S.G., Iavecchia,H.P., Byers,J.C., Bittner,A.C., Zaklad,A.L., and Christ,R.E., Results of empirical and theoretical research. in P.A.Hancock and N.Mushkeit (eds) Human mental workload (North-Holland, Amsterdam), 139-183, 1992.