Article Type: Original Article
Error evaluation of the D-shuttle dosimeter technique in positron emission tomography study
Md. Shahidul Islam1,3,4, Shoichi Watanuki2, Manabu Tashiro2, Hiroshi Watabe1
1Division of Radiation Protection and Safety Control, Cyclotron and Radioisotope
Centre, Graduate School of Biomedical Engineering, Tohoku University, Sendai, 980-8578, Japan
2Division of Cyclotron Nuclear Medicine, Cyclotron and Radioisotope Centre, Tohoku
University, Sendai, 980-8578, Japan
3Radiation Control Division, Bangladesh Atomic Energy Regulatory Authority, Dhaka,
1207, Bangladesh.
4Bangladesh Atomic Energy Commission, E-12/A, Agargaon, Dhaka, 1207,
Bangladesh.
Corresponding Author: Hiroshi Watabe, PhD
Professor, Applied information technology for medical imaging with radiation, Biomedical Engineering, Tohoku University, Japan and
Division of Radiation Protection and Safety Control, Cyclotron and Radioisotope Centre, Tohoku University, Japan.
Email: [email protected], Phone: +81-22-795-7803, Fax: +81 22 795 7809 1 2 3 4 5 6 7 8 9 10 11 12 13 14 15 16 17 18 19 20 21 22 23 24
Abstract
The D-shuttle dosimeter technique is a convenient approach for estimating the radiation dosimetry in a positron emission tomography (PET) study that employs multiple D-shuttle dosimeters attached to the body surface of a patient. To bring this technique into clinical usage, it is very important to evaluate its performance by investigating the bias associated with D-shuttle dosimeter positioning and by comparing the estimates with those of the whole-body dynamic PET imaging technique. The torso cavity and six spheres of the NEMA body phantom were filled with 18F-FDG solution, and then, the phantom was imaged for one hour. We assumed the mis-located positioning of the D-shuttle dosimeters by shifting them in the z-direction (upper) in a range of 1 to 5 cm from the original positions. The cumulative radioactivities, absorbed doses, and effective dose were estimated using accurate and mis-located positions of the D-shuttle dosimeters. For comparison, the cumulative radioactivities were also estimated from the PET images, and then, the absorbed doses and effective dose were computed. The maximum bias of the average estimated cumulated radioactivities and the effective doses were -15.0 % and -19.7 % for the 1 cm shifted positions, respectively. The ratios of absorbed doses obtained from D-shuttle and PET measurement against the actual values were between 0.9 and 1.3, and 0.7 and 1.0, respectively. The bias associated with the D-shuttle dosimeter positions was significant and probably consistent, and both dosimetric techniques exhibited good performance in this phantom study.
Keywords: Error, D-shuttle dosimeter positioning, whole-body dynamic PET imaging, D-shuttle dosimeter technique.
25 26 27 28 29 30 31 32 33 34 35 36 37 38 39 40 41 42 43 44 45 46 47 48
1 Introduction
Positron emission tomography (PET) is a gamma imaging technique that enables visualization of metabolic processes in the human body. PET imaging is based on the simultaneous detection of two 511 keV annihilation photons that arise after positron-electron annihilation. In practice, a significant amount of radiopharmaceuticals synthesized from radionuclides (e.g., oxygen-15, fluorine-18, carbon-11, or nitrogen-13) is administered to the patient. PET systems have sensitive detector panels to capture gamma rays emitted from positron-emitting radiopharmaceuticals, and thus produce three-dimensional functional images of the body on the computer [1,2]. An internal radiation dosimetric study is necessary to ensure the safe use of PET technology and to protect patients when they are exposed to ionizing radiation. In this regard, Medical Internal Radiation Dose (MIRD), International Commission on Radiological Protection (ICRP), International Atomic Energy Agency and European Association of Nuclear Medicine have devised several policy statements, such as guidelines, methodologies, models, safety reports, improved dose regimes, and dedicated low dose whole-body PET protocols [3, 4, 5, 6]. However, internal radiation doses delivered to the patients from PET imaging examinations still remain a matter of concern [7,8].
Internal radiation dose calculations in nuclear medicine widely use the methodologies and formulations provided by the MIRD committee of the society of nuclear medicine. In the MIRD computational methodology, doses in the internal organs of patients are simplified as a function of the cumulative radioactivity and of the so-called S-values from the source to the target organ [3,9]. The S-value is the absorbed 49 50 51 52 53 54 55 56 57 58 59 60 61 62 63 64 65 66 67 68 69 70 71 72
dose to the target organ per unit of cumulative radioactivity in the source organ, which can be calculated using an MIRD reference phantom and Monte Carlo simulation. In the last decade, cumulative radioactivity estimation by whole-body dynamic PET imaging technique has been widely applied in nuclear medicine [10]. In this technique, after the administration of the radiopharmaceutical to patient, the whole-body dynamic PET imagining protocols are repeated to obtain the conspicuous images of the internal organs. Whole-body dynamic PET images are then reconstructed with attenuation and scattering corrections. Three-dimensional volumes of interest (VOIs) are hand-drawn on the PET transaxial or coronal slices of the frame where the organ is used to form time activity curves for calculating the cumulative radioactivity in the source organ [11]. A series of whole-body dynamic PET scans is difficult to perform routinely and takes much longer than usual clinical PET studies; this can make the patient uncomfortable [12]. As an alternative, our previous study [13] introduced the D-shuttle dosimeter technique as a convenient approach for estimating the cumulative radioactivity for each source organ in a PET study by using multiple D-shuttle dosimeters attached to the body surface of a patient. We also performed a validation study using a National Electrical Manufacturers Association (NEMA) body phantom. In this technique, a few D-shuttle dosimeters are placed on the patient’s body surface during a PET study to obtain information on the body surface doses, as these doses are connected to cumulative radioactivities in multiple source organs considering gamma ray contributions. The R-value is the radiation dose at the D-shuttle dosimeter position per unit of cumulative radioactivity in the source organ and can be computed by a Monte Carlo simulation with a mathematical phantom. Radioactivities of the source organs can be then estimated by solving the dose-radioactivity formula iteratively from the R-73 74 75 76 77 78 79 80 81 82 83 84 85 86 87 88 89 90 91 92 93 94 95 96
matrix and the body surface dose by using the maximum-likelihood expectation-maximization (MLEM) algorithm. Because a D-shuttle dosimeter releases a dose every 2 min, the cumulative radioactivity in a source organ can then be calculated from the radioactivity at 2-min intervals.
Internal radiation dose assessment by D-shuttle dosimeter technique depends on the model of the human body and its organs, and the D-shuttle dosimeter positioning on the human body against the source organ. To compute the R-value at each D-shuttle dosimeter position by Monte Carlo simulation, we need to determine the accurate positions of the D-shuttle dosimeters and the specified internal organs treated as the source organ of the patient. In our previous study [13], the determination of the D-shuttle dosimeters positioning on the NEMA body phantom surface and the position of source organs (i.e., the torso cavity and six spheres) were accurate. Hence, we obtained good results in all variants. However, in the clinical PET study, although we can accurately place the D-shuttle dosimeters on the patient body surface, it is not possible to measure the positions of the internal organs without performing computed tomography (CT) or magnetic resonance imaging (MRI) measurements. If CT and MRI procedures are not available, the accurate position of D-shuttle dosimeters on the patient body surface against the source organs may not be possible. The aim of this study is to investigate how much bias would be obtained if the determinations of D-shuttle dosimeter positions are mis-located. In this paper, we also compared two approaches to estimate the cumulative radioactivity, namely whole-body dynamic PET imaging and the D-shuttle dosimeter technique. We estimated the cumulative radioactivities, absorbed doses, and effective dose for the torso cavity and six spheres embedded in the NEMA body phantom through both dosimetric techniques.
97 98 99 100 101 102 103 104 105 106 107 108 109 110 111 112 113 114 115 116 117 118 119 120
2 Materials and Methods
2.1 D-shuttle dosimeter technique
In our previous paper [13], we addressed the D-shuttle dosimeter technique in detail for estimating the internal radiation dosimetry in PET study. According to the D-shuttle dosimeter technique, the body surface dose at the D-shuttle dosimeter position due to gamma decay in source organs can be expressed by the following formula:
di(t )=Ri ,1. A1(t )+ Ri ,2. A2(t )+ Ri ,3. A3(t )
=
∑
j Ri , j. Aj(t ) (1)where di(t) is the body surface dose at the ith D-shuttle dosimeter position at time t, Aj(t ) is the radioactivity at time t in the jth source organ, and Ri,j is radiation dose at the ith D-shuttle dosimeter position per unit cumulative radioactivity in the jth source organ. The R-value can be expressed by the following formula:
Ri , j=
∑
kψk(E)
(
μ en(k)(E)ρ)
(2) ψk( E) is the photon fluence as a function of photon energy per unit cumulative radioactivity in the source organ and μen(k)ρ−1 is the mass energy absorption coefficient. μen(k) is the mass energy attenuation coefficient as a function of the photon energy, and ρ is the density of the medium. The mass energy absorption coefficient can be taken from the International Commission on Radiation Units and Measurements (ICRU) Report 44 (1989) [14], and the photon fluence can be obtained from a Monte Carlo simulation. 121 122 123 124 125 126 127 128 129 130 131 132 133 134 135 136 137 138 139 140 141 142Radioactivity A(t) at time t in a source organ can be estimated from Ri,j values and D-shuttle dosimeter measurements to solve Eq. (1) iteratively using the MLEM algorithm. The cumulative radioactivity in a source organ can then be estimated from the obtained radioactivity A(t) at time t.
2.2 Error evaluation associated with mis-location of D-shuttle dosimeters
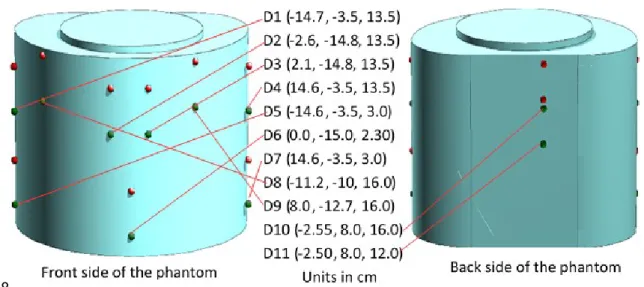
In our previous study [13], we determined the original positions of all eleven D-shuttle dosimeters carefully in Cartesian co-ordinates against the source organ; the torso cavity and six spheres of the NEMA body phantom were treated as the source organs, and the D-shuttle dosimeters were attached to the surface of the NEMA body phantom, which was filled with 18F-FDG solution. Radioactivity concentrations present in the torso cavity and six spheres were 0.00165 MBq/mL and 1.32 MBq/mL, respectively. A mathematical NEMA body phantom is modelled in the Heavy Ion Transport Code System (PHITS) Monte Carlo simulation code [15,16,17], which was used to compute the R-values at the D-shuttle dosimeter positions. In the current study, we assumed the mis-located positions of the D-shuttle dosimeters by shifting them in the z-direction (upper) in a range of 1 to 5 cm from the original positions. Figure 1 depicts the eleven D-shuttle dosimeter positions (D1 to D11) in Cartesian co-ordinates on the mathematical NEMA body phantom. The 5-cm shifted positions of all eleven D-shuttle dosimeters on the NEMA body phantom surface in the z-direction (upper) from the original positions are also shown in Figure 1. The green and red colors (points) represent the accurate positions and the 5-cm shifted (mis-located) positions of the D-shuttle dosimeters, respectively.
143 144 145 146 147 148 149 150 151 152 153 154 155 156 157 158 159 160 161 162 163 164 165 166
Fig. 1 Mathematical NEMA body phantom in Monte Carlo simulation with accurate and mis-located positions of the D-shuttle dosimeters (D) in the Cartesian co-ordinates; the green and red colors (points) show the accurate positions and the 5-cm shifted positions, respectively.
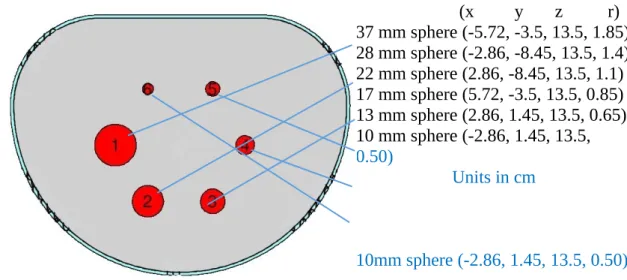
The length, width, and interior height of the NEMA body phantom in the x-, y-, and z-directions are 30.0 cm, 23.0 cm, and 19.4 cm, respectively. The distance between the center of each sphere and inside surface of the mounting plate is 7 cm. The thicknesses of torso wall, superior, bottom and top lid are 0.3 cm, 1.0 cm, 1.1 cm and 2.0 cm, respectively [16,17]. We determined the position of six spheres in the torso cavity based on the above-mentioned phantom geometry. Figure 2 shows the lateral (XY plane) view at z = 13.5 cm in the mathematical phantom, where regions 1–6 represent the position of the six spheres with 37 mm, 28 mm, 22 mm, 17 mm, 13 mm, and 10 mm inner diameters, respectively.
167 168 169 170 171 172 173 174 175 176 177 178 179 180 181 182 183
Fig. 2 The lateral view at z = 13.5 cm of the NEMA body phantom in PHITS; red color represents the position of six spheres in torso, with inner diameters of (1) 37 mm, (2) 28 mm, (3) 22 mm, (4) 17 mm, (5) 13 mm, and 6) 10 mm; and x, y, z are the three-dimensional positions and r is the radius of the spheres (units are in cm).
The PHITS Monte Carlo simulation yields the photon energy fluence at each D-shuttle dosimeter position for each source organ. We performed a Monte Carlo (PHITS) simulation using 511 keV primary energy, 60–700 keV energy range, 100 energy bins, the position of D-shuttle dosimeters, and 107 history numbers. We calculated the R-values at every accurate and mis-located position for each source organ from the obtained photon energy fluence using Eq. (2). The body surface doses at mis-located positions of D-shuttle dosimeters were estimated from the actual radioactivity and R-values at mis-located D-shuttle dosimeter positions by solving the dose-radioactivity formula (see Eq. 1). The cumulative radioactivity in each source organ was then estimated using the MLEM algorithm based on the obtained body surface doses at mis-located D-shuttle dosimeter positions and the R-values at original D-shuttle dosimeter
(x y z r) 37 mm sphere (-5.72, -3.5, 13.5, 1.85) 28 mm sphere (-2.86, -8.45, 13.5, 1.4) 22 mm sphere (2.86, -8.45, 13.5, 1.1) 17 mm sphere (5.72, -3.5, 13.5, 0.85) 13 mm sphere (2.86, 1.45, 13.5, 0.65) 10 mm sphere (-2.86, 1.45, 13.5, 0.50) Units in cm 10mm sphere (-2.86, 1.45, 13.5, 0.50) 184 185 186 187 188 189 190 191 192 193 194 195 196 197 198 199 200 201
positions. Absorbed doses for each mis-located position of D-shuttle dosimeters were calculated using the obtained cumulative radioactivities in the torso cavity and six spheres according to MIRD method. The effective dose for each mis-located position was calculated in accordance with ICRP 103 [18]. The cumulative radioactivities, absorbed doses, and effective doses were estimated for ‘‘n’’ number of mis-located D-shuttle dosimeters, where n = 1, 2, 3, 4,…….11. We also identified the dosimeters that were mis-located in this study. The D-shuttle dosimeters, namely, D1, D1 to D2, D1 to D3, D1 to D4, D1 to D5,………, and D1 to D11 were separately mis-located in a range of 1 to 5 cm in the z-direction (upper) from the original positions. The actual cumulative radioactivities and absorbed doses in the torso cavity and six spheres of the NEMA body phantom were also calculated from the known radioactivity concentrations and inner volumes.
Bias (%) in the cumulative radioactivities, average cumulative radioactivities of the six spheres and torso cavity, absorbed doses and effective doses were then calculated based on the estimated (i.e., inaccurate results due to mis-location of D-shuttle dosimeters) and actual cumulative radioactivities and absorbed doses in the torso cavity and six spheres of the NEMA body phantom.
2.3 PET measurement
Body surface dose measurements by D-shuttle dosimeters were carried out during the PET study using an Eminence STARGATE PET scanner (Shimadzu, Kyoto, Japan) at the Cyclotron and Radioisotope Center, Tohoku University, Japan. The PET component comprises 4 detector rings, each consisting of 88 detector blocks. One detector block 202 203 204 205 206 207 208 209 210 211 212 213 214 215 216 217 218 219 220 221 222 223 224 225
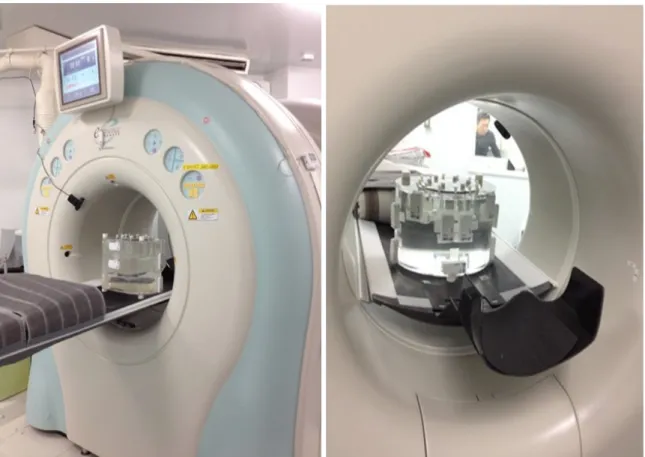
consists of 9 × 10 arrays of 2.45 × 5.1 × 30 mm3 gadolinium oxyorthosilicate (GSO) crystal elements. This gives an axial PET field of view of 20.8 cm. The detector ring diameter is 60.0 cm [19]. After preparing the NEMA body phantom, the phantom was placed over the patient’s bed and then imaged for one hour (Figure 3). A transmission scan was performed with a Cesium-137 source with 740 MBq radioactivity for attenuation correction of the emission data just before the emission scan. All PET images were recorded in digital imaging and communications in medicine (DICOM) format.
A mathematical NEMA body phantom was used to compute the S-values for the torso cavity and six spheres. Because the Monte Carlo simulation yields the total energy deposition in each source organ for photons emitted from various source organs, we performed a PHITS simulation using 511 keV primary energy and 107 history numbers. We calculated the S-values in the torso cavity and six spheres from the obtained energy deposition and the self-absorbed dose per radioactive decay (i.e., self S-value) for the 18F positron- emitting radionuclide having 249.8 keV positron (β+) energy.
226 227 228 229 230 231 232 233 234 235 236 237 238 239 240 241
Fig. 3 Positioning of D-shuttle dosimeters and NEMA body phantom imaging set up as performed in this PET study.
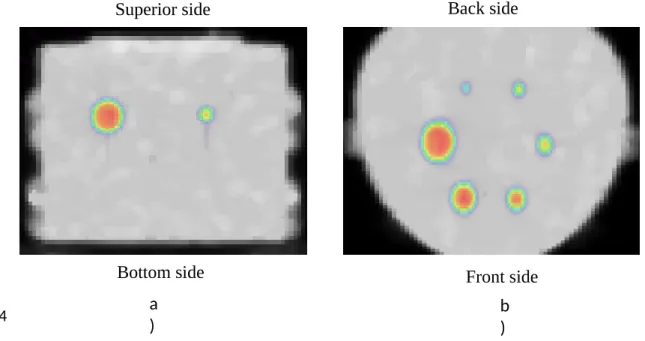
The PET image analysis was performed using a medical image data examiner [20] (AMIDE 1.0.4) (Figure 4). Three-dimensional volumes of interest (VOIs) of each source organ were hand-drawn on the PET transaxial or coronal slices of the emission frame to obtain the radioactivity concentration in each source organ. Cumulative radioactivities in the torso cavity and six spheres of the NEMA body phantom were calculated using the estimated radioactivity concentrations. The absorbed doses to these organs were also estimated in accordance with the MIRD computational methodology. 242 243 244 245 246 247 248 249 250 251 252 253
Fig. 4 Super imposed images of transmission and emission scans. The PET images; a) coronal image where two spots indicate the 37 mm and 17 mm spheres, and b) transaxial image where six spots indicate the six spheres of the NEMA body phantom with inner diameters of 37 mm, 28 mm, 22 mm, 17 mm, 13 mm, and 10 mm.
2.4 D-shuttle measurement
The radioactivity A(t) at each two-minute interval over a one-hour total dose time for each source organ was estimated iteratively using the MLEM algorithm based on body the surface doses, as measured by the D-shuttle dosimeter, and the R-values at the accurate D-shuttle dosimeter positions obtained by the PHITS simulation. For the MLEM calculation, a uniform initial guess of 1010 Bq and 40 iterations were assigned to solve the dose-radioactivity formula (see Eq. 1) iteratively. Cumulative radioactivities in the torso cavity and six spheres were estimated from the radioactivity at two-minute intervals in each source organ. The doses absorbed to these compartments of the NEMA body phantom were calculated according to the MIRD methodology.
b ) a
)
Superior side
Bottom side Front side
Back side 254 255 256 257 258 259 260 261 262 263 264 265 266 267 268 269 270
2.5 Effective dose calculation
According to ICRP 103, the effective dose was estimated from the absorbed doses obtained from both measurements (i.e., PET measurement and D-shuttle measurement). In this phantom study, we considered the same weighting factor for the torso cavity and six spheres, and the sum of the weighting factors is 1.
3 Results
The PHITS Monte Carlo technique was employed to simulate the S-value from the source organ to the target organ. The S-value results of the torso cavity and six spheres of the NEMA body phantom for 18F-FDG radiotracer are shown in Table 1.
Table 1. S-values [mGy/MBq.s] of the torso cavity and six spheres of the NEMA body phantom from the source organ to the target organ for the 18F positron- emitting radionuclide calculated by PHITS.
Target organs Source organs 37 mm sphere 28 mm sphere 22 mm sphere 17 mm sphere 13 mm sphere 10 mm sphere Torso cavity 37 mm sphere 1.8E-03 1.3E-05 3.7E-06 2.7E-06 3.7E-06 1.3E-05 5.0E-06 28 mm sphere 1.4E-05 4.0E-03 1.3E-05 3.7E-06 2.7E-06 3.7E-06 4.9E-06 22 mm sphere 3.7E-06 1.3E-05 8.1E-03 1.3E-05 3.7E-06 2.6E-06 5.0E-06 17 mm sphere 2.7E-06 3.8E-06 1.3E-05 1.8E-02 1.3E-05 3.8E-06 5.5E-06 13 mm sphere 3.6E-06 2.6E-06 3.6E-06 1.2E-05 3.7E-02 1.2E-05 5.2E-06 10 mm sphere 1.2E-05 3.6E-06 2.6E-06 3.6E-06 1.2E-05 8.0E-02 5.4E-06 271 272 273 274 275 276 277 278 279 280 281 282 283 284 285 286 287
Torso cavity 5.3E-06 5.2E-06 5.3E-06 5.7E-06 5.8E-06 5.8E-06 8.8E-06
Figures 5 and 6 illustrate the bias (%) in the cumulative radioactivity and in the absorbed dose of the torso cavity and six spheres associated with D-shuttle dosimeters mis-positioning in a range of 1 to 5 cm in the z-direction (upper) from the original positioning on the NEMA body phantom surface. In these figures, the red color filled circles represent the average cumulative radioactivity and the average absorbed dose (i.e., effective dose) of the torso cavity and six spheres. The x-axis of these figures indicates the number of mis-located D-shuttle dosimeters and identifies the D-shuttle dosimeters which ones were mis-located. The positive and negative values of the y-axis in the Figures indicate the overestimation and underestimation of our results, respectively. 288 289 290 291 292 293 294 295 296 297 298 299
Fig. 5 Box plots of the bias (%) in the cumulative radioactivity of the torso cavity and six spheres associated with the mis-location of D-shuttle dosimeters; bias due to a) 1 cm mis-location, b) 2 cm mis-location, c) 3 cm mis-location, d) 4 cm mis-location, and e ) 5 300
301 302 303
cm mis-location in the z-direction (upper) from the original positions. D1, D2, D1-D3,…., D1-D11 indicate that one (i.e., D1), two (i.e., D1 and D2), three (i.e., D1, D2 and D3),……, eleven (i.e., D1 to D11) D-shuttle dosimeters were mis-located, respectively. Red filled circle represents the average cumulative radioactivity.
304 305 306 307 308
Fig. 6 Box plots of the bias (%) in the absorbed dose of the torso cavity and six spheres associated with the location of D-shuttle dosimeters; bias due to a) 1 cm mis-location, b) 2 cm mis-mis-location, c) 3 cm mis-mis-location, d) 4 cm mis-mis-location, and e ) 5 cm mis-location in the z-direction (upper) from the original positions. D1, D1-D2, D1-D3, …., D1-D11 indicate that one (i.e., D1), two (i.e., D1 and D2), three (i.e., D1, D2, and 309 310 311 312 313 314
D3),……, eleven (i.e., D1 to D11) D-shuttle dosimeters were mis-located, respectively. Red filled circles represent average absorbed doses.
The actual and estimated cumulative radioactivities in the torso cavity and six spheres embedded in the NEMA body phantom are tabulated in Table 2. Absorbed dose estimates for all seven compartments and effective dose from 18F-FDG are summarized in Table 3. The estimated cumulative radioactivities, absorbed doses, and effective doses obtained from PET and D-shuttle measurements were very close to the actual values (see Table 2 and 3). Figure 7 represents the ratios of absorbed dose estimates to the torso cavity and six spheres obtained from the D-shuttle measurement and PET measurement against the actual value. Green and red colors represent the ratios of the absorbed doses obtained from the D-shuttle and PET measurements, respectively.
Table 2. The actual and estimated cumulative radioactivities in the torso cavity and six spheres of the NEMA body phantom [kBq.h/MBq]
Source organ Actual cumulative radioactivity
Estimated cumulative radioactivity PET measurement D-shuttle measurement
37 mm sphere 1168 1118 1111 28 mm sphere 508 478 529 22 mm sphere 245 210 239 17 mm sphere 110 92.3 140 13 mm sphere 51.9 41.8 49.8 10 mm sphere 23.5 17.3 29.1 Torso cavity 535 535 556 315 316 317 318 319 320 321 322 323 324 325 326 327 328 329 330
Table 3. Absorbed dose estimate [mGy/MBq] to each fillable compartment and effective dose [mSv/MBq] from 18F-FDG
Target organs Actual PET measurement D-shuttle measurement
37 mm sphere 7.64 7.31 7.27 28 mm sphere 7.40 6.96 7.68 22 mm sphere 7.17 6.17 7.02 17 mm sphere 7.01 5.89 8.95 13 mm sphere 6.87 5.54 6.60 10 mm sphere 6.78 5.04 8.43 Torso cavity 0.057 0.054 0.058 Effective dose 6.13 5.28 6.57 37 m m sp here 28 m m sp here 22 m m sp here 17 m m sp here 13 m m sp here 10 m m sp here tors o ca vity 0.6 0.7 0.8 0.9 1 1.1 1.2 1.3 1.4 D-shuttle/Actual PET/Actual Source Organ A b so rb ed d o se r a ti o
Fig. 7 Absorbed dose ratios between the PET and D-shuttle measurements against actual value for all seven source organs (i.e., the torso cavity and six spheres).
331 332 333 334 335 336
4 Discussion
Our previous study [13] demonstrated a validation study of the D-shuttle dosimeter technique by using a NEMA body phantom that contained six spherical radioactive sources and background radioactivity. In the validation study, we did not investigate the bias of the estimated internal dosimetry due to the inaccurate determination of the D-shuttle dosimeter positioning on the NEMA body phantom surface. Moreover, it is important to compare the dosimetric approach with the whole-body dynamic PET imaging technique. Consequently, our current study was performed to investigate the above-mentioned issues with our D-shuttle dosimeter technique.
OLINDA provides the tables of MIRD S-values for all source and target organs for a given phantom and radionuclide [21]. To perform the error evaluation of D-shuttle dosimeter technique and the comparison study of the internal radiation dosimetry between D-shuttle measurement and PET measurement using the MIRD schema, the S-values of the torso cavity and six spheres of the NEMA body phantom were computed by PHITS Monte Carlo code (see Table 1) instead of the OLINDA/EXM computer software, as the OLINDA/EXM does not provide the S-values for the NEMA body phantom.
The cumulative radioactivities and absorbed doses in the torso cavity and six spheres embedded in the NEMA body phantom were estimated through the D-shuttle dosimeter technique assuming the mis-positioning of dosimeters in a range of 1 to 5 cm in the z-direction (upper) from the original positions. Figure 5 and Figure 6 demonstrate the bias in the cumulative radioactivities and absorbed doses associated with the 337 338 339 340 341 342 343 344 345 346 347 348 349 350 351 352 353 354 355 356 357 358 359 360
inaccurately determined positioning of the D-shuttle dosimeters on the NEMA body phantom, respectively. It is clearly seen in the both figures, most of the box’s locations are on the –y-axis, which indicates the underestimated results due to the mis-located dosimeters.Because the mis-located D-shuttle dosimeter positions on the NEMA body phantom surface were far from the six radioactive spheres when compared to the original positions, the estimated surface doses at each mis-located position of the D-shuttle dosimeter were lower than the measured surface doses at the original positions. Thus, we obtained this underestimation in the cumulative radioactivity and the absorbed doses of the torso cavity and six spheres. As shown in Fig. 5, the obtained average cumulative radioactivity of the torso cavity and six spheres were overestimated until 3 mis-located D-shuttle dosimeters in a range of 0.25% to 22.9% and then it was underestimated due to 4 to 11 mis-located D-shuttle dosimeters as high as 49.0% at the 5 cm shifted position. It is also clearly seen in Fig. 6, the obtained average absorbed doses (i.e., effective doses) were overestimated until 3 mis-located D-shuttle dosimeters in a range of 0.01% to 20.6% and then it was underestimated as high as 71.3% at the 5 cm shifted position. As shown in Fig. 7, the estimated absorbed doses in two small spheres (i.e., 17 mm and 10 mm spheres) were overestimated by 28% in the 17 mm sphere and 24% in the 10 mm sphere. Therefore, the calculated effective doses (averaging doses of all targets) for less mis-locations (D1, D1 to D2, and D1 to D3) were overestimated in this study. For other cases, the overestimation of absorbed doses for lower radioactive spheres was lower than the underestimation of absorbed doses for other radioactive spheres, which resulted in the underestimation of the effective dose. As shown in Fig. 5 and 6, the error range increase by numbers of mis-located D-shuttle 361 362 363 364 365 366 367 368 369 370 371 372 373 374 375 376 377 378 379 380 381 382 383
dosimeters. It is also apparent that the cumulative radioactivities have a higher maximum and a larger range than the absorbed doses (see Figure 5 and Figure 6).
To apply the D-shuttle technique in a clinical PET study, we must take into account of the mis-locations of D-shuttle dosimeter positions. Although we will consider the personal outfit of figure for each patient, mis-positioning of the D-shuttle dosimeter will not be avoidable if CT or MRI procedures are not available. Ficaro et al. [22] stated that “anatomic differences between the respective anthropormic phantoms and individual patients introduce a dosimetric error, and an error value of 10% to 20% is probably not inconsistent’’ and “recent data report that organ doses for individual patients derived from reference dose coefficients are generally accurate to no better than 30% to 50% and variability may be as much as a factor of 2 or more.’’ The present study showed that the 1 cm and 2 cm mis-location of D-shuttle dosimeters attached to the NEMA body surface from the original positions introduced an error of the effective doses of -19.7% to 2.70% and -35.8% to 4.90%, respectively (see Figure 6(a) and Figure 6(b)), which suggests error due to the 2 cm mis-location of the D-shuttle dosimeter may be in an acceptable range for practical use. Further studies are required to determine how many mis-located D-shuttle dosimeter and how much mis-located distance would be acceptable to estimate the consistent internal radiation dosimetry when the D-shuttle dosimeter technique is applied in a clinical PET study.
Cumulative radioactivities and absorbed doses in the torso cavity and six spheres of the NEMA body phantom were estimated through whole-body dynamic PET imaging and D-shuttle dosimeter techniques. To calculate the cumulative radioactivities in the torso cavity and six spheres, we did not consider that biological excretion and uptake, and only physical decay dominates. The obtained results from both dosimetric 384 385 386 387 388 389 390 391 392 393 394 395 396 397 398 399 400 401 402 403 404 405 406 407
techniques are in agreement with the actual values, as presented in Table 2 and Table 3. We found some errors in the estimated cumulative radioactivity obtained from the D-shuttle and the PET measurements, as high as 28% in the 17 mm sphere and 24% in the 10 mm sphere, and 26% in the 10 mm sphere and 20% in the 13 mm sphere, respectively. The errors in the absorbed dose estimates to these compartments for both dosimetric approaches were almost the same as the calculated errors in the estimated cumulative radioactivities. In general, less error was observed for larger source organs for both dosimetric techniques in the present study. The ratio of the absorbed dose estimates in the torso cavity and six spheres of the NEMA body phantom obtained from PET and D-shuttle measurements with actual values are shown in Figure 7. Most of the ratios obtained from PET and D-shuttle measurements were in between 0.9 and 1.1, and 0.8 and 1.0, respectively. It is important to note that we also found the same trends for cumulative radioactivity ratios for both dosimetric approaches (Figure is not shown). We found the same trends and the same errors between the estimated absorbed doses and cumulative radioactivities in the torso cavity and six spheres of the NEMA body phantom for both dosimetric approaches because the self-absorbed dose contribution due to energy deposit by positron in the target sphere is greater than 99% and the absorbed dose contribution due to the photon interactions from the neighboring spheres to the target sphere is less than 1% in this study. Because areas of low radioactivity appear less intense and form inconspicuous PET images due to the partial volume effect in the PET image, we obtained inconspicuous images for the 10 mm sphere, 13 mm sphere, and 17 mm sphere (see Figure 4). Thus, underestimations with larger errors were found for small source organs such as 10 mm sphere, 13 mm sphere, and 17 mm sphere in the PET measurement. Because the 10 mm sphere contained the lowest 408 409 410 411 412 413 414 415 416 417 418 419 420 421 422 423 424 425 426 427 428 429 430 431
radioactivity, we obtained the over estimation with the larger error for this smallest source organ through D-shuttle measurement. Interestingly, the overestimation with the largest error was found for the 17 mm sphere, although a consistent estimation was obtained for the 13 mm sphere through D-shuttle measurements. This phenomenon may have occurred because of the number of contributed D-shuttle dosimeters for the 17 mm sphere was more compared to that for the 13 mm sphere. The bias in the estimated effective dose from PET measurement and D-shuttle measurement were 14% and 7%, respectively. Owing to the partial volume effect in PET imaging, the bias in the estimated effective dose obtained from PET measurement was twice that of the D-shuttle measurement in this study. D-D-shuttle dosimeter technique does not have issue of partial volume effect.
There are some limitations in this study. First, the NEMA body phantom does not contain bone structures. Second, the weighting factors for all regions in the NEMA body phantom are same. Third, there is no biological excretion and uptake, only physical decay dominates in this study.
5 Conclusion
The inaccurate determination of the D-shuttle dosimeter positioning on the patient body surface may lead to inaccuracies in the internal radiation dosimetry estimation in a clinical PET study. The present study evaluated the errors associated with the mis-location of D-shuttle dosimeters attached to a NEMA body phantom and showed that the 1 cm and 2 cm mis-location of all D-shuttle dosimeters from the original positions 432 433 434 435 436 437 438 439 440 441 442 443 444 445 446 447 448 449 450 451 452 453 454
resulted in -19.7% and -35.8% bias in effective dose, respectively. We also compared estimated doses by the D-shuttle dosimeter technique and the whole-body dynamic PET imaging technique. The estimated internal radiation doses by two techniques were close to the actual (true) values. The D-shuttle measurement showed overestimation and underestimation due to internal radioactivity and geometric dependency, while the PET measurement showed only underestimation due to the partial volume effect.
Acknowledgments
This study was supported by Grants-in-Aid for Scientific Research No. 16K15342 from the Ministry of Education, Culture, Sports, Science and Technology (MEXT), Japanese Government.
Compliance with ethical standards Conflicts of interest
The authors have no relevant conflicts of interest to disclose.
Ethical approval
This research article does not contain any human and animal studies.
References
1. Yilmaz G, Tugrul AB, Demir M, Yasar D, Demir B, Buyuk B. PET / CT Patient Dosage Assay. Int J Med Sci Eng. 2013;7(12):791-795.
2. Berger A. Positron emission tomography. Bmj. 2003;326(7404):1449-1449.
3. Bolch WE, Eckerman KF, Sgouros G, Thomas SR. MIRD Pamphlet No. 21: A 455 456 457 458 459 460 461 462 463 464 465 466 467 468 469 470 471 472 473 474 475 476 477 478
Generalized Schema for Radiopharmaceutical Dosimetry-Standardization of Nomenclature. J Nucl Med. 2009; 50:477-484.
4. International Commission on Radiological Protection. ICRP 106 Publication. Radiation Dose to Patients from Radiopharmaceuticals. Ann ICRP. 2008;38(1-2):21-24.
5. Brix, G. Dondi, M. Malone, J. Mantil, J. O’Reilly, G. Rehani, M.M. Relan, N. Shortt, K. Thompson, W. Townsend, D. Yonekura Y. Radiation Protection in Newer Medical Imaging Techniques:IAEA SAFETY RELATED PUBLICATIONS. IAEA Nucl Secur Ser. 2008:1-41.
6. de Groot EH, Post N, Boellaard R, Wagenaar NRL, Willemsen ATM, van Dalen JA. Optimized dose regimen for whole-body FDG-PET imaging. EJNMMI Res. 2013;3(1):1-11.
7. Kaushik A, Jaimini A, Tripathi M, et al. Estimation of radiation dose to patients from 18FDG whole body PET/CT investigations using dynamic PET scan protocol. Indian J Med Res. 2015; 142: pp 721-731.
8. Xie T, Bolch WE, Lee C, Zaidi H. Pediatric radiation dosimetry for positron-emitting radionuclides using anthropomorphic phantoms. Med Phys. 2013;40(10).
9. Toohey RE, Stabin MG, Watson EE. The AAPM/RSNA Physics Tutorial for Residents. Internal radiation dosimetry: principles and applications. RadioGraphics. 2000;20(2):533-546.
10. Sakata M, Oda K, Toyohara J, Ishii K, Nariai T, Ishiwata K. Direct comparison 479 480 481 482 483 484 485 486 487 488 489 490 491 492 493 494 495 496 497 498 499 500
of radiation dosimetry of six PET tracers using human whole-body imaging and murine biodistribution studies. Ann Nucl Med. 2013; 27:285-296.
11. Garg PK, Lokitz SJ, Nazih R, Garg S. Biodistribution and Radiation Dosimetry of 11 C-Nicotine from Whole-Body PET Imaging in Humans. J Nucl Med. 2017; 58:473-478.
12. Deloar HM, Fujiwara T, Shidahara M, Nakamura T, Yamadera A, Itoh M. Internal absorbed dose estimation by a TLD method for 18 F-FDG and comparison with the dose estimates from whole body PET. Phys Med Biol. 1999;44:595-606.
13. Islam MS, Watanuki S, Tashiro M, Watabe H. Internal radiation dose estimation using multiple D-shuttle dosimeters for positron emission tomography (PET): a validation study using NEMA body phantom. Med Phys. 2018;45(10):4693-4703.
14. White DR, Booz J, Griffith RV, Spokas JJ, Wilson IJ. Tissue Substitutes in Radiation Dosimetry and Measurement, the International Commission on Radiation Units and Measurements (ICRU), Report 44. 1989; os23:pages NP.
15. Sato T, Iwamoto Y, Hashimoto S, et al. Features of Particle and Heavy Ion Transport Code System (PHITS) version 3.02. J Nucl Sci Technol. 2018;3131:1-7.
16. National Electrical Manufacturers Association. “NEMA Standards Publication NU 2–2007, Performance measurements of positron emission tomographs”. 2007. Rosslyn, VA. 26–33. 501 502 503 504 505 506 507 508 509 510 511 512 513 514 515 516 517 518 519 520 521 522
17. Greer K, Perry T. Data Spectrum’s NEMA IEC Body Phantom Set User’s Manual. National Electrical Manufacturers Association. 2006, Product ID: PET/IEC-BODY/P, Manual Number: PET/IEC-BODY/UM.
18. International Commission on Radiological Protection. ICRP 103 Publication. The 2007 Recommendations of the International Commission on Radiological Protection. Ann ICRP. 2007; 37:1-34.
19. Okazaki M, Inoue Y, Amano M. Development of “‘Eminence STARGATE’” PET/CT system. Shimadzu Rev. 2009;65(3-4):203-210.
20. Loening AM, Gambhir SS. AMIDE: a free software tool for multimodality medical image analysis. Mol imaging Off J Soc Mol Imaging. 2003;2(3):131-137.
21. Stabin MG, Sparks RB, Crowe E. OLINDA/EXM: the second-generation personal computer software for internal dose assessment in nuclear medicine. J Nucl Med. 2005; 46:1023–1027.
22. Ficaro EP, Zanzonico P, Stabin MG, Raff GL et al. Variability in radiation dose estimates from nuclear and computed tomography diagnostic imaging. J Nucl Cardiol. 2009;16(2):331-331. 523 524 525 526 527 528 529 530 531 532 533 534 535 536 537 538
![Table 1. S-values [mGy/MBq.s] of the torso cavity and six spheres of the NEMA body phantom from the source organ to the target organ for the 18 F positron- emitting radionuclide calculated by PHITS](https://thumb-ap.123doks.com/thumbv2/123deta/5931156.1052236/14.892.119.766.848.1118/table-values-spheres-phantom-positron-emitting-radionuclide-calculated.webp)


![Table 2. The actual and estimated cumulative radioactivities in the torso cavity and six spheres of the NEMA body phantom [kBq.h/MBq]](https://thumb-ap.123doks.com/thumbv2/123deta/5931156.1052236/19.892.127.793.800.1113/table-actual-estimated-cumulative-radioactivities-cavity-spheres-phantom.webp)
![Table 3. Absorbed dose estimate [mGy/MBq] to each fillable compartment and effective dose [mSv/MBq] from 18 F-FDG](https://thumb-ap.123doks.com/thumbv2/123deta/5931156.1052236/20.892.104.760.227.1037/table-absorbed-dose-estimate-mbq-fillable-compartment-effective.webp)
