A study on characteristics and verification method
for moiré minimization in 3D display
July 2019,
Lee Hyoung
Contents
1 Introduction
1.1 Background ··· 1
1.1.1 Moiré phenomenon ··· 1
1.1.2 Definition of moiré ··· 2
1.2 Objective & Outline ··· 4
2 Behaviors of moiré fringes induced by plate thickness
2.1 Introduction ··· 5
2.2 Theoretical ground of leading chirped moiré fringes ··· 7
2.3 Moiré fringe simulation ··· 11
2.4 Experimental results ··· 14
2.5 Conclusion ··· 18
3 Color moirés in contact-type three-dimensional displays
3.1 Introduction ··· 19
3.3 Color moirés in contact-type 3-D imaging ··· 23
3.4 A formula for the moiré fringe periods ··· 29
3.5 Moiré characteristic for different VZFO ··· 30
3.6 Moiré reductions methods ··· 32
3.7 Conclusions ··· 35
4 Fringe periods of color moirés in contact-type 3-D displays
4.1 Introduction ··· 36
4.2 Derivation of moiré fringe periods in the contact-type 3-D displays ··· 37
4.3 Experimental set-up ··· 41
4.4 Experimental results ··· 43
4.5 Conclusion ··· 51
5 Simulation of slanted color moirés in IP-type 3-D displays
5.1 Introduction ··· 52
5.2 Behaviors of the color moirés ··· 53
5.3 Moiré fringe simulation ··· 54
5.4 Moiré fringe simulation ··· 57
6. Holographic and light field imaging as future 3D displays
6.1 Introduction ··· 63
6.2 Parameters defining the quality of 3-D images ··· 65
6.3 History of 3D imaging: From stereo imaging to light field displays ··· 67
6.4 The condition to be a light field display ··· 76
6.5 The difference in light field characteristics
between Holographic and light field images ··· 79
6.6 Problems and current issues in holographic and light field imaging ··· 85
6.7 Future progresses in the holographic and light field displays ··· 90
6.8 Conclusions ··· 91
7. Summaries and conclusions ··· 93
Reference ··· 96
1
1 Introduction
1.1 Background
1.1.1 Moiré phenomenonThe moiré phenomenon is one of the display characteristics found in the 1960s. Normally, moiré is called
interference pattern, wavy pattern, or grid pattern, which refers to stripes that are created visually by the difference
of these cycles when repeatedly joining repeated patterns. moiré patterns appear in many different situations. The
moiré phenomenon can be found not only in a display monitor
3(TV), printed photographs, documents containing pattern images but also in buildings, clothing, etc... As
mentioned above, the moiré phenomenon is one of phenomena easily found in our everyday life. The moiré effect
is a visual optical effect observed in regular superposed layers. To a considerable extent, the moiré effect is caused
by the periodicity of layers, such as the highly regular pixel grid of a digital screen, a lenticular or barrier plate of
a typical autostereoscopic three-dimensional display. The moiré fringes form a patterned background which is effectively added to a displayed image, and the image quality degrades.
Fig. 1-1. Examples of Moiré phenomena found in everyday life Display monitor
The bottom of the escalator Clothing fibers
2
To provide the high quality, the visibility of the moiré patterns should be estimated and the moiré effect should be
minimized [1-1]. In order to realize this moiré minimization method, definition of moiré, geometrical
characteristic, color characteristic, period characteristic and mathematical expression should be studied.
1.1.2 Definition of moiré
moiré effect is a visual perception that occurs when viewing a set of lines or dots that is superposed on another
set of lines of dots, where the sets differ in relative size, angle, or spacing. We cannot see any moiré phenomenon
when we look at line image at regular intervals, but when we overlap one-line image of the same line or rotate it
at a certain angle, we can clearly see the moiré phenomenon. The moiré effect can be seen when looking through
ordinary window screens at another screen of background.
Fig. 1-2. Basic principle of moiré phenomenon
The moiré phenomenon can explain the moiré by its geometric representation. In other words, a natural
interference effects can be explained by overlapping with two or more plates with regular patterns are superposed.
In this moiré phenomenon image, it can be classified into dense area and sparse area. In dense area, it is lines in
two patterns are barely or not matched to each other. For this reason, this area looks dark and dense. Also, in sparse
area, it is lines in two patterns are completely or almost matched to each other [1-2]. This distinctive feature can
be found in all moiré phenomena. This allows us to study the characteristics of moiré. We can do moiré
3
Fig. 1-3. Geometrical representation of moiré phenomena
The moiré phenomenon or effect on a 3D display is different from the moiré phenomenon on a 2D display. In the
3D display, moiré phenomena are shifting as viewers changes his viewing positions. The moiré phenomena are
different for different viewing angles [1-3]. This characteristic is one of the most important factors when viewing 3D images. The moiré phenomenon is one of the causes of the degradation of the image quality in the
three-dimensional display and causes the crosstalk between neighboring viewing areas. Many methods have been
developed to minimize the moiré phenomenon but they are mainly grouped into two such as 1) slanting or rotating the VZFO (Viewing Zone Forming Optic) line pattern, 2) adding a diffuser between the panel and the VZFO
[1-4] –[1-7].
Fig. 1-4. Examples of Moiré pattern
4 1.2 Objective & Outline
The purpose of this thesis is to find out the characteristics of moiré in 3D display and verify it through developed simulation. For this purpose, this thesis is divided into 4 stages as follows: 1) study of moiré geometry and color
characteristics in 3D displays, 2) mathematical representation of moiré in 3D display, 3) verification of moiré
through developed moiré simulation, 4) to find optimization of moiré reduction method in 3D displays.
In 3D display, geometrical concepts, mathematical expressions, experiment and verification using VZFO, and
verification with simulator were performed for the study of moiré geometry characteristics. This study explains
the relationship between moiré phenomenon and VZFO in 3D display, and defines the characteristics caused by it. This research process was introduced in Chapter 2. We define basic Moiré characteristics in 3D display and
study color characteristics using them. Also, we study the phenomenon of moiré that visual phenomenon
according to color combination appears according to the characteristic of VZFO in 3D display. More specifically, the color representation in a typical display is determined by the R, G, and B constituting the pixel. In addition to
this element, the 3D display also causes other characteristics such as the space of pixels and pixels, and the space
between the display and VZFO. In this process, we express a new formula for calculating moiré. This research
process was introduced in chapters 3 and 4 as basic principles, mathematical expressions, experiments, and
verification through simulation. In this study, the characteristics of moiré phenomenon occurring in 3D display
are defined, and mathematical expressions are verified through experiments. In Chapter 5, we simulates the
characteristics of slanted color moirés at various angles(0°~45°) in IP-type 3-D displays. We define the angle at
which moiré minimization is achieved through experimental verification. Finally, we find a method of minimizing
the moiré phenomenon through simulation technology. All of these processes are intended to prevent degradation
of image quality caused by moiré phenomenon in 3D display, and at the same time to create an optimal viewing
environment. Therefore, chapter 6 describes general image quality definitions for 3D displays, a description of a typical 3D display scheme, the formation of VZFO, and future perspectives.
5
2 Behaviors of moiré fringes induced by plate thickness
2.1 Introduction
Moiré is a common physical phenomenon appearing whenever two regularly patterned plates are superposed
together [2-1]. The physical reasons behind the moirés are the difference between the pattern periods of the two
plates. I.e., the moiré fringes are induced by beating between periods of the two patterns. The behaviors of the
moiré fringes induced by this beating process can be easily predicted by cosine approximation of two grating
patterns. In this prediction, it has always been assumed that the thickness of each of the two plates is negligible.
Hence the number and position of moiré fringes for a given plate length and the fringe periods are fixed without
regarding to viewers’ viewing position, viewing distance and viewing angle change. Furthermore, the minus or
plus difference between periods of two plate patterns has no role in the moiré fringe behavior. It can show only
static moiré fringes. However, when the top plate has a thickness, the moiré fringe behaviors are completely
different from the negligible thickness case. The thickness induces moiré fringe shifting, and changes in number
of moirés fringes within a given plate length and period of each fringe when a viewer changes his/her viewing
position, viewing distance and viewing angle of seeing the moiré fringes. And also, minus or plus difference
resulted when the pattern period of one plate is subtracted from that of the other shows opposite moiré fringe
behaviors, i.e., the periods and numbers of the moiré fringes are continuously either increasing or decreasing
depending on the minus or plus difference as the viewing angle increases. This means that the moiré fringes are
chirped. These moiré fringe behaviors have not been known so far and no moiré fringe descriptions found in
metrology [2-2]-[2-4] and security [2-5]-[2-7] areas which have been known as the main application areas of
moiré phenomenon, describe them. This is probably because it is necessary to have two patterned plates with one
of them having a uniform thickness that can induce a comparable change in period of the other plate pattern, to
observe the chirped moiré fringes. The gap effect which deals the moiré fringes when two regularly patterned
plates are distanced with a certain air gap between them [2-8], [2-9], can be a special case of the thickness. In fact,
the most of the moiré applications in metrology has basically the same set-up as the gap effect because it has the
form of seeing a fringe pattern through a known grating pattern. The effect will be the case when refractive index
6
moiré fringes which have no relationship with viewing angle and position at a given viewing distance, refractive
index of the top plate and the minus or plus difference between two plates.
These moiré fringe behaviors can be explained by considering that the bottom plate pattern is chirped as the moiré
fringes. In fact, the period of the line pattern in the bottom plate is virtually shortened by the thickness of the top
plate because it is viewed through the top plate. When the top plate has a thickness, the bottom plate pattern will
be refracted toward to the viewer by the top plate to appear at the pattern surface of the top plate. Since the amount
of the shortening increases as the viewing angle increases and the refractive index of the top plate decrease, the
period of the bottom plate pattern at the patterned surface reduces as the viewing angle increases. This means that
the bottom plate pattern is chirped. The mixing of chirped and regularly spaced patterns creates a chirped moiré
fringe. Since the viewing angle depends on viewing distance and viewing position, the period variation of the
chirped pattern depends also on viewing distance and position. The period of the bottom pattern is varying with
the changes in viewing angle, and viewing distance and position. This explains that why the moiré fringes are
shifting. This is because the relative phase difference between two patterns changes as the viewing position
changes.
The example of two superposed regularly patterned plates with the top plate having a thickness can be found in
contact-type 3-D displays [2-10], though the thickness of the top plate has never been considered in analyzing
moiré fringes in the displays [2-11], [2-12]. Since the increasing size and resolution of the displays result in a
larger viewing angle of viewing displayed images at a closer distance from them, it will be necessary to know
exactly the properties of the moiré fringes in these displays to develop more effective methods of reducing them
in future.
The two-plate structure as in the 3-D displays was used to measure refractive index of the top plate material
[2-13]. In this approach, the top plate is separated into two parts of the pattern part and the thickness part and then
the thickness part is replaced by the material to be measured. The refractive index of unknown material is
estimated by comparing the amount of moiré fringe shifting between the unknown and a reference.
In this paper, the presence of chirped moiré fringes in two superposed regularly patterned plates with one of the
plates having a uniform thickness are identified, the theoretical ground of leading the chirped moiré fringes is
7
2.2 Theoretical ground of leading chirped moiré fringes
When two regularly patterned plates are superposed, the moiré fringes are induced by the beating between the
pattern periods of the two plates. Hence the period of a moiré fringe, 𝛿・ is given as (2-1),
𝛿・ =
ቚ
ఋ
ఋ
・ఋ
ಳ
・
◌ିఋ
ಳ
ቚ
(2-1)Where 𝛿
◌்
and 𝛿・ are pattern periods of top and bottom plates, respectively. Eq. (2-1) indicates that the moiréfringe period will be increased as the difference between 𝛿
◌்
and 𝛿・ becomes smaller. However, they can hardlybe equal due to misalignment, tolerances in pattern periods and uniformity of the patterns. Figure 1 shows the
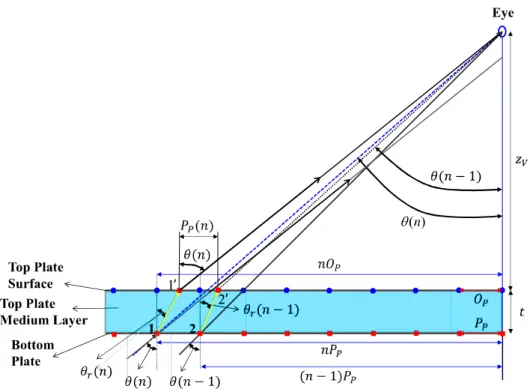
viewing geometry of two superposed regularly patterned plates when the top plate has a thickness 𝑡. The circular dots in top plate and square dots in bottom plate represent the regular patterns in them. The geometry is drawn as
if a viewer watches the plate at right edge of the plate at the distance 𝑧・ to simulate a large size display panel.
When a viewer at distance 𝑧・ from the top plate watches the bottom plate, i.e., the panel through the top plate,
i.e., viewing zone forming optics (VZFO) having a thickness 𝑡, the panel pattern will be looked on the patterned surface of the VZFO by refraction effect as shown in Figure 2-1.
Fig. 2-1. Optical geometry of viewing two superposed regularly patterned plates
Eye Top Plate Surface Bottom Plate ( )n Top Plate Medium Layer 1 2 1 2
8
By this refraction effect, the patterns 1 and 2 of the panel are viewed as if they are patterns 1
ᇱ
and 2ᇱ
in the patterned surface of the VZFO. Hence the VZFO and panel patterns are superposed at the patterned surface of theVZFO and create moiré fringes. The positions of patterns 1
ᇱ
and 2ᇱ
will be found from the fact that the incidence angle of a ray to a flat object is equal to the exit angle of the ray from the object. However, this fact allows finding 1ᇱ
and 2ᇱ
only numerically. However, a more simple way is the following because of 𝑡 << 𝑧・: When there is noVZFO, 𝑛
௧
・
panel pattern from the right edge, specified by 1 will be viewed with the viewing angle 𝜃(𝑛) = 𝑡𝑎𝑛◌ିଵ
{ 𝑛𝑃・/(𝑧・ + 𝑡)} at the left edge of the panel, where 𝑃・ is the period of the line pattern on the panel. 𝑃・is the same as 𝛿・ in Eq. 1. 𝑛𝑃・ represents length of the panel. When the VZFO is on the panel, the panel pattern
is refracted by the medium layer of the VZFO and viewed together with the VZFO pattern at the patterned surface
of the VZFO. The refraction angle of pattern 1 will be given as 𝜃・(𝑛) = 𝑠𝑖𝑛
◌ିଵ
{ 𝑠𝑖𝑛 𝜃 (𝑛)/𝑚・}, where 𝑚・is therefractive index of the VZFO. Hence pattern 1 will appear at the position of pattern 1
ᇱ
on the patterned surface of the VZFO. Likewise pattern 2 at 2ᇱ
. The distance of pattern 1ᇱ
from the right edge will be given as 𝑛𝑃・ −𝑡 𝑡𝑎𝑛 𝜃・(𝑛) . Viewers’ eyes perceive pattern 1
ᇱ
instead of 𝑛௧
・
line pattern of the panel. Since (𝑛 − 1)𝑃・ −
𝑡 𝑡𝑎𝑛 𝜃・(𝑛 − 1) is the perceived position of the (𝑛 − 1)
௧
・
line pattern in the panel, 𝑃・(𝑛) will be calculated as,
𝑃・(𝑛) = 𝑃・− 𝑡{𝑡𝑎𝑛 𝜃・(𝑛) − 𝑡𝑎𝑛 𝜃・(𝑛 − 1)} (2-2)
In Eq. (2-2), 𝑡𝑎𝑛 𝜃・(𝑛 − 1) is 0 when 𝑛 = 1. Figure 2 depicts 𝑃・/𝑃・(𝑛) values for two cases of 𝑛 = 1 to
𝑛
・・
௫
and 𝑛 = 1 to 𝑛・・
௫
for the three different 𝑧・ values of 0.7 m, 1.0 m and 2.0 m. A polycarbonate that hasa refractive index of 1.589 at wavelength of 555 nm [14] is assumed as the VZFO medium. The pattern period of
the VZFO is 3.406 mm for 𝑛
・・
௫
and 1.28 mm for 𝑛・・
௫
. 𝑛・・
௫
and 𝑛・・
௫
correspond to 𝑛𝑂・ , i.e., VZFOlengths of 1.032 m and 0.8m, respectively. These lengths represent the maximum sizes of available lenticular
9
Fig. 2-2. Graphical representation of calculated 𝑃・/𝑃・(𝑛) values
For this reason, the abscissa of Figure 2 represents 𝑛𝑂・from right most edge to left most edge. The period 𝑃・
and the medium thickness 𝑡 are assumed as 3.3 mm and 3 mm, respectively for 𝑛 = 1 to 303 case, and as 1.292 mm and 2.4 mm, respectively, for 𝑛 = 1 to 607 case. These values are chosen by the availability. 𝑃・/𝑃・(𝑛) is
the inverse value of the normalized 𝑃・(𝑛) values by 𝑃・. Each line in Figure 2 represents the line frequency
variation in each corresponding panel pattern, i.e.,𝑓・ = 1/𝑃・. 𝑓・ = 1/𝑃・ will be modulated by each 𝑃・/𝑃・(𝑛)
line. Figure 2 informs that 1) the line frequency reduces continuously as the viewing angle increases, 2) 𝑃・(𝑛)
values are always smaller than 𝑃・ but the differences between them reduce as 𝑧・ increases, 3) 𝑃・(𝑛) becomes
closer to 𝑃・ as 𝑛 increases for all 𝑧・ values and 4) the difference between 𝑃・ and 𝑃・(𝑛) is less than 0.3%.
This information indicates that 𝑃・(𝑛) value, i.e., the period of the panel pattern is chirped. The panel line pattern
with a uniform period turns visually to the line pattern with continuously increasing period for all 𝑧・ values. The
small difference between 𝑃・ and 𝑃・(𝑛).indicates almost no chirping for small 𝑛 values but the chirping will
be more visible as 𝑛 becomes larger because the accumulated difference to the large 𝑛 values increases as 𝑛.increases. This means that the chirped moiré fringes can be observed for a large size panel. The line pattern with continuously increasing or decreasing period is considered as a chirp pattern. This chirp pattern can be
10
chirp modulation function leading the chirp pattern, as specified by each line in Figure 2. 𝑠(𝑥) is expressed by a 12th order polynomial to faithfully retrace the chirp modulated pattern with use of MATLAB. Since the phase of
the oscillating signal is given by the integral of the frequency function, the mathematical expression of chirped
oscillation, 𝑆(𝑥) is given as (2-3),
𝑆(𝑥) = 𝑐𝑜𝑠{ 𝜙・+ 2𝜋𝑓・∫ 𝑠(𝑥)𝑑𝑥・
௫
} (2-3)In Eq. 2-3, 𝜙・ is the initial phase at 𝑥 = 0. When the VZFO and panel are superposed together, if 𝑂・(= 𝛿
◌்
) isthe period of the VZFO, the moiré fringes 𝑓・ can be expressed as [2-12],
𝑓・ =
ଵଶ
{1 + 𝑐𝑜𝑠( 𝜔・𝑥)} − [1 + 𝑐𝑜𝑠{ 𝜔ை◌
(𝑥 + 𝛥𝑥)}] (2-4)Where 𝜔
ை◌
and 𝜔・ are spatial frequency of the VZFO and panel patterns, respectively, 𝛥𝑥 is the differencebetween starting lines of the VZFO and panel patterns and 𝜔
ை◌
𝛥𝑥 = 𝜙・. 𝜔ை◌
and 𝜔・are represented as 𝜔ை◌
=2𝜋𝑓
ை◌
(= 1/𝑂・) and 𝜔・ = 2𝜋𝑓・(= 1/𝑃・), and 𝛥𝑥 is smaller than 𝑂・ in Eq. 4. When 𝑡 ≠ 0, 𝛥𝑥 will vary asviewers change their viewing positions because of relative phase changes between 𝑂・ and 𝑃・(𝑛). This explains
the moiré fringe shifting as viewers change their viewing positions. Eq. (2-3) is further reduced as [16],
𝑓・ =
ଵଶ
[𝑐𝑜𝑠ଵଶ
{(𝜔ை◌
− 𝜔・)𝑥 + 𝜔ை◌
𝛥𝑥} + 𝑐𝑜𝑠ଵଶ
{(𝜔ை◌
+ 𝜔・)𝑥 + 𝜔ை◌
𝛥𝑥}]ଶ
(2-5)Eq. (2-4) indicates that moirés are created by two cosines with periods 2𝑂・𝑃・/(𝑂・ − 𝑃・) and 2𝑂・𝑃・/(𝑂・ +
𝑃・), respectively, because 𝜔
ை◌
− 𝜔・ and 𝜔ை◌
+ 𝜔・ in Eq. (2-4), are expressed as 2𝜋/{𝑂・𝑃・/(𝑂・ − 𝑃・)} and2𝜋/{𝑂・𝑃・/(𝑂・ + 𝑃・)}, respectively. Since the difference between 𝑂・ and 𝑃・ is small, 2𝑂・𝑃・/(𝑂・ − 𝑃・) will
be much bigger than 2𝑂・𝑃・/(𝑂・ + 𝑃・). This means that the envelopes of the moiré fringes are defined by the
1st consign term but the local variations are defined by the 2nd cosine term in Eq. (2-4). Hence the moiré fringe
periods will be defined by the 1st consign term. Hence the beat period defined in Eq. (2-1) represents the moiré
fringe period. Furthermore, the second cosine reveals that the moiré fringe’s local variation has the period close
to the pattern period because 2𝑂・𝑃・/(𝑂・ + 𝑃・) can be reduced to either 𝑂・ or 𝑃・ due to their small difference
compared with their actual values. By combining Eqs. (2-3) and (2-4), 𝑓・ is rewritten as,
𝑓・ =1
2{1 + 𝑆・(𝑥)} − [1 + 𝑐𝑜𝑠{ 𝜔
ை◌
(𝑥 + 𝛥𝑥)}]=
ଵଶ
[1 + 𝑐𝑜𝑠{ 𝜔・ ∫ 𝑠・௫
・(𝑥)𝑑𝑥}] − [1 + 𝑐𝑜𝑠{ 𝜔ை◌
(𝑥 + 𝛥𝑥)}] (2-6)When both the VZFO and panel patterns are made to contact each together, both of them will be viewed through
11
𝑓・ =
ଵଶ
[1 + 𝑐𝑜𝑠{ 𝜔・∫ 𝑠・௫
・(𝑥)𝑑𝑥}] ⋅ [1 + 𝑐𝑜𝑠{ 𝜔ை◌
𝛥𝑥 + 𝜔ை◌
∫ 𝑠・௫
ை◌
(𝑥)𝑑𝑥}] (2-7)In Eqs. (2-6) and (2-7), subscripts 𝑃 and 𝑂 represent 𝑠(𝑥) for panel and VZFO line patterns, respectively. The polynomial expression of 𝑠(𝑥) has the following form;
𝑠(𝑥) = ∑・
・ ・
◌ୀ
𝑎・𝑥・ (2-8)This 𝑗
௧
・
order polynomial should retrace very faithfully the 𝑃・(𝑛) curves of the line patterns and thicknessesemployed in this manuscript. In Eq. (2-8), 𝑎・(𝑖 = 1 to 𝑗) represents constants. The integral form of the 𝑠(𝑥) is
given as, ∫ 𝑠(𝑥)𝑑𝑥・
௫
= ∫ ∑ 𝑎・𝑥 ・ ・◌ୀ
・ ・
𝑑𝑥 =௫
・ ∑ ・◌ାଵ
・・
𝑥・
◌ାଵ
・◌ୀ
・ ・
(2-9)By substituting Eq. (2-9) to Eq. (2-6) or (2-7), moiré fringes for different combinations of thicknesses and periods
can be estimated.
2.3 Moiré fringe simulation
Since the lenticular plates having near 1m length are available for us only for 𝑂・ =1.27 mm and 𝑂・ =3.406 mm
cases, moiré fringes described by Eqs. (2-6) and (2-7) are calculated for two cases of 1) 𝑂・ = 1.27 mm,
𝑃・ =1.292 mm and 𝑡 = 2.4 mm, and 2) 𝑂・ =3.406 mm, 𝑃・ =3.3mm and 𝑡 =3.0 mm for the three 𝑧・ values
of 0.7 m, 1 m and 2 m. The 1st case is for 𝑃・ > 𝑂・ and the 2nd for 𝑃・ < 𝑂・. In both cases, the calculations are
compared with that from 𝑡 =0.0 mm case. Other parameter values are the same as in Figure 2. A 12th order polynomial, i.e., 𝑗 = 0 to 12 is used to retrace 𝑃・(𝑛) for the specified VZFO lengths. It is expected that the
number of moiré fringes will increase with increasing 𝑧・ values for 𝑃・ > 𝑂・ case but decrease for 𝑃・ <
𝑂・case. In other word, the period of the moiré fringes decreases continuously with increasing 𝑧・ values for 𝑃・ >
𝑂・ case but increases continuously for 𝑃・ < 𝑂・ case. This is because 𝑃・(𝑛) becomes smaller as 𝑧・ value
decreases due to increasing 𝜃(𝑛) values. As 𝑃・(𝑛) decreases, the differences between 𝑂・ and 𝑃・(𝑛)
decrease for 𝑃・ > 𝑂・ but increase for 𝑃・ < 𝑂・ . According to Eq. (2-1), 𝛿・ will increase for 𝑃・ > 𝑂・ but
decrease for 𝑃・ < 𝑂・. Hence the number of moiré fringes will be smaller for smaller 𝑧・ values. For 𝑃・ > 𝑂・,
the number is smaller than that of 𝑡 =0.0 mm case for all 𝑧・ values. Furthermore, the periods of moiré fringes
are continuously reduced as the distance from viewers increases because 𝑃・(𝑛) becomes closer to 𝑃・. For 𝑃・ <
12
and it is always larger than 𝑡 =0.0 mm case. Furthermore, the periods of moiré fringes increase continuously as the distances from viewers increase. The differences in moiré fringe characteristics between 𝑡 = 0.0 mm and 𝑡 ≠0.0 mm cases will be diminished as 𝑧・ increases for both 𝑃・ > 𝑂・ and 𝑃・ < 𝑂・ cases. Figure 2-3 shows
the results when the plate width is considered as 810 mm for 𝑃・ > 𝑂・case and 1,000 mm for 𝑃・ < 𝑂・ case. The
moiré fringes are calculated by assuming that viewers are seeing the moiré fringes at right most edge and at the
mid-position of the VZFO plate, respectively. The moiré fringe periods are determined by the 𝜔
ை◌
− 𝜔・ term inEq. (2-2). The distances between two white broken lines and arrows with two tip lines represent the 1st moiré
fringe period from the right edge. 𝛿・ is approximately calculated as 74.58mm and 106.04mm for 𝑃・ > 𝑂・and
𝑃・ < 𝑂・ cases, respectively, for 𝑡 =0.0 mm. 𝛿・ indicates that the total number of moiré fringes for 𝑃・ > 𝑂・and
𝑃・ < 𝑂・cases are 10.86 and 9.43 , respectively. When 𝑂・ plate has a thickness, 𝑃・ plate will be seen through
the 𝑂・ plate. The total numbers of moiré fringes for 𝑃・ > 𝑂・case, are calculated as 9.83, 10.08 and 10.41, and
for 𝑃・ < 𝑂・case as 9.98, 9.88 and 9.69 for 𝑧・ 0.7 m, 1 m and 2 m, respectively, according to Eq. (2-3) and the
first cosine term of Eq. (2-5). These numbers are different from those of 𝑡 =0.0 mm cases. For the given plate widths, the period ratios of the last and first fringes for 𝑧・ values of 0.7 m, 1 m and 2 m are (78.9 mm/88.07 mm
= 0.91), (80.28 mm/83.62 mm = 0.96) and (77.6 mm/78.0 mm = 0.994), respectively, for 𝑃・ > 𝑂・ case, and
(103.34 mm/97.73 mm = 1.057), (102.99 mm/100.03 mm = 1.030) and (103.53 mm/102.92 mm =1.006),
respectively, for 𝑃・ < 𝑂・case.
13
The periods are longer for 𝑃・ > 𝑂・ case and shorter for 𝑃・ < 𝑂・ case than the static cases, but the periods
become nearly the same as those for the static as 𝑧・ increases. The ratios indicate that the chirped variations will
be intensified for smaller 𝑧・ values. This is shown in Figure 3. The periods of moiré fringes decrease more for
𝑃・ > 𝑂・ case and increase more for 𝑃・ < 𝑂・ case as away from the right edge of the moiré fringes, though the
chirped variations are noticed from 6th fringe from the right edge for both 0.7 m and 1.0 m for both 𝑃・ > 𝑂・ and
𝑃・ < 𝑂・ cases. The period ratios of the left most and right most moiré fringes for 𝑧・ =0.7 m is approximately
0.93 and 1.05 for 𝑃・ > 𝑂・ and 𝑃・ < 𝑂・cases, respectively. These variations induce the moiré fringes to shift to
the right side for 𝑃・ > 𝑂・ case and to the left side for 𝑃・ < 𝑂・ case as 𝑧・ increases. The moiré fringes are
chirped, except 𝑡 =0.0 mm case. For 𝑡 =0.0 mm case, moiré fringes are having a constant period for both cases. For the case of 2 m, the period variations are hardly noticed for the calculated plate sizes. This is because the
difference between 𝑃・ and 𝑃・(𝑛) for 2 m is smallest among the three 𝑧・ values. In fact, 𝑃・/𝑃・(𝑛) value for
the given distance and thickness values cannot exceed 1.001 as shown in Figure 2-2. Figure 2-4 shows the period
ratio of 1st moiré fringe to following fringes for three different 𝑧・values in both cases. The ratio is calculated up
to 2 m. It is obvious that the ratios are continuously decreasing as the numbers increases for 𝑃・ > 𝑂・ case but
increasing for 𝑃・ < 𝑂・ case. The decreasing and increasing rate is highest for 𝑧・ = 0.7 m. For the 2 m case in
both cases, the ratios are close to 1 for the calculated plate sizes in Figure 2-3. Figure 2-4 shows clearly that the
14
Fig. 2-4. Calculated period ratio of 1st moiré fringe to following fringes for three different 𝑧・values in both cases.
The number in each line represents 𝑧・ value.
2.4 Experimental results
To verify the simulation results, two moiré experimental sets having the same parameters as in simulation are
prepared as in the simulation. For both experimental sets, line printed papers with corresponding 𝑃・values are
used for the bottom plates for the demonstration purposes. However, for the VZFO, a lenticular plate with 1.27
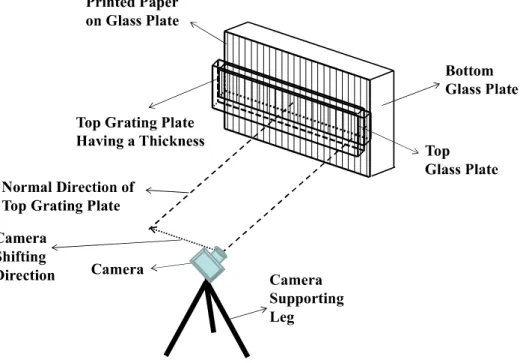
mm pitch, 2.4 mm thickness and 200㎛ lens height, and a line printed plastic sheet with 3.4mm interval, glued on a plastic plate with thickness 3mm are used. Both the lenticular and the plastic plate are made of the polycarbonate mentioned in Figure 2-2. The lengths of the lenticular plate and the plastic plate are 0.81 m and 1.0
m, respectively. Photographs of moiré fringe patterns are taken with Nikon D700 camera with Sigma’s wide-angle
objective DG HSM which has a nominal field of view angle of 122°. The optical axis of the camera is aligned at both right edge and mid-position of the top plates to show moiré fringe shifting with the viewing position changes
for three 𝑧・ values of 0.7 m, 1 m and 2 m. The minimum value of the photographing distance is set to 0.7 m
because the Sigma objective can cover the plate length 1.0 m at 0.7 m owing to its wide field of view angle. Since
the printed line patterns and lenticular plate can have different line widths from their nominal values, the line
15
lines are drawn with 100 mm interval on the printed paper for two purposes; one is to compensate the contraction
of images which are away from the center of the wide-angle objective, and the other is to align moiré fringes from
different 𝑧・ values. The reference lines can allow estimating the image contraction at larger viewing angles
caused by the wide-angle objective. The contractions in each 100 mm interval will inform the amount of the
compensations that should be given to the image portions of the interval. The contractions will appear more for
smaller viewing distances because of larger viewing angles for a given plate lengths. The experimental sets are
placed between glass plates to minimize the bending of top plates and crumples in the printed papers. This is
shown in Figure 2-5. The optical axis of the camera is focused to the right edge of the top plate by making the
axis in parallel to the normal direction of the top plate. For the center view the camera axis is aligned to the normal
direction. Since the moiré fringes are formed in the pattern surface of the top plate, the glass plate doesn’t affect
the results. Figures. 2-6 and 2-7 show the experimental results of 𝑃・ > 𝑂・ and 𝑃・ < 𝑂・cases, respectively, when
the camera is cantered at the right most edge of the VZFO. Furthermore, 1) the first dark moiré fringe in the right
side and the reference lines in different moiré fringes are aligned in a line for the comparison with the simulation
results in Figure 2-3, 2) the arrows and solid bars represent the period of the 1st moiré fringe and the distance (10 cm) between 1st and 2nd reference lines from the right most side of each moiré fringe, respectively, 3) the white
broken lines represent the center of each dark fringes in each moiré fringe pattern. These lines are to ease the bad
contrast problem of Figure 2-7, 4) 𝑡 =0.0 mm is achieved by contacting lens array side of the lenticular plate to the printed paper and 5) the lens height is neglected because the moiré fringe pattern doesn’t affect by the lenses
with 200㎛ height. Figure 2-6 reveals that the numbers of moiré fringes are 10.9, 9.90, 10.20 and 10.40 for 𝑧・values of 0.7 m, 1.0 m and 2.0 m, respectively. The differences between these numbers are 0.1 for all 𝑧・ values.
These differences are just within 1% of the numbers. The moiré fringes are shifting more to right side with
increasing distances. For 𝑃・ < 𝑂・ case, the numbers of moiré fringes are 9.3, 10.0, 9.80, 9.60 for 𝑧・values of
0.7 m, 1.0 m and 2.0 m, respectively, as shown in Figure 2-7. The moiré fringes shift more to the left side as 𝑧・
increases and the numbers of moiré fringes are the same for the simulation for 𝑧・ =0.7 m, and less than 0.1 for
𝑡 =0.0 mm, and 𝑧・ = 1 m and 2 m. As in 𝑃・ > 𝑂・ case, the difference is within the error range. This means
that Eqs. (2-2) and (2-7) are correct expressions for the virtual changes in the line periods of the bottom plate
patterns and moiré fringes, respectively. Figures. 2-6 and 2-7 also show that the moiré fringes are chirped,
16 away from the right edge.
Fig. 2-5. Experimental set-up
Fig. 2-6. Experimentally obtained moiré fringes for 𝑃・ > 𝑂・ case
Bottom Glass Plate Printed Paper on Glass Plate Camera Camera Supporting Leg
Top Grating Plate Having a Thickness Normal Direction of
Top Grating Plate Camera
Shifting Direction
Top Glass Plate
17
Fig. 2-7. Experimentally obtained moiré fringes for 𝑃・ < 𝑂・ case
These chirped variations are clearly noticed from 7th fringe for both figures at 𝑧・ =0.7 m. However, the variation
is noticed from 6th fringe in the simulation in Figure 2-3. They have only one fringe difference. This difference is
probably caused by the difficulties in defining the period of each fringe in the moiré fringes. The viewing angle
corresponding to the 7th fringe is 41.4° (𝑡𝑎𝑛
◌ିଵ
( (88.07 × 7)/700) and 44.3° (𝑡𝑎𝑛◌ିଵ
( (97.73 × 7)/700)) for 𝑃・ > 𝑂・ and 𝑃・ < 𝑂・ cases, respectively. For 𝑧・ =1.0 m, the chirped variation is noticed from the left mostfringe in the cases. So the viewing angle is given as 39.0° (𝑡𝑎𝑛
◌ିଵ
( 810/1000)) and 42.6° (𝑡𝑎𝑛◌ିଵ
( 918/1000): there are 9.8 fringes) for 𝑃・ > 𝑂・ and 𝑃・ < 𝑂・ cases, respectively. Since the viewing angles for 𝑧・ =1.0 mare smaller than those of 𝑧・ =0.7 m for the simulation, the chirped moiré fringes will always be observed when
the viewing angle is more than 44.3° for the parameters used in this paper. However more thorough studies are
required to formulate the angle with parameters responsible for the chirped moiré fringes. The white arrow in the
left most fringe represents the right most fringe period. The rates of increasing and decreasing become smaller as
𝑧・ increases. For the case of 𝑧・ =2 m, the chirped moiré fringes are evidenced only at the left most fringes as
shown in Figure 2-3. Figures 2-6 and 2-7 are not different from Figure 2-3. It shows exactly the same moiré fringe
18
the last and first fringes for 𝑧・ values of 0.7 m, 1 m and 2 m are given as 0.92, 0.96 and 0.98, respectively, for
𝑃・ > 𝑂・case, and 1.055, 1.03 and 1.0, respectively, for 𝑃・ < 𝑂・ case. These ratios are almost the same as their
corresponding cases as in Figure 2-3. The mid-position view of the moiré fringes for each 𝑧・ is also shown in
Figure 2-6. “R” and “C” represents right most edge and the mid-position cases, respectively. They demonstrate
that the moiré fringes are shifting as viewers change their viewing positions when the top plate has a thickness.
No shifting is seen for 𝑡 =0.0 mm. It appears that the shifting is more for larger distances. The maximum possible shifting will be a fringe period. Due to the shifting, all moiré fringes have the same number of dark fringes. Figures.
2-6 and 2-7 clearly indicate that the chirp type period variation of the bottom plate pattern induces chirped moiré
fringes which have different fringe numbers with varying viewing angles. The chirp type variation is brought by
the thickness and the refracted index of the top plate, though their variation becomes lesser as the viewing distance
increases. The fringes don’t disappear even at large viewing distance.
2.5 Conclusion
Two superposed regular patterned plates can create chirped moiré fringes when the top plate has a thickness. The
chirped moiré fringes are shifting as viewer’s change his/her viewing position and the chirped period variations
will be more or less as the viewing distance and/or viewing angle increases/decreases. These chirped moiré fringes
are created because the bottom plate pattern is viewed through the top plate. The bottom pattern is refracted when
it is going through the top plate to appear at the pattern plane of the top plate and its uniform period changes to a
chirped period due to the refraction. The mixing between the regular top plate pattern and the chirped pattern
produces a chirped moiré fringe. The chirping in moiré fringes becomes more noticeable as the viewing angle
increases and the viewing distance decreases. Since the viewing angle depends on both viewing distance and the
plate length, it increases as the plate length increases for a given viewing distance. At a large viewing distance,
the moiré fringes can no longer show their chirped variations due to the diminished viewing angle.
The chirped moiré fringes can be used to measure the refractive index of materials and applied for anti-counterfeit
19
3 Color moirés in contact-type three-dimensional displays
3.1 Introduction
Color moirés are one of hostile phenomena appearing at contact-type three-dimensional (3-D) imaging such as
multiview and light field imaging equipped with a VZFO for viewing zone forming [3-1] - [3-4]. The problem is
that they can be hardly eliminated because the imaging requires structurally a VZFO which should be superposed
on a display panel. This structure will induce color moirés because the panel pattern can be approximated as a
two-dimensional periodic colored line grid pattern by the pixel arrangement and the VZFO either a two- or
one-dimensional periodic line pattern due to the boundaries between elemental lenses in lenticular and microlens array,
and the periodic line array in parallax barrier [3-5]. The moirés have been considered so far as a beating
phenomenon occurring whenever two films with periodic line patterns are overlapped together with or without air
gap between them [3-6]. The beating phenomenon requires that the difference between the pattern periods of the
two films should be smaller than the pattern period of the film with the smaller period between two films
[3-7]-[3-9]. However, in the contact-type 3-D and light field imaging, 1) the line period of the VZFO line pattern is
typically more than several times of that of the pixel pattern, 2) there is a material gap between two patterns,
determined by the combined thickness of VZFO material and the cover glass of the display panel, and 3) the panel
pattern is not a simple grating but has a near continuous RGB color pattern lined by the boundaries of sub-pixels
in the horizontal and pixels in vertical directions. These differences make the moirés in the contact-type 3-D
imaging behave completely differently from those in two film patterns: Since the VZFO is made from one of
several plastics [3-10], it has a refractive index close to that of the cover glass of the display panels. Due to the
gap induced by the VZFO material and the cover glass, the pixel pattern on the panel cannot combined with the
VZFO line pattern as in two films with regular line patterns but the panel pattern will be refracted by the gap
materials before it is combined with the VZFO line pattern when viewers view the display. Since the panel pattern
will be more refracted as the viewing angle increases, the pixel pattern that is away from the viewing position will
be more refracted. Due to this refraction effect, the pixel period is virtually decreased as the pixel distance from
the viewers’ positions increases. Hence the panel pattern at the pattern plane of the VZFO line pattern will be
20
[3-11] and the color moirés even for the case when the panel and VZFO line patterns have the same period. Since
the viewing angle changes as the viewers’ relative position to the panel and the viewing distance change, the
chirping degree of the chirped pixel pattern also changes. Hence the color moirés are not static but show a dynamic
behavior: They are shifting as the viewers’ position and the viewing distance change. Due to the large period
difference between the panel and VZFO line patterns, the period of the chirped color moirés cannot be calculated
with the conventional beat frequency formula for moiré period calculation. A new formula of calculating the
period is needed. The formula had been derived by considering that the color moirés are the result of periodic
blocking of the chirped panel pattern the VZFO line pattern [3-12]. Since the panel pattern consists of a repeated
arrangement of R(red), G(Green) and B(Blue) sub-pixels and there is a small gap between sub-pixels and between
pixels, the panel looks white when all the pixels in the panel is On. In this case, if the VZFO line pattern blocks
periodically a part of each sub-pixel, the color balance of the pixel pattern will be broken and consequently the
panel is no longer white but periodically colored. When the line width of lines in the VZFO line pattern is larger
than the pixel period, the color moirés will reveal periodically aligned dark lines with the colored lines. This
periodical color pattern is the color moirés in the contact-type 3-D and light field imaging [2-13]. Since these
color moirés are induced by the structural layout of the contact-type displays, they are inherent and cannot be
eliminated completely unless the periodicity of one of the panels and VZFO line patterns becomes irregular. So,
it is necessary to find the ways of minimizing them.
There is a couple of ways of reducing color moirés. One is slanting the lines in the VZFO line pattern to have a
certain angle with the panel pattern [3-14]. In this case, the color moirés become almost invisible as the angle
increases to around 26° for the lenticular case. Since this angle was obtained under the assumption that VZFO’s
line and the panel patterns have the same period, the angle is not proper for the contact-type displays. However,
the angle is still effective for the displays because the color moiré becomes unclear as the angle increases due to
the fact that the VZFO lines pass around 1.5 sub-pixels for a pixel height. Hence the sub-pixel color changes due
to the blocking will be more insignificant and the unblocked parts of the sub-pixels look combined as a white
color to viewers’ eyes, especially when the line width is small than the sub-pixel width as in a lenticular. The
slanting is a very effective method of minimizing moirés in lenticular plate as the VZFO, but it does not guarantee
that the same angle works for the parallax barrier. This way of minimizing the color moirés will result increasing
21
a diffuser between VZFO and the panel [3-15]. The visible moirés are effectively reduced with the diffuser but it
will reduce also the image sharpness and increases the crosstalk because of the pixel boundary diminishing by the
diffuser. The moirés can be further reduced as the diffusing power of the diffuser increases. However, the image
sharpness will be more reduced and the crosstalk more increased.
In this paper, the color moirés in contact-type three-dimensional imaging is reviewed for the case when the slanting
angle of the VZFO line pattern is 0∘. And some experimental results of color moirés for nonzero slanting angle
are introduced and their behaviors are analyzed.
3.2 Parts of a manuscript
As described in introduction, the pixel pattern is represented as a two-dimensional (2-D) wire grid and the VZFO
either a line grid or a two-dimensional (2-D) wire grid. To find the generalized expression of two overlapped 2-D
wire grids, the VZFO is also treated as a 2-D wire grid. The mathematical geometry of two overlapped wire grids
is shown in Fig. 3-1.
x
y
1xK
1yK
2xK
2yK
VZFO Line Grid
/
yp
/
yp
Pixel pattern xp
yp
/
y xp
p
Overlapped Line Grid22
Fig. 3-1. Mathematical geometry of overlapped two grids of different dimensions.
When two wire grids are overlapped as in Fig. 1, the mathematical expression of them, 𝑀(𝑥, 𝑦) is expressed as [3-16],
𝑀(x, y) = c(1 + cos𝐾
ሬ
ሬ
ଵ௫
∙ 𝑥⃗)(1 + 𝑐𝑜𝑠𝐾ሬ
ሬ
ଵ௬
∙ 𝑦⃗) × (1 + cos𝐾ሬ
ሬ
ଶ௫
∙ 𝑥⃗)(1 + 𝑐𝑜𝑠𝐾ሬ
ሬ
ଶ௬
∙ 𝑦⃗) ,(3-1) In Eq. (3-1), c is a constant, 𝐾ሬ
ሬ
ଵ௫(௬)
and 𝐾ሬ
ሬ
ଶ௫(௬)
are the vector forms of wave numbers in 𝑥(𝑦) direction for pixel and VZFO line patterns, respectively. They are given as 𝐾ሬ
ሬ
ଵ௫(௬)
= 2𝜋 𝑝⁄௫(௬)
and 𝐾ሬ
ሬ
ଶ௫(௬)
= 2𝜋 𝜏𝑝⁄௬
, where 𝑝௫
and 𝑝௬
represents a pixel pitch in x and y directions, respectively, τ the period ratio of VZFO line pattern to pixel pattern. τ cannot be smaller than 1, because VZFO line period is bigger than the pixel period. In Fig. 1, the crossing angle γ cannot be bigger than 45° because the coordinate is symmetric along the 45° line. If the pixel aspect ratio is η, i.e., η = 𝑝௬
⁄ , 𝐾𝑝௫
ሬ
ሬ
ଵ௫
(௬
)∙ 𝑥⃗(𝑦⃗) and 𝐾ሬ
ሬ
ଶ௫
(௬
)∙ 𝑥⃗(𝑦⃗) are given asቆ
𝐾ሬ
ሬ
ଵ௫
∙ 𝑥⃗ 𝐾ሬ
ሬ
ଵ௬
∙ 𝑦⃗ቇ ቀ
= 𝑘 𝜂 00 1ቁቀ
𝑥 yቁ൬
= 𝜂𝑘𝑥𝑘y൰
𝑛𝑑 𝑎ቆ
𝐾ሬ
ሬ
ଶ௫
∙ 𝑥⃗ 𝐾ሬ
ሬ
ଶ௬
∙ 𝑦⃗ቇ
= 𝜏𝑘 𝑐𝑜𝑠 𝛾൬
𝑠𝑖𝑛 𝛾 −𝑠𝑖𝑛 𝛾 𝑐𝑜𝑠 𝛾൰
𝑥yቁ
ቀ
= 𝜏𝑘 𝑥 𝑐𝑜𝑠 𝛾 + 𝑦 𝑠𝑖𝑛 𝛾൬
−𝑥 𝑠𝑖𝑛 𝛾 + 𝑦 𝑐𝑜𝑠 𝛾൰
, (3-2) Equation 2 requires that 𝑘 =ଶగ
・・ and 0 < η and 0 < τ ≤ 1 . Hence τ is smaller than η . When Eq. (3-2) is
substituted to Eq. (3-1) and then simplifications are done with use of the following relationships
𝑐𝑜𝑠( 𝑎𝑘𝑥 + 𝑏𝑘𝑦) = 𝑐𝑜𝑠{
ඥ
𝑎ଶ
+ 𝑏ଶ
( 𝑎√𝑎
ଶ
+ 𝑏ଶ
𝑘𝑥 + 𝑏√𝑎
ଶ
+ 𝑏ଶ
𝑘𝑦)}= 𝑐𝑜𝑠{ √𝑎
ଶ
+ 𝑏ଶ
(𝑐𝑜𝑠 𝜑 𝑘𝑥 + 𝑠𝑖𝑛 𝜑 𝑘𝑦)}, (3-3) where φ = 𝑡𝑎𝑛◌ିଵ
(𝑏 𝑎⁄ ). 𝑀(𝑥, 𝑦) can be further simplified with use of the following relationships𝑥′= 𝑥 𝑐𝑜𝑠 𝜑 + 𝑦 𝑠𝑖𝑛 𝜑
𝑦′= −𝑥 𝑠𝑖𝑛 𝜑 + 𝑦 𝑐𝑜𝑠 𝜑, (3-4)
with these simplifications, 𝑀(𝑥, 𝑦) can be expressed as (3-5)
𝑀(𝑥, 𝑦) = ∑
ସଵ◌ୀଵ
・
𝑐・ 𝑐𝑜𝑠൫
ඥ
𝑓・(𝜏, 𝛾)𝑘𝑥′(𝑦′)൯
, (3-5)where 𝑓・(𝜏, 𝛾) represents the multiplying factor to 𝑝
௬
, i.e., the pixel period in y direction to define the moiré23
that the moirés appearing at the contact-type 3-D imaging are created by multiple interferences among waves of
different periods and directions. According to Eq. (3-5), the moirés are composed of 41 different wave components
of different directions. Among them, 0, 𝜂
:௫
, 1:௬
, 𝜏:௫
ᇱ
and 𝜏:௬
ᇱ
represent no VZFO case, and fundamental frequency of each direction of the two grids, respectively. Others components are the newly induced periodsresulted from the overlapping. Among these components, 𝜂
ଶ
− 2𝜏𝜂𝑐𝑜𝑠𝛾 + 𝜏ଶ
|௫
ᇱ
has the smallest value of all for small γ angle range. This component is for x direction only and for the two-line pattern case. It fits the best to explain the moirés which are resulted from the beat phenomenon. The maximum moiré fringe period is given as𝑃
௬
⁄(𝜂ଶ
− 2𝜂𝜏𝑐𝑜𝑠𝛾 + 𝜏ଶ
). When γ = 0, it is reduced asඥ
𝑓・(𝜏, 𝛾) = 𝜂 − 𝜏. Hence the moiré fringe period isgiven as 𝑃
௬
⁄(𝜂 − 𝜏) in x direction. This is the conventional formula of calculating the moiré fringe period. Hence the periods of moiré fringes in different directions specified in Eq. (3-5) works only for the static moirésfrom two-line pattern films with no gap material between them. It is actually not much related to the color moirés
in the contact-type 3-D imaging but it can only help to explain that the color moirés in the contact-type 3-D
imaging are formed by moirés with many different periods when the VZFO line pattern is rotated, Eq. (3-5) cannot
explain the color and dynamic behaviors of the moirés in the contact-type 3-D displays. To explain these behaviors,
another method should be devised.
3.3 Color moirés in contact-type 3-D imaging
For the case of the static moirés, the lines in the two-line patterns are either overlapped fully or partly, or filled
the spaces between lines of the patterns. These overlapping and filling create periodical sparse and dense looking
areas. These are the moirés. In contrast to these overlapping and filling, the pixel pattern is simply blocked by the
VZFO line pattern because the pixel pattern is almost continuous with only small gaps between pixels and
sub-pixels. Due to the blocking, some sub-pixels and/ part of a sub-pixel become dark, i.e., invisible or lose its
brightness. So, the color balance of the panel becomes broken by these blockings. Figure 3-2 shows the color
24
Fig. 3-2. Color moirés on a 24-inch multiview display with a lenticular VZFO.
The display has a full HD resolution. The image is covered almost with color moirés but only that in the upper
left and the mid-top area reveal distinguishable color moirés. It is also shown that dark lines representing the
lenticular pattern at the mid-top area. Figure 3-3 shows the color balance changes due to the blockings when the
VZFO including the panel’s cover glass is assumed as a film. When no blocking is done for RGB sub-pixels, the
pixel reveals white color, but each sub-pixel is blocked the same amount, the pixel reveals a silver to various gray
colors. When a part of R, G or B is blocked, the pixel reveals celeste, lavender and conditioner, respectively. When
two of R, G and B are completely and remain is partly blocked, the pixel reveals the partly blocked sub-pixel
color but it becomes darker. So, this color balance changes are the main reason of the moirés. When VZFO is a
film like a parallax barrier and it is overlapped with an air gap with the pixel pattern, the resulted moirés are not
different from that from the two films, except the pattern period changes. By the covering of the pixel pattern with
25
Fig. 3-3. Color balance changes due to blockings of sub-pixels or a part of sub-pixel.
This is shown in Fig. 3-4. Figure 3-4 depicts the gap effect. When the gap is 𝑔・ ・, the viewing distance is 𝑍・ and
the focal length of a viewer’s eye is 𝑓
・・
௬
, then the periods of VZFO line and pixel patterns are changed by the factors 𝑓・・
௬
⁄ and 𝑓𝑍・・ ・
௬
⁄(𝑍・ + 𝑡) [3-17], respectively. When the VZFO has a thickness with a refractive index,the pixel pattern is refracted first to go through the VZFO to be viewed by the viewers.
Fig. 3-4. Optical geometry of depicting Gap-effect.
Silver White Dark Red Yellow Magenta Battleship Gray Aqua Dark Green Dark Blue Conditioner Lavender Celeste
26
It is typical that the lenticular and microlens array have certain thicknesses which correspond to their focal lengths
when they are tightly contact with the cover glass of the panel. For the case of the parallax barrier, the barrier film
is laminated on a glass plate and then contact tightly on the cover glass. When viewers view the displays, the pixel
pattern is viewed through the VZFO. Hence the pixel pattern which is away from the viewers’ position will be
refracted more. This is illustrated in Fig. 3-5. Figure 3-5 depicts the geometry of viewing the pixel pattern through
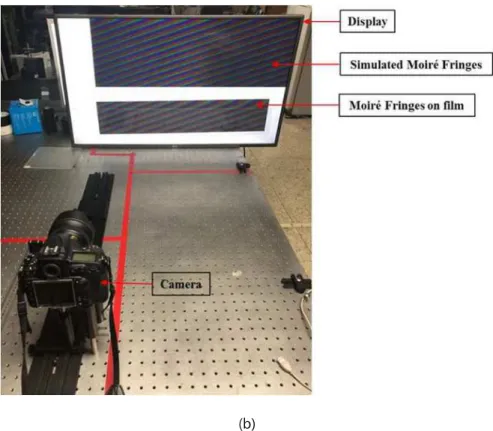
the VZFO and calculating the chirped pixel pattern (Fig. 3-5(a)), and experimental set-up (Fig. 3-5(b))
corresponding to Fig. 3-5(a). The experimental set-up consists of a LCD panel, and VZFO as a film with a periodic
line grating and a camera distanced at the viewing distance. In typical contact-type 3-D imaging, the pixel pattern
is located at the back focal plane of the VZFO. The focal length of the VZFO is defined as sum of both thicknesses
of the VZFO and the cover glass. Hence the refractive index of the VZFO is determined as the arithmetic average
of the refractive indices of VZFO material and the glass weighted by their thicknesses.
(a) Eye ( )n
( )
n
( )
rn
( )n( )
n
Panel’s RGB Pattern plane
VZFO Line Pattern (Pattern plane)
VZFO Material
( )
r
n
Normal Line of the Panel
Right Side Left Side
P
P
PO
( )
PP n
PnP
(
n
1)
P
Pt
A A´ B B´ C27 (b)
Fig. 3-5. Optical geometry of viewing the pixel pattern through the VZFO and calculating the chirped pixel pattern(a), The experimental set-up(b).
In Fig. 3-5, when a viewer at the viewing distance 𝑍・ along the normal line of the panel aligns his/her eye to the
center of the panel, C, the 𝑛
௧
・
pixel from C, which is specified by BB´ will be translated to AA´ at the pattern plane of the VZFO due to the refraction. AA´ becomes slightly shorter than BB´. Hence the panel’s pixel patternis chirped as shown in the bottom side of Fig. 3-5. Let the period of VZFO line pattern and pixel period are 𝑂・
and 𝑃・, respectively, the length of AA´ as 𝑃・(𝑛), θ(𝑛)
൫
𝜃・(𝑛)൯
and θ(𝑛 − 1)൫
𝜃・(𝑛 − 1)൯
as the viewing angle(refraction angle) of seeing 𝑛
௧
・
and (𝑛 − 1)௧
・
pixels, respectively and t the VZFO thickness including the glass, 𝑃・(𝑛),is given as [3-4]𝑃・(𝑛) = 𝑃・ − 𝑡(𝑡𝑎𝑛 𝜃・(𝑛) − 𝑡𝑎𝑛 𝜃・(𝑛 − 1))
𝜃・(𝑛) = 𝑠𝑖𝑛
◌ିଵ
(𝑚1𝑠𝑖𝑛 𝜃 (𝑛))𝜃・(𝑛 − 1) = 𝑠𝑖𝑛
◌ିଵ
(・ଵ
𝑠𝑖𝑛 𝜃 (𝑛 − 1)), (3-6)28
the pixel size is very small compared with the distance 𝑍・, as the viewing angle θ(𝑛) increases, the difference
between θ(𝑛) and θ(𝑛 − 1) becomes smaller, 𝑃・(𝑛) closes to 𝑃・ . Hence the chirping is more for smaller
viewing angles but less as the viewing angle increases. The virtual decrease in the panel’s pixel pattern is just
given as t tan 𝜃・(𝑛) , i.e., t tan sin
◌ିଵ
൫
(1 𝑚⁄ ) sin 𝜃(𝑛)൯
. So, the chirping amount depends on the VZFOthickness and the viewing angle. Since t can be several millimeters for large size 3-D TV and each pixel is much smaller than t, but the chirping amount is still too small for the panel size. Hence it is difficult to view the chirping effect with a small size panel. The chirping effect is more visible as the viewing angle and the moiré fringe period
increase. This is shown in Fig. 3-6. Fig. 3-6 is obtained by moiré simulation. The chirping effect is more visible
as the viewing angle increases, i.e., the viewing distance decreases and/or the fringe period increases.
Fig. 3-6. Examples of chirped moirés.
To show the chirping effect more clearly, the moiré fringe periods are specified by the waves on the top of each
moiré. The chirping effect is very visible when 𝑂・ and 𝑃・ are the same. This is shown in Fig. 3-7. Figure 3-7 is
color strips of a simulated color moirés when both 𝑂・ and 𝑃・ are 0.4833 mm, t =0.68 mm and m =1.5412
for the three 𝑍・ values of 500 mm, 1 m and 2 m. The accuracy of this simulation is demonstrated by experiments
[3-17]. The color patterns in the central areas of the color strips in Fig. 3-7 for the three viewing distances are the
same. Since the viewing angle becomes bigger as the distance decreases, the area of the color pattern becomes
wider as the distance increases. As the panel size increases, i.e., the viewing angle increases, the color changing
rate of the moirés will be very low because of very small variations in 𝑃・(𝑛) values. There will be almost no
29
Fig. 3-7. Chirped moirés when the periods of pixel and VZFO line patterns are the same.
3.4 A formula for the moiré fringe periods
As mentioned before, the moiré fringe period 𝑃・ (𝑥) is expressed as [3-12]
𝑃・ (𝑥) = [𝑐𝑜𝑠{ 𝜋( ・
◌ು◌ೣ
(௫)
・
◌ು
−௫
・
ଷை◌
◌ು
)}]ଶ
, (3-7) Where 𝑃・
௫
(𝑥) is the fitting function of 𝑃・(𝑛), x is the distance from C in Fig. 3-3 and A is given as𝐴 = 𝑘 when 0 ≤ 𝑅 ≤ 𝑆・/2
𝐴 = 𝑘 + 1 when 𝑆・/2 ≤ 𝑅 < 𝑆・
𝑘 = [𝑂・/𝑆・] and 𝑂・ = 𝑘𝑆・+ 𝑅 (0 ≤ 𝑅 < 𝑆・), (3-8)
In Eq. (3-8), k is the integer value from 𝑂・⁄ , where 𝑆𝑆・ ・ is the sub-pixel period and R is the remains from
𝑂・⁄ . Eq. (3-8) is the factor which make difference between the conventional (𝜂 − 𝜏)𝑃𝑆・ ・ and the color moirés
formulas for the moiré fringe period. With the Eq. (3-8), Eq. (3-7) becomes the same as Eq. (1) for γ = 0 case. With use of Eqs. (3-7) and (3-8), the 𝑃・ (𝑛) for the case of a parallax barrier with 𝑂・ =1.4509 mm and barrier
width of 0.2415 mm is shown in Fig. 8 for two viewing distances of 500 mm and 1 m. Simulation and film mean
that the moirés are simulated and experimentally obtained with the parallax barrier film, respectively. The color patterns of both simulated and experimentally obtained moirés match very well to each other.
30
Fig. 3-8. Moirés fringe periods: Film and simulated moirés have the same fringe periods.
The moiré fringe periods are given as the waves in Fig. 3-8. For the case of Fig. 3-7, i.e., 𝑂・ = 𝑃・ case, the fringe
period can also be calculated with Eq. (3-7). This is shown in Fig. 3-9 for only near the central part of the moirés
at the 0.5 m and 1 m viewing distances in Fig. 3-7.
Fig. 3-9. Fringe periods of the chirped moirés in Fig. 3-7
3.5 Moiré characteristic for different VZFO
The color moirés in the contact type 3-D imaging has somewhat different characteristics for different VZFOs. As
mentioned in section 3, the color moirés are the results of the pixel pattern blocking by the VZFO line pattern.
The blocking will be more as the line thickness increases. In the lenticular, the line pattern is formed by the
boundary lines between lenslets. The thicknesses of these boundary lines are not known but it is assumed that it
31
two-dimensional [3-19]. For the case of parallax barriers, it forms a grating pattern but the thickness of barrier
lines is more than the grating lines. In the parallax barrier, the image will be sharper as the slit width decreases
but in practice, the barrier thickness is around 2/3 to 3/4 of the line period to keep the image brightness to a certain
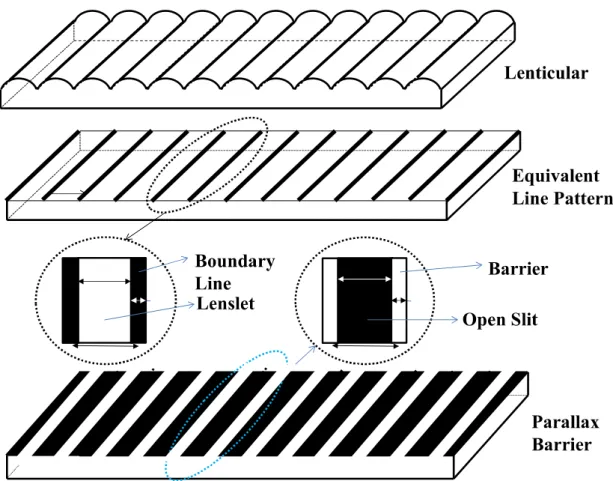
level. Fig. 3-10 shows the comparison between the equivalent geometrical patterns of lenticular and parallax
barrier. The geometrical patterns are conjugate to each other. By these reasons, it can be said that the color moirés
in lenticular is caused by the boundary lines but for the parallax barrier by the open slits, i.e., the gap between two
barrier lines. Hence the equivalent line patterns of the lenticular and the parallax barrier are complementary to
each other.
Fig. 3-10. Comparison between equivalent geometrical patterns of lenticular and parallax barrier.
Since the boundary line thickness in the lenticular can be less than 0.1 of the line period, the blockings by the lines
do not cause too much color changes. As the result, the moiré contrast becomes very small compared with the
displayed image. Hence the presence of the color moirés can be hardly identified. For the case of the parallax
Lenticular
Equivalent
Line Pattern
Boundary
Line
Lenslet
Barrier
Open Slit
Parallax
Barrier
32
barrier, since the displayed image is mostly covered by the barrier lines and the image is seen through the open
slits, the moiré is very visible. This is shown in Fig. 3-10. Figure 3-10 compares the line thickness effect on the
moiré contrasts for the case of 𝑂・ = 3.4 mm. For this comparison, six-line thicknesses of 0.0805 mm, 0.1611
mm, 0.3222 mm, 3.3195 mm, 3.2389 mm and 3.0778 mm are used, and both simulated and experimentally
obtained moirés with the film are also given. There are no differences between the simulation and the experiment.
The first three-line thicknesses are complementary to the last three in their currently order because the sum of
each complementary thickness corresponds to 3.4 mm. So, the first three thicknesses are for the lenticular and the
last three for the parallax barrier. The image is displayed at 42-inch LCD monitor having full HD pixel resolution,
i.e., 1920 × 1080 and pixel size of 0.4833 mm. For the first three-line thicknesses, the image does not look affected by the moirés, except the line pattern for 0.3222 μm case. This is obvious because the line thickness is smaller than a pixel pitch. Most of the image is viewed with no color change through the open slits. However, for
the last three, the moirés are more visible than the image. The image brightness is reduced further as the lint
thickness increases and it looks that the moirés are modulated by the image due to very small open slit sizes which
are smaller than a pixel pitch. When the open slit size is bigger than a pixel, a part of the image will be viewed
without any color change through each open slit.
3.6 Moiré reductions methods
As mentioned in introduction, there are two known methods of reducing moirés in the contact-type 3-D imaging:
One is aligning the line direction of VZFO’s line pattern to have a certain angle with the vertical or horizontal)
pixel lines and the other inserting a diffuser between VZFO and the cover glass of the pixel. The former method
is effective in reducing visibly the moirés but it will reduce the active pixels along the slanted VZFO line pattern
and increase crosstalk [3-18]. The color moirés seen at 0.5 m from the panel at the aligning angle range of 0° to
19° in 3° interval for both lenticular and parallax barrier are shown in Fig. 3-11. Figure 3-11 is obtained
experimentally. It clearly shows that the color moirés look disappearing as the angle increases, this is true because
33
Fig. 3-11. Comparisons of moirés for different line thickness.
For the 0° case, each open slit (boundary line) opens(blocks) only the same column pixels or sub-pixels because
the typical LCD panel consists of a repeated array of RGB sub-pixel columns. Hence as the angle increases, they
open(blocks) more neighboring columns. As the consequence, the same color length is reduced to smaller than a
pixel height, i.e., when a boundary or barrier line passes a sub-pixel pitch within a pixel height. This can happen
when the angle is greater than 18.44° (𝑡𝑎𝑛
◌ିଵ
( 1/3)). The RGB colors become closer as the angle increases and they can be easily combined as a white or a gray. This is why the color between barrier lines and along theboundary lines looks gray in the parallax barrier and almost invisible in the lenticular. For the case of the lenticular,
the width of an elemental lens is much wider than a boundary line thickness, the gray pixels along the boundary
lines are hardly identifiable. The moiré contrast is very low compared with the background. Hence the image
looks having the same color as shown in Fig. 3-12. This is why it is difficult to trace color moiré components in
the images in the left side of Fig. 3-11. Fig. 3-12 informs that if the boundary line thickness can be made very
small or eliminated in the lenticular and microlens array, the moirés can be made almost invisible or eliminated.