• 検索結果がありません。

Measurement of X-ray-tube voltage using filtrated spectra

N/A
N/A
Protected

Academic year: 2021

シェア "Measurement of X-ray-tube voltage using filtrated spectra"

Copied!
4
0
0

読み込み中.... (全文を見る)

全文

(1)

7

− 1 −

Measurement of X-ray-tube voltage using filtrated spectra

Eiichi SATO

a

, Yasuyuki ODA

a

, Michiaki SAGAE

a

, Satoshi YAMAGUCHI

b

, Yuichi SATO

c

, Osahiko HAGIWARA

d

, Hiroshi MATSUKIYO

d

, Toshiyuki ENOMOTO

d

,

Manabu WATANABE

d

and Shinya KUSACHI

d

a

Department of Physics, Iwate Medical University, 2-1-1 Nishitokuta, Yahaba, Iwate 028-3694, Japan

b

Department of Radiology, School of Medicine, Iwate Medical University, 19-1 Uchimaru, Morioka, Iwate 020-0023, Japan

c

Central Radiation Department, Iwate Medical University Hospital, 19-1 Uchimaru, Morioka, Iwate 020-0023, Japan

d

Department of Surgery, Toho University Ohashi Medical Center, 2-17-6 Ohashi, Meguro-ku, Tokyo 153-8515, Japan

(Accepted July 14, 2016)

Abstract

To measure tube voltage using a readily available cadmium telluride (CdTe) detector, we performed fundamental experiments for measuring maximum photon energy of X-ray spectra using copper (Cu) filters. The X-ray photons are produced by an X-ray tube, and the penetrating photons through a Cu filter are detected using the CdTe detector without pileups of the event signals. The filter is used to decrease the photon count rate, and we used three Cu filters of 1.0, 2.0 and 5.0 mm in thickness to measure the tube voltages of 50, 75 and 100 kV, respectively, at a constant tube current of 1.0 mA. In the thick-filtrated spectra, the maximum photon energies corresponded well to the tube voltages.

Keywords : X-ray tube voltage, X-ray spectra, maximum energy, CdTe detector, Cu filtration 1. Introduction

 Currently, X-ray spectra are measured using a cadmium telluride (CdTe) detector with an energy resolution of approximately 1% at 122 keV, and a CdTe detector has been applied to several photon-counting energy-dispersive computed tomography (ED-CT) [1-4] including enhanced K-edge CT using iodine and gadolinium contrast media.

 The CdTe detector is also useful for measuring X-ray dose and can be applied to measure tube voltage by measuring the spectra; the tube voltage corresponds to the maximum photon energy. To measure X-ray spectra using the CdTe detector, the dose rate should be reduced because the energy resolution falls with increasing dose rate owing to the event-pulse pileups. In this regard, the dose rate in proportion to the count rate is reduced easily by the filtration.

 In our research, our major objectives are as follows: to measure filtrated spectra using a readymade CdTe detector, to determine optimal filter thickness, and to determine the tube voltage without pileups of the event pulses. Therefore, we constructed an experimental setup to measure tube voltage using the CdTe detector in conjunction with a copper (Cu) filter.

Annual Report of Iwate Medical University

Center for Liberal Arts and Sciences

No. 51(2016) , 7-10.

(2)

8 Eiichi SATO, et al.

− 2 −

Fig. 1. Block diagram for measuring the maximum photon energy of X-ray spectra using a Cu filter. The maximum energy corresponds to the tube voltage, and the filter is used to reduce the photon count rate.

Fig. 2. X-ray dose rate with changes in the tube voltage at a constant tube current of 1.0 mA.

2. Experimental methods

 Figure 1 shows a block diagram for measuring X-ray spectra using a Cu filter. Penetrating X-ray photons through the Cu filter are detected using a CdTe detector (XR-100T Amptek), and the electric charges generated in the CdTe are converted into voltages and amplified using charge-sensitive and shaping amplifiers. The event pulses from the shaping amplifier are input to a multichannel analyzer (MCA) to measure X-ray spectra, and the spectra are observed on the monitor of personal computer (PC). The filter thickness is selected to regulate the photon count rate and is less than 5.0 mm.

 The measurement of X-ray dose rate is important to calculate the incident dose. The X-ray dose rate from an X-ray generator was measured using an ionization chamber (Toyo Medic RAMTEC 1000 plus) at a tube current of 1.0 mA without filtration. The chamber was placed 1.0 m from the X-ray source, and we measured the dose rate with changes in the tube voltage from 40 to 109 kV.

X-ray source

1.0 m Charge-sensitive

amplifier

Copper filter

RS232C BNC cable X-rays

Multichannel analyzer PC

CdTe

Shaping amplifier

MCA

Tube current=1.0 mA

(3)

9 Measurement of X-ray-tube voltage using filtrated spectra

− 3 − Fig. 3. Standard X-ray spectra without filtration with

changes in the tube voltage at a tube current of 5.0 μA.

3. Results

 Figure 2 shows the X-ray dose rate at a constant tube current of 1.0 mA. X-ray dose rate increased with increasing tube voltage. At a tube voltage of 100 kV, the X-ray dose rate was 106 μGy/s.

 The standard X-ray spectra were measured for reference (Fig. 3). Both the maximum photon energy and the bremsstrahlung peak-count energy increased with increasing tube voltage. At a tube voltage of 100 kV, we observed tungsten (W) K-photons, and the maximum energy corresponded to the tube voltage.

 Figure 4 shows the Cu-filtrated X-ray spectra at a constant tube current of 1.0 mA and an exposure time of 10 s, and the filter thicknesses are 1.0, 2.0 and 5.0 mm corresponding to the tube voltages of 50, 75 and 100 kV, respectively. The maximum photon energies were equal to those of standard spectra, and the energies were slightly higher than those of the tube voltages.

Fig. 5. Mass attenuation coefficients of Cu with photon energies beyond the Cu-K-edge energy.

V=100 kV

V=75 kV V=50 kV

V: Tube voltage

V=100 kV Cu=5 mm V=75 kV

Cu=2 mm

V=50 kV Cu=1 mm V: Tube voltage Cu: Cu-filter thickness

Fig. 4. Filtrated X-ray spectra with changes in the tube

voltage using Cu filters at a tube current of 1.0 mA.

(4)

10 Eiichi SATO, et al.

− 4 −

4. Discussion

 Figure 5 shows the mass attenuation coefficients of Cu beyond the K-edge energy of 8.98 keV. The attenuation coefficient substantially decreases with increasing photon energy, and the Cu filter thickness increases from 1.0 to 5.0 mm with increasing tube voltage. Since the count rate increases with increasing tube voltage and current, the optimal count rate without event-pulse pileups should be selected. In particular, a W filter may be useful for measuring the maximum photon energy beyond 100 keV.

 Compared with the tube voltages selected using an X-ray controller, the tube voltages corresponding to the maximum photon energies were slightly high. In this experiment, although one-point calibration using W Kα

1

photons was used, two-point calibration may be useful for determining the energy.

5. Conclusions

 We measured the spectra using Cu filters for reducing the photon count rate, and the maximum photon energies corresponded to the tube voltages. For this research, the Cu filter thickness should be selected corresponding to the tube voltage, and the Cu-filter thicknesses were 1.0, 2.0 and 5.0 mm at tube voltages of 50, 75 and 100 kV, respectively.

Acknowledgments

 This work was supported by Grants from Keiryo Research Foundation, Promotion and Mutual Aid Corporation for Private Schools of Japan (PMAC), Japan Science and Technology Agency (JST), and Japan Society for the Promotion of Science (JSPS) KAKENHI (26461804, 2014-2016). This was also supported by a Grant-in-Aid for Strategic Medical Science Research (S1491001, 2014–2018) from the Ministry of Education, Culture, Sports, Science and Technology of Japan (MEXT).

References

[1]  Matsukiyo, H., Sato, E., Hagiwara, O., Abudurexiti, A., Osawa, A., Enomoto, T., Watanabe, M., Nagao, J., Sato, S., Ogawa, A. and Onagawa, J., “Application of an oscillation-type linear cadmium telluride detector to enhanced gadolinium K-edge computed tomography,” Nucl. Instr. Meth. A 632, 142-146 (2011).

[2]  Sato, E., Oda, Y., Abudurexiti, A., Hagiwara, O., Matsukiyo, H., Osawa, A., Enomoto, T., Watanabe, M., Kusachi, S., Sato, S., Ogawa, A. and Onagawa, J., “Demonstration of enhanced iodine K-edge imaging using an energy- dispersive X-ray computed tomography system with a 25 mm/s-scan linear cadmium telluride detector and a single comparator,” Appl. Rad. Isot. 70, 831–836 (2012).

[3]  Chiba, H., Sato, Y., Sato, E., Maeda, T., Matsushita, R., Yanbe, Y., Hagiwara, O., Matsukiyo, H., Osawa, A., Enomoto, T., Watanabe, M., Kusachi, S., Sato, S., Ogawa, A. and Onagawa, J., “Investigation of energy-dispersive X-ray computed tomography system with CdTe scan detector and comparing-differentiator and its application to gadolinium K-edge imaging,” Jpn. J. Appl. Phys. 51, 102402-1-5 (2012).

[4]  Hagiwara, O., Sato, E., Watanabe, M., Sato, Y., Oda, Y., Matsukiyo, H., Osawa, A., Enomoto, T., Kusachi, S.

and Ehara, S., “Investigation of dual-energy X-ray photon counting using a cadmium telluride detector and two

comparators and its application to photon-count energy subtraction,” Jpn. J. Appl. Phys. 53, 102202-1-6 (2014).

Fig. 2. X-ray dose rate with changes in the tube voltage at a constant tube current of 1.0 mA.
Fig. 5. Mass attenuation coefficients of Cu with photon energies beyond the Cu-K-edge energy.

参照

関連したドキュメント

Our purpose in this study was to determine the optimum scattered X-ray elimination grid for a direct-conversion FPD system with a-Se, by digitally measuring the scatter

We intend to find the condition of the plasma in order to account for the observed flux ratio ( F RRC /F line ), which is free from specific modeling with iron abundance, the

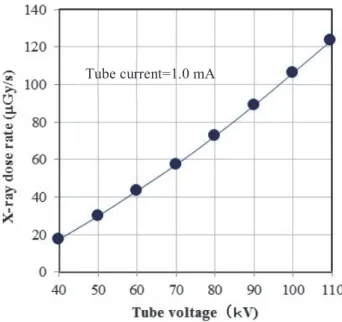
Whereas tube voltages and HVLs for these four X-ray units did not significantly change over the 103-week course, the outputs of these four X-ray units increased gradually as

In this study, we performed animal experiments using nude mice with lung cancer xenografts for the following purposes: to reconfirm that commercially available ferucarbotran

In the present study, we evaluated the effectiveness of static/nonfreezing hypothermic preservation of rat hearts in a preservative solution with added AFGP based on our

We used this software package to estimate percentage dose reduction values of the average organ dose (indicated as 'Average dose in total body' in PCXMC) and effective dose for

The general method of measuring the half-value layer (HVL) for X-ray computed tomography (CT) using square aluminum-sheet filters is inconvenient in that the X-ray tube has to be

In this study, X-ray stress measurement of aluminum alloy A2017 using the Fourier analysis proposed by Miyazaki et al.. was carried