- 41 -
胎児期有機フッ素化合物(PFASs)曝露の臍帯血 DNA 網羅的エピゲノム解析 An epigenome-wide study of cord blood DNA methylations in relation to prenatal
perfluoroalkyl substance exposure
研究代表者 岸 玲子 北海道大学環境健康科学研究教育センター 特別招へい教授 研究分担者 三浦 りゅう 北海道大学環境健康科学研究教育センター 特任助教
研究分担者 荒木 敦子 北海道大学環境健康科学研究教育センター 特任准教授 研究分担者 宮下 ちひろ 北海道大学環境健康科学研究教育センター 特任准教授 研究分担者 伊藤 佐智子 北海道大学環境健康科学研究教育センター 特任講師 研究分担者 山﨑 圭子 北海道大学環境健康科学研究教育センター 特任講師 研究分担者 松浦 英幸 北海道大学大学院農学研究院 教授 研究分担者 篠原 信雄 北海道大学大学院医学研究院 教授
研究要旨
Background: Prenatal exposure to perfluoroalkyl substances (PFASs) influences fetal development and later in life.
Objective: To investigate cord blood DNA methylation changes associated with prenatal exposure to PFASs.
Methods: We assessed DNA methylation in cord blood samples from 190 mother-child pairs from the Sapporo cohort of the Hokkaido Study (discovery cohort) and from 37 mother-child pairs from the Taiwan Maternal and Infant Cohort Study (replication cohort) using the Illumina HumanMethylation 450 BeadChip. We examined the associations between methylation and PFAS levels in maternal serum using robust linear regression models and identified differentially
methylated positions (DMPs) and regions (DMRs).
Results: We found four DMPs with a false discovery rate below 0.05 in the discovery cohort.
Among the top 20 DMPs ranked by the lowest P-values for perfluorooctane sulfonate (PFOS) and perfluorooctanoic acid (PFOA) exposure, four DMPs showed the same direction of effect and P-value < 0.05 in the replication assay: cg16242615 mapped to ZBTB7A , cg21876869 located in the intergenic region (IGR) of USP2-AS1, cg00173435 mapped to TCP11L2, and cg18901140 located in the IGR of NTN1. For DMRs, we found a region associated with PFOA exposure with family-wise error rate < 0.1 located in ZFP57, showing the same direction of effect in the
replication cohort. Among the top five DMRs ranked by the lowest P-values that were associated with exposure to PFOS and PFOA, in addition to ZFP57, DMRs in the CYP2E1, SMAD3,
SLC17A9, GFPT2, DUSP22, and TCERG1L genes showed the same direction of effect in the replication cohort.
Conclusion: We suggest that prenatal exposure to PFASs may affect DNA methylation status at
birth. Longitudinal studies are needed to examine whether methylation changes observed are
associated with differential health outcomes.
- 42 -
A.研究目的
Perfluoroalkyl substances (PFASs) are synthetic compounds ubiquitously distributed in the environment that can disrupt endocrine system functions (Lau et al. 2007). PFASs have long half-lives in human: 5.4 years for perfluorooctane sulfonate (PFOS) and 3.8 years for perfluorooctanoic acid (PFOA) (Olsen et al. 2007). Furthermore, PFASs can pass through the placental barrier (Inoue et al.
2004). Consequently, fetuses can be exposed to PFASs via maternal circulation, which suggests a possibility of PFAS negative effects on embryonic and fetal development.
Epidemiological studies have shown that prenatal exposure to PFASs has been associated with various health outcomes, including birth size reduction, disruption of
hormone balance, obesity,
neurodevelopmental problems, and immune function impairment (Apelberg et al. 2007;
Chen et al. 2013; Grandjean et al. 2012;
Halldorsson et al. 2012; Kishi et al. 2017;
Olsen et al. 2009). However, the mechanisms underlying these associations are not clear.
One hypothesis is that prenatal exposure to PFASs might lead to health outcomes in the offspring through epigenetic alterations in utero because epigenetics (i.e., chemical modification of DNA) is an intrinsic biological
mechanism that can be affected by extrinsic environmental factors in humans.
DNA methylation is an epigenetic modification that plays a role in embryonic development and cellular differentiation (Breton et al. 2017). It occurs by the addition of a methyl group to a cytosine mostly at cytosine-guanine dinucleotide (CpG) loci and acts like a gene expression switch (Hackett and Surani 2013). Human epidemiological studies, including genome-wide approaches, have indicated that environmental factors such as diet, hormones, stress, drugs, or toxicants (e.g., lead, mercury, or tobacco smoke) during prenatal development influence DNA methylation patterns in children (Breton et al.
2017). Despite a significant impact of PFASs on health outcomes, there were few epidemiological studies of epigenetic effects of PFAS exposure in utero. Guerrero-Preston et al.
(2010) observed that cord blood PFOA concentrations negatively correlated with cord serum global DNA methylation levels. We also reported that prenatal PFOA exposure was associated with reduced IGF2 methylation in cord blood, which could predict infant ponderal index at birth (Kobayashi et al. 2017).
Genome-wide methylation analyses allow a hypothesis-free assessment of epigenetic alterations in relation to the environmental factors (Christensen and Marsit 2011). To our knowledge, only one study showed an association between maternal PFOA levels and genome-wide DNA methylation using 44 cord blood samples (Kingsley et al. 2017). The objective of the present study was to investigate cord blood DNA methylation changes in association with prenatal exposure
研究協力者
湊屋 街子(北海道大学大学院保健科学研究院,
特任講師),
アイツバマイ ゆふ(北海道大学環境健康科学研 究教育センター,特任講師),
田村 菜穂美(情報・システム研究機構統計数理 研究所医療健康データ科学研究センター,特任助 教)
- 43 -
to PFASs using the genome-wide approach and to determine CpG loci epigenetically vulnerable to prenatal PFAS exposure.
B.研究方法
450K DNA methylation analysis. We assessed DNA methylation in cord blood samples from 190 mother-child pairs from the Sapporo cohort of the Hokkaido Study (discovery cohort) and from 37 mother-child pairs from the Taiwan Maternal and Infant Cohort Study (replication cohort) using the Illumina HumanMethylation 450 BeadChip. After quality control (Aryee et al. 2014), signal intensities were normalized using functional normalization (Fortin et al. 2014). We applied the ComBat method to adjust methylation data for sample plate to reduce a potential bias due to batch effects (Leek et al. 2012). Beta-values were calculated from signal intensities and used for the subsequent data analyses by using the following equation (Bibikova et al. 2011):
= methylated / (methylated + unmethylated + 100).
Exposure assessment. PFOS and PFOA levels were measured in maternal serum by using column-switching liquid chromatography- tandem mass spectrometry (LC-MS/MS) as previously described (Lien et al. 2011; Okada et al. 2012; Washino et al. 2009).
Data analysis. Cord blood cell proportion was estimated by the method implemented in the R/Bioconductor package minfi (Bakulski et al.
2016). Using limma package in R, robust linear regression analyses (Fox and Weisberg 2011) and empirical Bayesian methods (Smyth 2004) were applied to determine the associations of
-value at each CpG site with either PFOS or
PFOA log
10-transformed concentration, adjusted for maternal age, parity, maternal educational levels, maternal blood sampling period, maternal pre-pregnancy BMI, maternal smoking during pregnancy, gestational age, infant sex, and cord blood cell estimates. Due to the small sample size of the replication cohort, we used only maternal age, infant sex, and cord blood cell estimates as covariates. For multiple comparisons, P-values were adjusted by the false discovery rate (FDR) to obtain q- values. Successful replication for differentially methylated positions (DMPs) was defined as having the same direction of effect with those observed in the discovery cohort and P-value
< 0.05. We also identified differentially methylated regions (DMRs) associated with PFAS exposures using bumphunter function in R/Bioconductor (Jaffe et al, 2012) and the same models as those in the linear regression analyses. P-values were adjusted by the family-wise error rate (FWER). Statistical analyses were performed using minfi, sva, and limma packages in R ver. 3.3.2 and Bioconductor ver. 3.3.
Gene ontology analysis. We identified the enrichment of genes corresponding to the DMPs with P-value < 0.001 in Kyoto Encyclopedia Genes and Genomes (KEGG) pathways (Kanehisa et al. 2002) using missMethyl package in R/Bioconductor (Phipson et al. 2016)
(倫理面への配慮)
The study was conducted with the informed
consent of all subjects in the written form. The
institutional Ethical Board for human gene and
genome studies at the Hokkaido University
- 44 -
Graduate School of Medicine and the Hokkaido University Center for Environmental and Health Science approved the study protocol. The Human Ethics Committee of the National Health Research Committee of Taiwan approved the study of the replication cohort.
C.研究結果
Epigenome-wide association study in the discovery cohort. Maternal and infant characteristics and their relationship to PFOS and PFOA concentrations are described in Table 1. Median (25
thto 75
thpercentiles) of PFOS and PFOA concentrations in maternal blood were 5.2 ng/mL (3.8 to 7.1) and 1.4 ng/mL (0.9 to 2.1), respectively. The average (± SD) age of the mothers was 29.7 ± 4.8 years.
Of the 190 newborns, 84 (44.2%) were male.
We observed statistically significant differences in both PFOS and PFOA levels by parity, maternal blood sampling periods, and smoking during pregnancy. Additionally, PFOA level was significantly higher among mothers with male infants, and PFOS levels were marginally affected by the educational level.
Figure 1 shows the results of genome-wide analyses of the association between cord blood DNA methylation and prenatal PFOS (Figure 1A) or PFOA (Figure 1B) exposure. The volcano plots (Figure 1) showed imbalance in positive versus negative methylation changes, suggesting global methylation shifts due to PFAS exposure.
Differentially methylated positions (DMPs).
We found epigenome-wide significant associations (FDR q-value < 0.05) between
PFOS exposure and DNA methylation for two CpGs: one located in the intergenic region (IGR) of CXADRP3 (cg02044327), and another mapped to SNAPIN (cg25705526). In addition, significant associations between PFOA exposure and DNA methylation for another two CpGs were found: one located in the IGR of AC002480.3 (cg11260715), and another mapped to GPR126 (cg04461802).
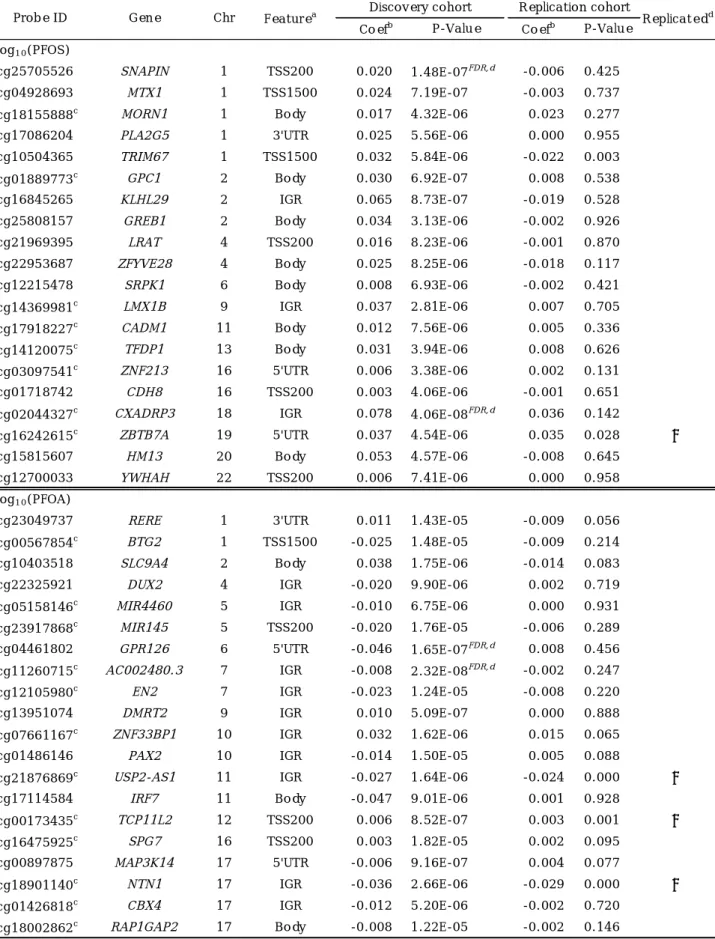
Top 20 DMPs ranked by the lowest P-value for the association with exposure to PFOS and PFOA are shown in Table 2. Among them, four DMPs met the criteria for replication that showed the same direction of effect and P- value < 0.05 in the replication assay:
cg16242615 mapped to ZBTB7A for PFOS;
cg21876869 located in the IGR of USP2-AS1, cg00173435 mapped to TCP11L2, and cg18901140 located in the IGR of NTN1 for PFOA.
Differentially methylated regions (DMRs).
Next, we assessed DMRs associated with
prenatal PFAS exposures using bumphunter
function (Jaffe et al, 2012). We found one
region associated with PFOA exposure with
FWER < 0.1 that was located in the IGR of
ZFP57 and included 21 CpGs. We showed top
five regions for PFOS and PFOA exposures
ranked by the smallest P-value (Table 3). We
also compared the direction of methylation
changes in the discovery and replication
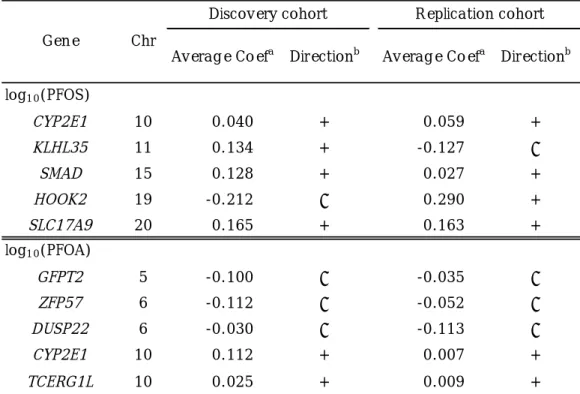
cohorts (Table 4), in which we averaged
methylation levels of each site because those
were highly correlated (data not shown). A
DMR in CYP1E2 was observed for both PFOS
and PFOA exposures. Eight of the ten regions
showed the same direction of methylation
changes in the replication cohort.
- 45 -
Gene ontology analysis. Lastly, we tested for the enrichment of KEGG pathways (Kanehisa et al. 2002) among the genes with annotated CpGs showing P-value < 0.001. Among the 323 pathways analyzed, 31 and 26 KEGG pathways were significantly enriched after Bonferroni correction among the genes affected by for PFOS and PFOA exposures, respectively. Gene Ontology analyses of the data obtained using 450K chip are known to be biased for cancer-related genes (Haper et al.
2013). Human disease pathways, including cancer, were therefore excluded from the list of the pathways affected by PFAS exposures (Figure 2). Enrichments in the pathways involved in signal transduction and signal molecules and interactions were observed among the genes affected by both PFOS and PFOA exposures
D.考察
Few studies have focused on the epigenetic effects of prenatal exposure to PFASs. In this study, median concentrations of PFOS and PFOA were 5.2 and 1.4 ng/mL, respectively, which were lower than those reported in the United States (PFOS: 8.2, PFOA: 2.9 ng/mL) (Stein et al. 2012), Canada (PFOS: 16.6, PFOA: 2.1 ng/mL) (Monroy et al. 2008), Denmark (PFOS: 21.5, PFOA: 3.7 ng/mL) (Huang et al. 2012), Norway (PFOS: 13, PFOA: 2.2 ng/mL) (Starling et al. 2014), South Korea (PFOS: 9.3, PFOA: 2.6 ng/mL) (Lee et al. 2013), and China (PFOS: 6.7, PFOA: 4 ng/mL) (Jiang et al. 2014). Despite the low levels of exposure, we showed suggestive evidence for the presence of CpGs epigenetically vulnerable to PFAS exposure in
utero.
We observed potential global methylation shifts resulting from prenatal PFAS exposure (see volcano plots in Figure 1): up-methylation for PFOS exposure and down-methylation for PFOA exposure. This was consistent with previous reports for prenatal PFOA exposure (Guerrero-Preston et al. 2010; Kingsley et al.
2017). Two studies in adult populations have suggested a possibility of PFAS exposure effect on global methylation (Leter et al. 2014;
Watkins et al. 2014).
We then focused on the changes at specific regions and found four DMPs with FDR <
0.05: cg02044327 (CXADRP3), cg25705526 (SNAPIN), cg11260715 (AC002480.3), and cg04461802 (GPR126) (Figure 1), although these DMPs did not meet the criteria for replication (Table 2). Among 20 DMPs with lowest P-values for PFOS and PFOA exposures (Table 2), four DMPs were replicated: cg16242615 (ZBTB7A ), cg21876869 (USP2-AS1), cg00173435 (TCP11L2), and cg18901140 (NTN1).
ZBTB7A (Zinc finger and BTB domain containing 7A) encodes a proto-oncogenic transcription factor that interacts directly with MBD3 (methyl-CpG-binding domain protein 3) in the nucleus (Choi et al. 2013). TCP11L2 (T-Complex 11 Like 2) codes for the TCP11 like protein. TCP11 plays a role in the process of sperm capacitation and acrosome reactions.
USP2-AS1 (USP2 Antisense RNA 1) belongs to the non-coding RNAs. Netrin 1 (NTN1) is a secreted laminin-like protein identified as an axon guidance molecule.
Next, we explored DMRs that are
potentially more informative than individual
- 46 -
CpG sites (Solomon et al. 2017). We found one down-methylated region with FWER < 0.1, which was located in the IGR of ZFP57 (ZFP57 Zinc Finger Protein) (Table 4). ZFP57 is necessary for maintaining repressive epigenetic modifications at imprinting control regions (Riso et al. 2016). We observed down- methylation of this region in the replication cohort (Table 4). In addition to a DMR in ZFP57, we reported six DMRs in CYP2E1, SMAD3, SLC17A9, GFPT2, DUSP22, and TCERG1L that showed the same direction of methylation change in the replication cohort (Table 4). Among them, methylation of SMAD3 (SMAD Family Member 3) at birth has been previously linked to asthma in children of asthmatic mothers (DeVries et al.
2016). Cord blood DNA methylation of GFPT2 (Glutamine-Fructose-6-Phosphate Transaminase 2) was associated with adiposity in childhood (Kresovich et al. 2017).
Furthermore, methylations of CYP2E1 (Cytochrome P450 Family 2 Subfamily E Member 1), DUSP2 (Dual Specificity Phosphatase 2), and TCERG1L (transcription elongation regulator 1-like) were associated with rheumatoid arthritis (Mok et al. 2017) and colon tumors (Bae et al. 2014). Additionally, PFOS inhibited the oxidation reaction of CYP2E1 in vitro (Narimatu et al. 2011).
Gene ontology analysis showed that differentially methylated genes were enriched in multiple KEGG pathways (Figure 2), including signal transduction, signaling molecules and interaction, endocrine system, and immune system. However, in this assay we used genes with annotated CpGs with P-value
< 0.001, i.e., not achieving epigenome-wide
significance. It remains to be seen whether identified DNA methylation changes are functionally relevant.
Methylation changes derived from the exposures to PFOS and PFOA were different.
We have reported that PFOS and PFOA differentially affected health outcomes related to these pathways. Prenatal exposure to PFOS, but not PFOA, was negatively associated with the levels of maternal fatty acids (Kishi et al.
2015), possibly disrupted both maternal and infant thyroid hormone levels (Kato et al.
2016), and showed an inverse relationship with cord blood levels of glucocorticoids (Goudarzi et al. 2017). Dehydroepiandrosterone level was positively associated with the exposure to PFOS and negatively associated with the exposure to PFOA (Goudarzi et al. 2017).
PFOS and PFOA showed both positive and inverse associations with the levels of several reproductive and steroid hormones (Ito et al.
2016). The observed different potencies and modes of action may partly account for the distinct patterns of methylation changes. The differences in PFOS and PFOA concentrations and/or placental permeability could be an alternative explanation.
E.結論
In this epigenome-wide study, we suggested
that even relatively low levels of prenatal
exposure to PFASs impacted DNA
methylation status at birth. Further study is
needed to examine the persistence of DNA
methylation changes due to prenatal exposure
throughout life, and the associations of these
changes with health outcomes causally linked
to PFAS exposure in longitudinal studies.
- 47 -
F.研究発表 1.論文発表
1)
Kishi R., Araki A., Minatoya M., et al.;
The Hokkaido birth cohort study on environment and children’s health:
Cohort profile – updated 2017.
Environmental Health and Preventive Medicine. 22-46, 2017.
2)
Miura R, Araki A, Miyashita C, et al. An epigenome-wide study of cord blood DNA methylations in relation to prenatal perfluoroalkyl substance exposure: the Hokkaido study. Environment
International. 115 21-28, 2018.
2.学会発表
1)
Kobayashi, S., R. Miura, C. Miyashita, A.
Araki, M. Ishizuka, H. Nakazawa, Y. M.
Ito, T. Kubota, R. Kishi, Epigenome-wide Pathway Analyses of Prenatal
Perfluoroalkyl Acids Exposure on Cord Blood DNA Methylation: The Hokkaido Study, ISEE-ISES AC2016, Sapporo, Hokkaido, Japan, (2016.6.26-29)
2)
Kobayashi, S., R. Miura, C. Miyashita, A.
Araki, M. Ishizuka, H. Nakazawa, Y. Ito, T. Kubota, R. Kishi, Epigenome-wide analyses of prenatal perfluoroalkyl acids exposure on cord blood DNA
methylation: the Hokkaido study, ISEE2016: 28th Annual Conference International Society for Environmental Epidemiology, (2016.9.1-4)
G.知的財産権の出願・登録状況 該当なし
参考文献
1. Lau C, Anitole K, Hodes C, Lai D, Pfahles-Hutchens A, Seed J. 2007.
Perfluoroalkyl acids: A review of monitoring and toxicological findings.
Toxicological Sciences 99:366-394.
2. Olsen GW, Burris JM, Ehresman DJ, Froehlich JW, Seacat AM, Butenhoff JL, et al. 2007. Half-life of serum elimination of perfluorooctanesulfonate,perfluorohexanes ulfonate, and perfluorooctanoate in retired fluorochemical production workers.
Environmental Health Perspectives 115:1298-1305.
3. Inoue K, Okada F, Ito R, Kato S, Sasaki S, Nakajima S, et al. 2004. Perfluorooctane sulfonate (pfos) and related perfluorinated compounds in human maternal and cord blood samples: Assessment of pfos exposure in a susceptible population during pregnancy. Environmental Health Perspectives 112:1204-1207.
4. Apelberg BJ, Witter FR, Herbstman JB, Calafat AM, Halden RU, Needham LL, et al. 2007. Cord serum concentrations of perfluorooctane sulfonate (pfos) and perfluorooctanoate (pfoa) in relation to weight and size at birth. Environmental Health Perspectives 115:1670-1676.
5. Chen YA, Lemire M, Choufani S, Butcher DT, Grafodatskaya D, Zanke BW, et al.
2013. Discovery of cross-reactive probes and polymorphic cpgs in the illumina infinium humanmethylation450 microarray. Epigenetics 8:203-209.
6. Grandjean P, Andersen EW, Budtz-
Jorgensen E, Nielsen F, Molbak K, Weihe
P, et al. 2012. Serum vaccine antibody
- 48 -
concentrations in children exposed to perfluorinated compounds. Jama 307:391- 397.
7. Halldorsson TI, Rytter D, Haug LS, Bech BH, Danielsen I, Becher G, et al. 2012.
Prenatal exposure to perfluorooctanoate and risk of overweight at 20 years of age:
A prospective cohort study. Environmental Health Perspectives 120:668-673
8. Kishi R, Araki A, Minatoya M, Hanaoka T, Miyashita C, Itoh S, et al. 2017. The Hokkaido birth cohort study on
environment and children’s health: Cohort profile—updated 2017. Environmental Health and Preventive Medicine 22.
9. Olsen GW, Butenhoff JL, Zobel LR. 2009.
Perfluoroalkyl chemicals and human fetal development: An epidemiologic review with clinical and toxicological
perspectives. Reproductive toxicology 27:212-230.
10. Breton CV, Marsit CJ, Faustman E, Nadeau K, Goodrich JM, Dolinoy DC, et al. 2017. Small-magnitude effect sizes in epigenetic end points are important in children's environmental health studies:
The children's environmental health and disease prevention research center's
epigenetics working group. Environmental Health Perspectives 125:511-526.
11. Hackett JA, Surani MA. 2013. DNA methylation dynamics during the mammalian life cycle. Philosophical Transactions of the Royal Society of London Series B, Biological Sciences 368:20110328.
12. Guerrero-Preston R, Goldman LR, Brebi- Mieville P, Ili-Gangas C, LeBron C, Witter
FR, et al. Global DNA hypomethylation is associated with in utero exposure to cotinine and perfluorinated alkyl
compounds. Epigenetics 2010;5(6):539-46.
13. Kobayashi S, Azumi K, Goudarzi H, Araki A, Miyashita C, Kobayashi S, et al. 2017.
Effects of prenatal perfluoroalkyl acid exposure on cord blood igf2/h19 methylation and ponderal index: The Hokkaido study. Journal of Exposure Science & Environmental epidemiology 27:251-259.
14. Christensen BC, Marsit CJ. 2011.
Epigenomics in environmental health.
Frontiers in Genetics 2:84.
15. Kingsley SL, Kelsey KT, Butler R, Chen A, Eliot MN, Romano ME, et al. 2017.
Maternal serum pfoa concentration and DNA methylation in cord blood: A pilot study. Environmental Research 158:174- 178.
16. Aryee MJ, Jaffe AE, Corrada-Bravo H, Ladd-Acosta C, Feinberg AP, Hansen KD, et al. 2014. Minfi: A flexible and
comprehensive bioconductor package for the analysis of infinium DNA methylation microarrays. Bioinformatics (Oxford, England) 30:1363-1369.
17. Fortin JP, Labbe A, Lemire M, Zanke BW, Hudson TJ, Fertig EJ, et al. 2014.
Functional normalization of 450k methylation array data improves
replication in large cancer studies. Genome Biology 15:503.
18. Leek JT, Johnson WE, Parker HS, Jaffe
AE, Storey JD. 2012. The sva package for
removing batch effects and other unwanted
variation in high-throughput experiments.
- 49 -
Bioinformatics 28:882-883.
19. Bibikova M, Barnes B, Tsan C, Ho V, Klotzle B, Le JM, et al. 2011. High density DNA methylation array with single cpg site resolution. Genomics 98:288-295.
20. Lien GW, Wen TW, Hsieh WS, Wu KY, Chen CY, Chen PC. 2011. Analysis of perfluorinated chemicals in umbilical cord blood by ultra-high performance liquid chromatography/tandem mass
spectrometry. Journal of Chromatography B 879:641-646.
21. Okada E, Sasaki S, Saijo Y, Washino N, Miyashita C, Kobayashi S, et al. 2012.
Prenatal exposure to perfluorinated chemicals and relationship with allergies and infectious diseases in infants.
Environmental Research 112:118-125.
22. Washino N, Saijo Y, Sasaki S, Kato S, Ban S, Konishi K, et al. 2009. Correlations between prenatal exposure to
perfluorinated chemicals and reduced fetal growth. Environmental Health
Perspectives 117:660-667.
23. Bakulski KM, Feinberg JI, Andrews SV, Yang J, Brown S, S LM, et al. 2016. DNA methylation of cord blood cell types:
Applications for mixed cell birth studies.
Epigenetics 11:354-362.
24. Fox J, Weisberg S. 2011. Robust regression in r. Thousand Oaks, CA.:Sage.
25. Smyth GK. 2004. Linear models and empirical bayes methods for assessing differential expression in microarray experiments. Statistical Applications in Genetics and Molecular Biology 3:Article3.
26. Jaffe AE, Murakami P, Lee H, Leek JT,
Fallin MD, Feinberg AP, Irizarry RA, 2012. Bump hunting to identify differentially methylated regions in epigenetic epidemiology studies.
International journal of epidemiology 41:200-209.
27. Kanehisa M, Goto S, Kawashima S, Nakaya A. 2002. The kegg databases at genomenet. Nucleic Acids Research 30:42- 46.
28. Phipson B, Maksimovic J, Oshlack A.
2016. Missmethyl: An r package for analyzing data from illumina's humanmethylation450 platform.
Bioinformatics 32:286-288.
29. Harper KN, Peters BA, Gamble MV. 2013.
Batch effects and pathway analysis: two potential perils in cancer studies involving DNA methylation array analysis. Cancer Epidemiology Biomarkers and Prevention 22:1052-60.
30. Stein CR, Wolff MS, Calafat AM, Kato K, Engel SM. 2012. Comparison of
polyfluoroalkyl compound concentrations in maternal serum and amniotic fluid: A pilot study. Reproductive Toxicology 34:312-316.
31. Monroy R, Morrison K, Teo K, Atkinson S, Kubwabo C, Stewart B, et al. 2008.
Serum levels of perfluoroalkyl compounds in human maternal and umbilical cord blood samples. Environmental Research 108:56-62.
32. Huang PC, Su PH, Chen HY, Huang HB, Tsai JL, Huang HI, et al. 2012. Childhood blood lead levels and intellectual
development after ban of leaded gasoline
in taiwan: A 9-year prospective study.
- 50 -
Environment International 40:88-96.
33. Starling AP, Engel SM, Whitworth KW, Richardson DB, Stuebe AM, Daniels JL, et al. 2014. Perfluoroalkyl substances and lipid concentrations in plasma during pregnancy among women in the norwegian mother and child cohort study.
Environment International 62:104-112.
34. Lee YJ, Kim MK, Bae J, Yang JH. 2013.
Concentrations of perfluoroalkyl
compounds in maternal and umbilical cord sera and birth outcomes in korea.
Chemosphere 90:1603-1609.
35. Jiang W, Zhang Y, Zhu L, Deng J. 2014.
Serum levels of perfluoroalkyl acids (pfaas) with isomer analysis and their associations with medical parameters in chinese pregnant women. Environment International 64:40-47.
36. Leter G, Consales C, Eleuteri P, Uccelli R, Specht IO, Toft G, et al. 2014. Exposure to perfluoroalkyl substances and sperm DNA global methylation in Arctic and European populations. Environmental and Molecular Mutagenesis 55:591-600.
37. Watkins DJ, Wellenius GA, Butler RA, Bartell SM, Fletcher T, Kelsey KT. 2014.
Associations between serum perfluoroalkyl acids and LINE-1 DNA methylation.
Environment International 63:71-76.
38. Choi WI, Jeon BN, Yoon JH, Koh DI, Kim MH, Yu MY, et al. 2013. The proto-
oncoprotein FBI-1 interacts with MBD3 to recruit the Mi-2/NuRD-HDAC complex and BCoR and to silence
p21WAF/CDKN1A by DNA methylation.
Nucleic Acids Research 41:6403-6420.
39. Solomon O, Yousefi P, Huen K, Gunier
RB, Escudero-Fung M, et al 2017.
Prenatal phthalate exposure and altered patterns of DNA methylation in cord blood. Environmental Molecular Mutagenesis 58:398-410.
40. Riso V, Cammisa M, Kukreja H, Anvar Z, Verde G, Sparago A, et al. 2016. ZFP57 maintains the parent-of-origin-specific expression of the imprinted genes and differentially affects non-imprinted targets in mouse embryonic stem cells. Nucleic Acids Research. 44:8165-78.
41. DeVries A, Wlasiuk G, Miller SJ, Bosco A, Stern DA, Lohman IC, et al. 2016.
Epigenome-wide analysis
links SMAD3 methylation at birth to asthma in children of asthmatic mothers.
Journal of Allergy Clinical Immunology 140:534-542.
42. Kresovich JK, Zheng Y, Cardenas A, Joyce BT, Rifas-Shiman SL, Oken E, et al. 2017.
Cord blood DNA methylation and adiposity measures in early and mid- childhood. Clinical Epigenetics 9:86.
43. Mok A, Rhead B, Holingue C, Shao X, Quach HL, Quach D et al. 2017.
Hypomethylation of CYP2E1 and DUSP22 promoters associated with disease activity and erosive disease among rheumatoid arthritis patients. Arthritis Rheumatolgy (in press) doi:10.1002/art.40408.
44. Bae JH, Park J, Yang KM, Kim TO, Yi JM;
IBD study group of Korean Association for Study of Intestinal Diseases (KASID).
Molecular Medicine Reports 9:725-9.
45. Narimatsu S, Nakanishi R, Hanioka N,
Saito K, Kataoka H. 2011 Characterization
of inhibitory effects of perfluorooctane
- 51 -
sulfonate on human hepatic cytochrome P450 isoenzymes: focusing on CYP2A6.
Chemico-Biological Interactions 194:120- 126.
46. Kishi R, Nakajima T, Goudarzi H, Kobayashi S, Sasaki S, Okada E, et al, 2015. The Association of Prenatal
Exposure to Perfluorinated Chemicals with Maternal Essential and Long-Chain
Polyunsaturated Fatty Acids during Pregnancy and the Birth Weight of Their Offspring: The Hokkaido Study.
Environmental Health Perspectives 123:1038-45.
47. Kato S, Itoh S, Yuasa M, Baba T, Miyashita C, Sasaki S, et al. 2016.
Association of perfluorinated chemical exposure in utero with maternal and infant thyroid hormone levels in the sapporo cohort of Hokkaido study on the environment and children's health.
Environmental Health and Perspective Medicine 21:334-344.
48. Goudarzi H, Araki A, Itoh S, Sasaki S, Miyashita C, Mitsui T, et al. 2017. The association of prenatal exposure to perfluorinated chemicals with
glucocorticoid and androgenic hormones in cord blood samples: The Hokkaido study.
Environmental Health Perspectives 125:111-118.
49. Itoh S, Araki A, Mitsui T, Miyashita C, Goudarzi H, Sasaki S, et al. 2016.
Association of perfluoroalkyl substances exposure in utero with reproductive hormone levels in cord blood in the Hokkaido study on environment and children's health. Environment
international 94:51-59.
- 52 -
Table 1 Characteristics of study population of the discovery cohort (n=190).
a
Spearman's correlation test (
ρ),
bMann-Whitney U-test,
cKruskal-Wallis test
Median Median
(25th, 75th) (25th, 75th) or correlationa or correlationa
190 5.2 (3.8, 7.1) 1.4 (0.9, 2.1)
190 29.7 ± 4.8 ρ= 0.087 0.233 ρ= 0.041 0.579 190 21.2 ± 3.1 ρ= 0.018 0.803 ρ= 0.056 0.444
0 104 54.7 5.7 (4.2, 8.0) 0.002 1.6 (1.2, 2.4) <0.001
≥ 1 86 45.2 4.7 (3.1, 6.2) 1.0 (0.7, 1.5)
< 28 weeks 74 38.9 5.8 (4.6, 7.5) <0.001 1.7 (1.2, 2.3) 0.004 28–36 weeks 47 24.7 5.6 (4.0, 8.5) 1.3 (0.8, 1.8)
≧ 36 weeks 69 36.3 4.6 (2.8, 5.7) 1.2 (0.8, 1.8)
≤ 12 89 46.8 5.2 (4.1, 7.0) 0.966 1.3 (0.8, 1.8) 0.072
> 12 101 53.2 5.3 (3.6, 7.4) 1.5 (1.0, 2.3)
< 3 38 20 5.4 (3.9, 8.0) 0.878 1.4 (0.8, 2.2) 0.541
3–5 95 50 5.1 (3.5, 7.0) 1.4 (0.9, 1.8)
5–7 40 21.1 5.4 (4.2, 6.9) 1.4 (0.9, 2.1)
> 7 15 7.9 5.1 (3.0, 8.8) 2.3 (0.8, 2.4)
missing 2 1.1 7.8 (4.5, 11.1)
No 157 82.6 5.3 (4.0, 7.3) 0.039 1.4 (0.9, 2.2) 0.011
Yes 33 17.4 4.3 (2.5, 6.8) 1.0 (0.7, 1.6)
No 130 68.4 5.2 (3.9, 7.2) 0.954 1.4 (0.9, 2.1) 0.821
Yes 60 31.6 5.3 (3.7, 7.1) 1.4 (0.9, 2.2)
Sexb Male 84 44.2 5.1 (3.3, 7.0) 0.117 1.6 (1.0, 2.4) 0.025
Female 106 55.8 5.4 (4.1, 7.5) 1.3 (0.8, 1.9)
190 39.9 ± 1.0 ρ= 0.031 0.675 ρ= 0.093 0.203
190 3131 ± 330 ρ= –0.122 0.095 ρ= –0.118 0.104 Gestational age (week)a
Birth weight (g)a
Mean ±SD (%)
Blood sampling periodc
Educational level (year)b
Annual household income (million yen)c
Smoking during pregnancyb
Alcohol consumption during pregnancyb
Infant characteristics
Concentration in maternal blood
Maternal characteristics Maternal age (year)a
Pre-pregnancy BMI (kg/m2)a Parity (times)b
n
PFOS (ng/mL) PFOA (ng/mL)
P P
- 53 -
Figure 1. Manhattan (left panels) and volcano plots (right panels) of the genome-wide associations of DNA methylation with prenatal exposure to PFOS (A) or PFOA (B) in the discovery cohort.
Left panels: Manhattan plots of P-value for the associations between prenatal PFAS exposures and DNA methylation across chromosomes. Right panels: Volcano plots showing P-values versus the magnitude of effect (Coef) on DNA methylation associated with prenatal PFAS exposures.
Horizontal lines represent the significance threshold of a FDR < 0.05.
- 54 -
Table 2. Top 20 CpGs ranked by the smallest P-value from the epigenome-wide analysis of the association between prenatal PFAS exposure and cord blood DNA methylation.
Coefb P-Value Coefb P-Value
cg25705526 SNAPIN 1 TSS200 0.020 1.48E-07FDR,d -0.006 0.425
cg04928693 MTX1 1 TSS1500 0.024 7.19E-07 -0.003 0.737
cg18155888c MORN1 1 Body 0.017 4.32E-06 0.023 0.277
cg17086204 PLA2G5 1 3'UTR 0.025 5.56E-06 0.000 0.955
cg10504365 TRIM67 1 TSS1500 0.032 5.84E-06 -0.022 0.003
cg01889773c GPC1 2 Body 0.030 6.92E-07 0.008 0.538
cg16845265 KLHL29 2 IGR 0.065 8.73E-07 -0.019 0.528
cg25808157 GREB1 2 Body 0.034 3.13E-06 -0.002 0.926
cg21969395 LRAT 4 TSS200 0.016 8.23E-06 -0.001 0.870
cg22953687 ZFYVE28 4 Body 0.025 8.25E-06 -0.018 0.117
cg12215478 SRPK1 6 Body 0.008 6.93E-06 -0.002 0.421
cg14369981c LMX1B 9 IGR 0.037 2.81E-06 0.007 0.705
cg17918227c CADM1 11 Body 0.012 7.56E-06 0.005 0.336
cg14120075c TFDP1 13 Body 0.031 3.94E-06 0.008 0.626
cg03097541c ZNF213 16 5'UTR 0.006 3.38E-06 0.002 0.131
cg01718742 CDH8 16 TSS200 0.003 4.06E-06 -0.001 0.651
cg02044327c CXADRP3 18 IGR 0.078 4.06E-08FDR,d 0.036 0.142
cg16242615c ZBTB7A 19 5'UTR 0.037 4.54E-06 0.035 0.028 ✓
cg15815607 HM13 20 Body 0.053 4.57E-06 -0.008 0.645
cg12700033 YWHAH 22 TSS200 0.006 7.41E-06 0.000 0.958
cg23049737 RERE 1 3'UTR 0.011 1.43E-05 -0.009 0.056
cg00567854c BTG2 1 TSS1500 -0.025 1.48E-05 -0.009 0.214
cg10403518 SLC9A4 2 Body 0.038 1.75E-06 -0.014 0.083
cg22325921 DUX2 4 IGR -0.020 9.90E-06 0.002 0.719
cg05158146c MIR4460 5 IGR -0.010 6.75E-06 0.000 0.931
cg23917868c MIR145 5 TSS200 -0.020 1.76E-05 -0.006 0.289 cg04461802 GPR126 6 5'UTR -0.046 1.65E-07FDR,d 0.008 0.456 cg11260715c AC002480.3 7 IGR -0.008 2.32E-08FDR,d -0.002 0.247
cg12105980c EN2 7 IGR -0.023 1.24E-05 -0.008 0.220
cg13951074 DMRT2 9 IGR 0.010 5.09E-07 0.000 0.888
cg07661167c ZNF33BP1 10 IGR 0.032 1.62E-06 0.015 0.065
cg01486146 PAX2 10 IGR -0.014 1.50E-05 0.005 0.088
cg21876869c USP2-AS1 11 IGR -0.027 1.64E-06 -0.024 0.000 ✓
cg17114584 IRF7 11 Body -0.047 9.01E-06 0.001 0.928
cg00173435c TCP11L2 12 TSS200 0.006 8.52E-07 0.003 0.001 ✓
cg16475925c SPG7 16 TSS200 0.003 1.82E-05 0.002 0.095
cg00897875 MAP3K14 17 5'UTR -0.006 9.16E-07 0.004 0.077
cg18901140c NTN1 17 IGR -0.036 2.66E-06 -0.029 0.000 ✓
cg01426818c CBX4 17 IGR -0.012 5.20E-06 -0.002 0.720
cg18002862c RAP1GAP2 17 Body -0.008 1.22E-05 -0.002 0.146 log10(PFOS)
log10(PFOA)
Replicatedd Probe ID Gene Chr Featurea Discovery cohort Replication cohort
- 55 -
Abbreviations: Chr, chromosome; IGR, intergenic region; TSS, transcription start site; TSS200, 200 bases from TSS; TSS1500, 1500 bases from TSS; body, gene body; UTR, untranslated region.
a
Gene feature category of the methylation locus.
b
Partial regression coefficient; the magnitude of the effect on DNA methylation.
c
CpG that showed the same direction of effect in both the discovery and replication cohorts.
d
Genome-wide significance threshold (FDR q < 0.05).
e
Successful replication defined as having the same direction of effect and a P-value < 0.05 in the discovery cohort.
Table 3. TOP5 of differentially methylated regions indicated by the bumphunting method.
Abbreviations: Chr, Chromosome; body, gene body; IGR, intergenic region; TSS, transcription start site; TSS1500, 1500 bases from TSS, FWER, family-wise error rate
a
Gene feature category of the methylation locus.
bRelation to CpG island.
c
FWER < 0.1
CYP2E1 10 135342560 135343280 6 Body island/shore 3.75E-04
KLHL35 11 75139390 75139736 4 Body island/shore 8.86E-04
SMAD 15 67356310 67356942 5 TSS1500/IGR shore 1.09E-03
HOOK2 19 12876846 12877188 4 Body island/shore 1.65E-04
SLC17A9 20 61590751 61591209 4 Body island/shore 4.83E-04
GFPT2 5 179740743 179741120 4 Body island 2.03E-03
ZFP57 6 29648225 29649084 21 IGR open sea 1.00E-04FWER,c
DUSP22 6 291687 293285 10 Body island 7.87E-04
CYP2E1 10 135342560 135343280 6 Body island/shore 3.72E-04
TCERG1L 10 132910868 132911152 4 Body open sea 1.52E-03
log10(PFOS)
log10(PFOA)
CGIb P-value
Gene Chr Start End Number of
Probes Featuresa
- 56 -
Table 4. The average partial regression coefficient of TOP5 DMRs in the discovery and replication cohorts.
Abbreviations: Chr, Chromosome.
a
Average partial regression coefficient at CpG sites in the region.
b
direction of methylation change: +, up-methylated,
–, down-methylated.
CYP2E1 10 0.040 + 0.059 +
KLHL35 11 0.134 + -0.127 –
SMAD 15 0.128 + 0.027 +
HOOK2 19 -0.212 – 0.290 +
SLC17A9 20 0.165 + 0.163 +
GFPT2 5 -0.100 – -0.035 –
ZFP57 6 -0.112 – -0.052 –
DUSP22 6 -0.030 – -0.113 –
CYP2E1 10 0.112 + 0.007 +
TCERG1L 10 0.025 + 0.009 +
log10(PFOA) log10(PFOS)
Average Coefa Directionb Average Coefa Directionb Replication cohort
Gene Chr
Discovery cohort
- 57 -
0 5
10 15
20 25
30 35
Lysine degradation
Cytokine-cytokine receptor interaction ECM-receptor interaction
Cell adhesion molecules (CAMs) PI3K-Akt signaling pathway MAPK signaling pathway
Cell cycle Oocyte meiosis Phagosome Focal adhesion
Oxytocin signaling pathway Aldosterone synthesis and secretion Vascular smooth muscle contraction Adrenergic signaling in cardiomyocytes Platelet activation
Hematopoietic cell lineage Axon guidance
Circadian entrainment GABAergic synapse Environmental Information Processing
Cellular Processes
Organismal Systems
Cellular community - eukaryotes
Endocrine system
Development Cell growth and death
Environmental adaptation Immune system
KEGG Orthology
Signal transduction Metabolism
KEGG Pathway
Transport and catabolism
Circulatory system Amino acid metabolism
Number of genes in pathway
7.35E-07 3.50E-06 6.75E-06 1.74E-09 7.15E-05 P-Value (A) PFOS
Signaling molecules and interaction
Nervous system
2.84E-05
2.80E-06 9.03E-05 4.38E-06 7.38E-05
1.17E-08 4.45E-05 2.45E-07 1.16E-04 3.89E-05 5.79E-05 3.14E-08 1.64E-05 4.13E-05
- 58 -
Figure 2. Significantly enriched pathways among the genes with differentially methylated CpGs associated with the exposures to PFOS (A) and PFOA (B).
White bars, observed number of genes; black bars, expected number of genes in each pathway. P <
0.001 vs. the expected number of genes.
0 5
10 15
20 25
RNA degradation
Wnt signaling pathway PI3K-Akt signaling pathway MAPK signaling pathway
Cytokine-cytokine receptor interaction Neuroactive ligand-receptor interaction
Signaling pathways regulating pluripotency of stem…
Tight junction Lysosome
Adrenergic signaling in cardiomyocytes Glutamatergic synapse
Relaxin signaling pathway Osteoclast differentiation Cytosolic DNA-sensing pathway Environmental Information Processing
Cellular Processes
Organismal Systems
Cellular community - eukaryotes
Endocrine system
Immune system KEGG Orthology
Signal transduction
KEGG Pathway
Transport and catabolism
Circulatory system
Genetic Information Processing Folding, sorting and degradation
Signaling molecules and interaction (B) PFOA
Development
Number of genes in pathway Nervous system
1.03E-06 3.25E-06 7.08E-06 9.63E-05 9.91E-05 P-Value 3.60E-06
7.55E-06 8.99E-05 7.92E-05
1.03E-06 3.25E-06 7.08E-06 9.63E-05 9.91E-05