CLINICAL ARTICLE
Vaginal fl uid pH and buffer capacity for predicting false preterm labor in Japanese women
Taketoshi Noguchi, Toshiyuki Sado, Katsuhiko Naruse, Hiroshi Kobayashi ⁎
Department of Obstetrics and Gynecology, Nara Medical University, Nara, Japan
a b s t r a c t a r t i c l e i n f o
Article history:
Received 5 August 2015
Received in revised form 16 November 2015 Accepted 22 February 2016
Objective:To determine the relationship between preterm labor and delivery, and the pH and buffer capacity of vaginal secretions.Methods: Between January 1, 2009 and March 31, 2012, two cohorts of patients at 22–36 weeks of pregnancy were enrolled in a prospective cohort study at Nara Medical University Hospital, Japan. Patients experiencing preterm contractions and a control group of patients experiencing normal pregnan- cies were included. The pH and buffer capacity of vaginal secretions were measured and compared.Results:Of the 237 patients enrolled, 48 (20.3%) were experiencing symptoms of preterm labor and 189 (79.7%) were included in the control group. The pH was higher (Pb0.001) and the buffer capacity was lower (P= 0.0135) in the vaginal secretions of the patients experiencing preterm contractions compared with the control group. There was no dif- ference in the pH and buffer capacity of the vaginal secretions of symptomatic patients who would experience preterm delivery and those who would not. Receiver operating characteristic curve analyses demonstrated that vaginal-secretion pH and buffer capacity could differentiate between patients experiencing preterm contrac- tions and those not, but could not differentiate between patients who would experience preterm delivery and those who would not.Conclusion:Vaginal-secretion pH and buffer capacity could be useful in diagnosing preterm labor; further studies are needed to determine potential practical diagnostic criteria.
© 2016 International Federation of Gynecology and Obstetrics. Published by Elsevier Ireland Ltd. All rights reserved.
Keywords:
Buffering capacity Prediction Preterm delivery Preterm labor
Threatened preterm labor Vaginal pH
1. Introduction
The most common obstetric complication experienced during pregnancy is preterm delivery; it is currently the leading cause of perinatal morbidity and mortality worldwide[1]. It is difficult to discriminate between patients who will actually experience pre- term delivery and those who experience preterm uterine contrac- tions but do not undergo delivery until at least full term, with more than half of patients thought to be at risk of preterm delivery ultimately experiencing a full-term delivery[2]. The multifactorial etiology of preterm labor[2,3]explains this difficulty in identifying specific biomarkers for preterm delivery.
Recent attempts to accurately predict preterm delivery have included the use of ultrasonographic measurements of the cervix[4,5]and mea- suring (cervico)vaginalfluid properties[6], including fetalfibronectin (fFN)[7]and phosphorylated insulin-like growth factor-binding protein 1[8]. Analytical tests using fFN have demonstrated some accuracy in predicting spontaneous preterm delivery among patients experiencing symptoms of preterm labor[9–13]and a quantitative phosphorylated insulin-like growth factor-binding protein 1 test has demonstrated
accuracy in predicting preterm delivery among patients experiencing preterm labor[14]and in patients during thefirst trimester of pregnancy [15]. Additionally, considerable interest has been shown in developing safe, effective, simple, and inexpensive biomarker assays for predicting preterm delivery[16,17].
The novel idea explored in the present study originated from the concept that saliva provides protection against dental erosion and caries [18]. The healthy oral microbiota performs a protective role against pathogenic bacteria. Significant correlations have been demonstrated between an increased risk of dental caries and both salivaStreptococcus mutanscounts and buffer capacity[19]. In comparison with healthy controls, patients with dental erosion have demonstrated larger de- creases in pH following citric acid rinses or drinking orange juice, with the pH of patients' saliva remaining decreased for a longer period of time[20]. Low saliva buffer capacity has been found to be a risk factor for the development of dental caries[18,20]. It was hypothesized that, similarly, reductions in vaginal buffer capacity could result in a decrease in vaginal pH, and that this could, in turn, influence the likelihood of preterm labor and delivery.
Consequently, the aim of the present study was to evaluate the pH and buffer capacity of vaginal secretions of patients who were pregnant to identify any associations between these values and preterm labor.
To the best of our knowledge, no previous studies have investigated the association between preterm labor and the buffer capacity of vaginal secretions.
⁎ Corresponding author at: Department of Obstetrics and Gynecology, Nara Medical University, 840 Shijo-cho, Kashihara, 634-8522, Japan. Tel.: +81 744 29 8877; fax: +81 744 23 6557.
E-mail address:[email protected](H. Kobayashi).
http://dx.doi.org/10.1016/j.ijgo.2015.11.018
0020-7292/© 2016 International Federation of Gynecology and Obstetrics. Published by Elsevier Ireland Ltd. All rights reserved.
Contents lists available atScienceDirect
International Journal of Gynecology and Obstetrics
j o u r n a l h o m e p a g e :w w w . e l s e v i e r . c o m / l o c a t e / i j g o
2. Materials and methods
The present study included data from two prospective cohorts enrolled at Nara Medical University Hospital, Japan, between January 1, 2009 and March 31, 2012. Thefirst cohort study (cohort 1) examined the pH of patients vaginal secretions only and enrolled patients attend- ing the study hospital owing to symptoms of preterm labor and a control group between January 1, 2009 and December 31, 2009. Follow- ing this, the second prospective cohort (cohort 2) examined the pH and buffer capacity of vaginal secretions, enrolling further patients experiencing preterm labor and a control group between January 1, 2010 and March 31, 2012. Both cohorts were enrolled according to the same criteria; the preterm-labor groups comprised patients at
22–36 weeks of pregnancy attending the study hospital owing to increasingly symptomatic uterine contractions at shorter than 10-min intervals, who had cervical dilation up to 3 cm or had premature efface- ment of the cervix. The control groups enrolled patients at 22–36 weeks of pregnancy who were experiencing no pregnancy complications, had no systemic diseases, and where not regularly taking any medications.
Patients were recruited to the control groups when attending routine prenatal checkups. The exclusion criteria for all potential study partici- pants included preterm rupture of membranes, cervical dilatation greater than 3 cm, multiple pregnancies, non-reassuring fetal testing, chronic hypertension, pre-eclampsia, pre-existing diabetes, gestational diabetes mellitus, lupus erythematosus, abruptio placenta, intrauterine growth restriction, fetal anomalies, placenta previa, clinical signs of Table 2
Patient characteristics among study participants in cohort 2.a
Variable Control patients
(n = 96)
Patients exhibiting symptoms of preterm labor (n = 27)
Patients who delivered at term after demonstrating symptoms of preterm labor (n = 16)
Patients who delivered preterm after demonstrating symptoms of preterm labor
(n = 11)
Pvalue
No. of vaginal mucus samples 179 59 34 25
Parity 0.118
0 48 8 6 2
1 33 12 5 7
2 15 7 5 2
Age, y 30.2 ± 5.19 (18–40) 30.9 ± 4.32 (22–39) 31.1 ± 4.68 (22–39) 30.5 ± 3.70 (23–35) 0.550
Neonate weight at delivery, g 2955.9 ± 358.3 2638.9 ± 565.0 2809.5 ± 415.8 2390.7 ± 654.3 0.011b
Duration of pregnancy at recruitment, wk 28.1 ± 3.84 31.0 ± 3.00 31.4 ± 3.30 30.5 ± 2.39 b0.001c
Duration of pregnancy at delivery, wk 38.7 ± 1.30 36.7 ± 2.08 37.8 ± 0.95 35.2 ± 2.29 b0.001d
Buffer capacity 0.743 ± 0.372 0.668 ± 0.457 0.747 ± 0.639 0.671 ± 0.301 0.014e
aValues are given as number, number (percentage), mean ± SD (range), or mean ± SD, unless indicated otherwise.
b Significant differences were observed between the control group and patients exhibiting symptoms of preterm labor (P= 0.016), and between the control group and patients who delivered preterm after demonstrating symptoms of preterm labor (P= 0.023).
c Significant differences were observed between the control group and patients exhibiting symptoms of preterm labor (Pb0.001), and between the control group and patients who delivered at term after demonstrating symptoms of preterm labor (P= 0.0015).
d Significant differences were observed between the control group and patients exhibiting symptoms of preterm labor (Pb0.001), between the control group and patients who de- livered at term after demonstrating symptoms of preterm labor (Pb0.001), between the control group and patients who delivered preterm after demonstrating symptoms of preterm labor (Pb0.001), and between patients who delivered at term after demonstrating symptoms of preterm labor and patients who delivered preterm after demonstrating symptoms of preterm labor (P= 0.0048).
eSignificant differences were observed between the control group and patients exhibiting symptoms of preterm labor (P= 0.0135), and between the control group and patients who delivered preterm after demonstrating symptoms of preterm labor (P= 0.0465).
Table 1
Patient characteristics among all study participants (cohorts 1 and 2).a
Variable Control patients
(n = 189)
Patients exhibiting symptoms of preterm labor (n = 48)
Patients who delivered at term after demonstrating symptoms of preterm labor (n = 30)
Patients who delivered preterm after demonstrating symptoms of preterm labor (n = 18)
Pvalue
No. of vaginal mucus samples 501 118 75 43
Parity 0.112
0 97 19 13 6
1 65 18 9 9
2 27 11 8 3
Age, y 29.5 ± 5.54 (16–43) 30.8 ± 4.41 (22–39) 31.2 ± 4.60 (22–39) 30.1 ± 3.99 (23–37) 0.255
Neonate weight at delivery, g 3018.5 ± 372.2 2770.8 ± 572.4 2942.0 ± 441.2 2485.6 ± 647.5 0.007b
Duration of pregnancy at recruitment, wk 27.2 ± 3.94 31.2 ± 2.87 31.4 ± 3.18 30.9 ± 2.25 b0.001c
Duration of pregnancy at delivery, wk 38.8 ± 1.2 36.8 ± 1.86 37.7 ± 0.90 35.2 ± 2.00 b0.001d
Vaginal secretion pH 4.05 ± 0.34 4.38 ± 0.54 4.35 ± 0.536 4.44 ± 0.52 b0.001e
aValues are given as number, number (percentage), mean ± SD (range), or mean ± SD, unless indicated otherwise.
b Significant differences were observed between the control group and patients exhibiting symptoms of preterm labor (P= 0.007), between the control group and patients who delivered preterm after demonstrating symptoms of preterm labor (P= 0.004), and between patients who delivered at term after demonstrating symptoms of preterm labor and patients who delivered preterm after demonstrating symptoms of preterm labor (P= 0.016).
c Significant differences were observed between the control group and patients exhibiting symptoms of preterm labor (Pb0.001), between the control group and patients who delivered at term after demonstrating symptoms of preterm labor (Pb0.001), and between the control group and patients who delivered preterm after demonstrating symptoms of preterm labor (Pb0.001).
d Significant differences were observed between the control group and patients exhibiting symptoms of preterm labor (Pb0.001), between the control group and patients who delivered at term after demonstrating symptoms of preterm labor (Pb0.001), between the control group and patients who delivered preterm after demonstrating symptoms of preterm labor (Pb0.001), and between patients who delivered at term after demonstrating symptoms of preterm labor and patients who delivered preterm after demonstrating symptoms of preterm labor (Pb0.001).
eSignificant differences were observed between the control group and patients exhibiting symptoms of preterm labor (Pb0.001), between the control group and patients who de- livered at term after demonstrating symptoms of preterm labor (Pb0.001), and between the control group and patients who delivered preterm after demonstrating symptoms of preterm labor (Pb0.001).
infection at the time of recruitment, positive screening test results for Candidaspp. orTrichomonas vaginalis, symptoms suggesting bacterial vaginosis, and recent (within 24 h) sexual intercourse. Additionally, any patients who had recently undergone digital vaginal examination, transvaginal ultrasonography, or any additional treatment were also ex- cluded. The study was approved by the Research and Ethics Committee of Nara Medical University and written informed consent was provided by all participants.
Patients presenting with symptoms of preterm labor were assessed for cervical length, effacement, and dilatation. At the discretion of the attending physician, tocolytic therapy, including intravenous magne- sium sulfate, or intravenous or oral beta-mimetic therapy, could be administered.
To assess the pH and buffer capacity of vaginal secretions, samples from the posterior vaginal forniceal mucus were obtained using a polyethylene terephthalate swab (Becton, Dickinson and Co, Franklin Lakes, NJ, USA) during an examination with a sterile speculum prior to any digital vaginal examination. A sterile swab was rotated across the posterior fornix of the vagina for 5 s to absorb secretions to be assayed directly. Any samples with blood visible on the swab were excluded.
Samples were collected prior to the administration of any medications following hospital admission. The pH and buffering capacity of all samples were tested immediately using a micro pH electrode and pH meter (pH/mV meters CL-9D02 and TN208-031; Unique Medical Co LTD, Tokyo, Japan) (Supplementary material S1). A pilot study had previously determined that the intra-assay and inter-assay coefficients of variation of vaginal-secretion pH were lower than 5%
(unpublished data).
A second vaginal-secretion sample was collected with a separate swab and was used for the vaginal-secretion buffer capacity assay. The buffer capacity of vaginal secretions was defined as the capacity of the mucus to maintain a consistent pH (i.e. the titratable acidity). pH values were tested before and after adding phosphate buffered saline (PBS;
Sigma-Aldrich Co, St. Louis, MO, USA) to vaginal mucus, providing pre- cise estimations of the change in pH (ΔpH, calculated by subtracting the initial pH from the pH after PBS had been added). The sample swab was placed in 0.1 mL of 10 mmol/L PBS that was then shaken for 5 s before being allowed to stand for 10 s; following this, thefinal pH was measured with a manual pH meter. If a patient demonstrated a higher buffer capacity, the vaginalfluidΔpH value would be low.ΔpH appeared to be an adequate parameter for calculating the buffer capac- ity. In the present study, the buffer capacity was expressed asΔpH1 .
Data were analyzed using SPSS version 21.0 (IBM Corp, Armonk, NY, USA). The Studentttest and Mann–WhitneyUtest were used to assess differences in the pH and buffer capacity, respectively, between the patient groups. A receiver operating characteristic curve (ROC) analysis was used to determine the optimum threshold pH value and buffer capacity values for predicting pregnancy outcomes, specifically the values that maximized the sum of specificity and sensitivity. Pregnancy outcomes were defined as either preterm delivery (b37 weeks) or term delivery (≥37 weeks). The statistical tests performed were two sided andPb0.05 was considered statistically significant.
3. Results
In total, 237 patients were recruited across the entire study; 114 pa- tients were recruited to cohort 1, including 21 (18.4%) patients experienc- ing preterm labor. Among the patients in cohort 1 experiencing preterm labor, 7 (33.3%) experienced preterm delivery. Cohort 2 enrolled 123 pa- tients, including 27 (22.0%) who were experiencing preterm labor; of these 27 patients, 11 (40.7%) experienced preterm delivery. All patients recruited to the control groups underwent delivery at term. The charac- teristics of cohorts 1 and 2 combined are summarized inTable 1.
Table 2 summarizes the characteristics of cohort 2 only, including vaginal-secretion buffer capacity. The neonatal weight at delivery was
significantly lower among patients who experienced preterm labor com- pared with the control group in both cohort 2 alone and in the combined complete study population. The duration of pregnancy at recruitment was shorter in the control group compared with the patients who attended the study institution owing to preterm labor in both the complete study population and among patients in cohort 2. However, the duration of pregnancy at delivery was lower in the patients who experienced preterm labor than in the control group.
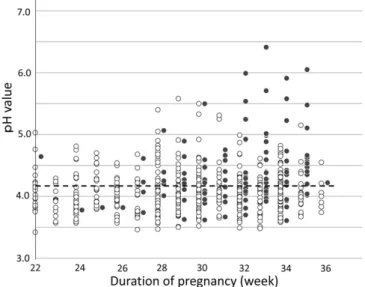
Some patients had samples collected multiple times throughout the study period; predictive modelling was performed including all patient samples and using only thefirst sample collected from each patient. In total, 619 individual samples from 237 patients were included. The pH Fig. 1.Vaginal pH values recorded during pregnancy. Open circles represent patients in the control group; closed circles represent patients admitted to the study hospital experiencing preterm contractions with intact membranes.
Fig. 2.Box and whisker plot of vaginal pH from all samples collected from the control group, patients demonstrating symptoms of preterm labor who experienced term delivery, and patients symptomatic for preterm labor who experienced preterm delivery. Boxes represent the interquartile range and the line within each box represents the median value. Whiskers indicate the 10th and 90th percentiles, respectively. Outlier values are indicated by crosses.
of vaginal mucus samples are presented inFig. 1. In the control group, the vaginal pH was not affected by the duration of pregnancy (Fig. 1).
When all the vaginal-mucus samples were included, elevated pH levels were recorded in patients experiencing symptoms of preterm labor compared with the control group (Tables 1, 2,Fig. 2). When the vaginal-mucus pH of patients experiencing preterm labor who experi- enced preterm delivery was compared to that of symptomatic patients who did not experience preterm delivery, no significant difference was observed (Table 1). The ROC curve analysis using all patient samples demonstrated an optimal cutoff value of pH 4.18, resulting in a sensitivity and specificity of 62.7% and 71.7%, respectively, and a positive predictive value (PPV) and negative predictive value (NPV) of 34.3% and 89.1%, respectively, for predicting if patients were currently experiencing symptoms of preterm labor or not (Table 3,Fig. 3).
Additionally, differences in pH were compared using only the initial samples obtained from patients (either at hospital admission for symp- toms of preterm labor or during initial prenatal care visit during the study period). Elevated vaginal-mucus pH was observed in patients
experiencing symptoms of preterm labor in comparison with the control group; however, there was no difference between the patients demon- strating symptoms of preterm labor who experienced preterm delivery and the patients with symptoms of preterm labor who did not (Table 3). The optimum ROC curve cutoff value when including only patients' initial samples was pH 4.16 when predicting if patients were currently experiencing symptoms of preterm labor (Table 3,Fig. 3).
The buffering capacity of vaginal mucus was investigated in cohort 2, which included 179 samples obtained from 96 patients in the control group and 59 samples obtained from 27 patients experiencing symptoms of preterm labor (Table 2). Among the control group, the buffering capac- ity of patients' vaginal mucus was not altered significantly by the duration of the index pregnancy (Fig. 4).
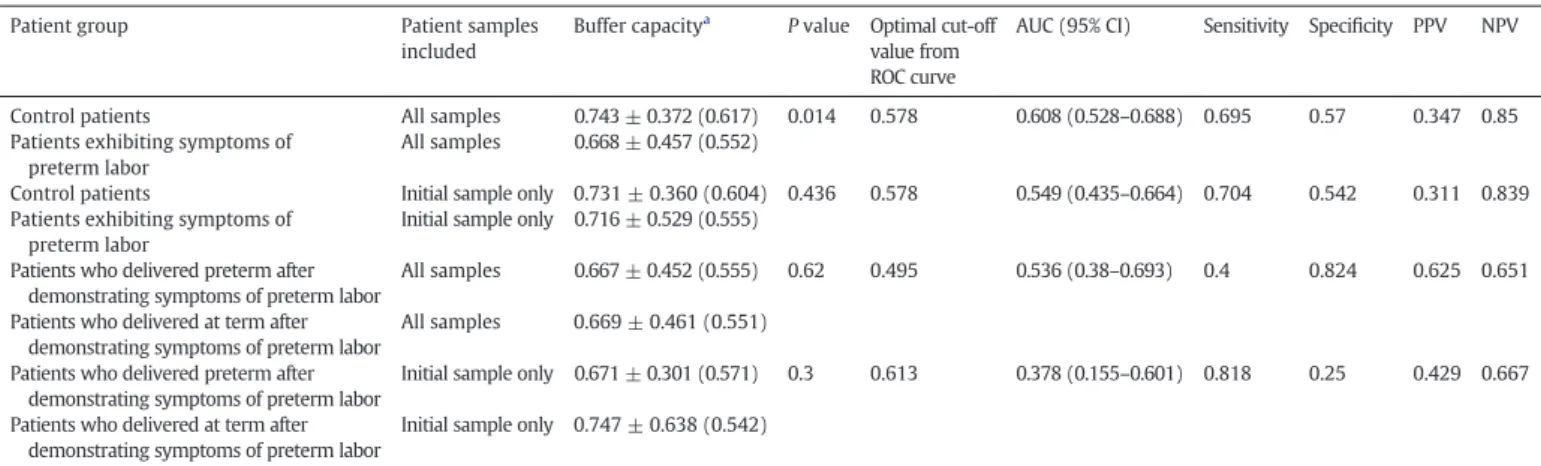
When including all patient samples, the mean buffer capacity was higher in the control group than among patients experiencing symp- toms of preterm labor (Table 4). Lower buffer capacities were also dem- onstrated in both the patients demonstrating symptoms of preterm labor who experienced preterm delivery and the patients experiencing preterm labor who did not, when each was compared with the control group; however, no significant difference was observed when compar- ing the patients experiencing symptoms of preterm labor who went on to experience preterm delivery with the patients displaying symptoms of preterm labor who underwent delivery at term (Table 2,Fig. 5). The ROC curve analysis that included all patient samples from cohort 2 demonstrated that the optimum buffer-capacity cutoff value was 0.578, corresponding to a sensitivity, specificity, PPV, and NPV of 69.5%, 57.0%, Table 3
Predictive value of vaginal mucus sample pH in diagnosing preterm labor or preterm birth.
Patient group Patient samples
included
pHa Pvalue Optimal cut-off
value from ROC curve
AUC (95% CI) Sensitivity Specificity PPV NPV
Control patients All samples 4.05 ± 0.345 (3.98) b0.001 4.18 0.711 (0.659–0.763) 0.627 0.717 0.343 0.891
Patients exhibiting symptoms of preterm labor
All samples 4.38 ± 0.537 (4.245)
Control patients Initial sample only 4.07 ± 0.350 (4.00) b0.001 4.16 0.694 (0.605–0.784) 0.708 0.689 0.37 0.903 Patients exhibiting symptoms of
preterm labor
Initial sample only 4.35 ± 0.487 (4.245) Patients who delivered preterm after
demonstrating symptoms of preterm labor
All samples 4.44 ± 0.528 (4.36) 0.392 4.27 0.584 (0.479–0.689) 0.581 0.6 0.455 0.714 Patients who delivered at term after
demonstrating symptoms of preterm labor
All samples 4.35 ± 0.536 (4.20) Patients who delivered preterm after
demonstrating symptoms of preterm labor
Initial sample only 4.35 ± 0.511 (4.20) 0.93 4.33 0.454 (0.284–0.623) 0.444 0.5 0.348 0.6 Patients who delivered at term after
demonstrating symptoms of preterm labor
Initial sample only 4.36 ± 0.472 (4.305)
Abbreviations: ROC, receiver operating characteristic; AUC, area under the curve; CI, confidence interval; PPV, positive predictive value; NPV, negative predictive value.
aValues given as mean ± SD (median).
Fig. 3.ROC curve of the use of pH value for predicting if patients were currently experiencing symptoms of preterm labor. The optimal pH cutoff was 4.18, the specificity was 0.717, and the sensitivity was 0.627. Abbreviation: ROC, receiver operating curve.
Fig. 4.Vaginal-buffer capacity recorded during pregnancy. Open circles represent patients in the control group; closed circles represent patients admitted to the study hospital experiencing preterm contractions with intact membranes.
34.7%, and 85.0%, respectively, for predicting if patients were currently experiencing symptoms of preterm labor (Fig. 6andTable 4).
4. Discussion
The present study demonstrated increased pH and lower buffering capacity in the vaginal mucus of patients who were experiencing the symptoms of preterm labor. Thesefindings suggest that both tests could be useful markers for identifying an increased risk of preterm labor for patients. For both markers, the NPV recorded was higher than the PPV, demonstrating that both markers were more effective in identifying healthy individuals than patients experiencing preterm labor at that time. Unfortunately, both markers were unable to discrim- inate between patients experiencing symptoms of preterm labor who would go on to experience preterm delivery and those who were experiencing similar symptoms but would undergo delivery at term.
To our knowledge, this is thefirst clinical study investigating the utility of vaginal buffer capacity in predicting preterm labor. Furthermore, the present study can provide evidence regarding the cost-effectiveness of using pH and buffer capacity for diagnostic purposes and an ongoing
retrospective survey is currently being conducted to estimate the direct and indirect costs of preterm labor-associated outpatient visits and hospitalizations.
Prediction of spontaneous preterm delivery remains a challenge in obstetric medicine. There has been limited success in attempts to accu- rately predict whether preterm labor will result in preterm delivery or whether the pregnancy will continue to term. In previous studies, cervical-length measurements using transvaginal ultrasonography and the presence of fFN in the cervicovaginalfluid have been described as reliable markers for predicting preterm delivery[21,22]. Tanvir et al.
[21]reported that cervical-length measurements, made at patients' mid-trimester prenatal scan, are a safe, accurate, and reproducible method for identifying the risk of preterm delivery, demonstrating high specificity and NPV for this method in predicting preterm delivery.
Furthermore, fFN has been found to be increased in patients at risk of experiencing spontaneous preterm delivery[22]. fFN demonstrated high NPV in predicting spontaneous preterm delivery, but not in predicting preterm labor. Consequently, a negative result with an fFN Table 4
Predictive value of vaginal mucus sample buffer capacity in diagnosing preterm labor or preterm birth.
Patient group Patient samples
included
Buffer capacitya Pvalue Optimal cut-off value from ROC curve
AUC (95% CI) Sensitivity Specificity PPV NPV
Control patients All samples 0.743 ± 0.372 (0.617) 0.014 0.578 0.608 (0.528–0.688) 0.695 0.57 0.347 0.85
Patients exhibiting symptoms of preterm labor
All samples 0.668 ± 0.457 (0.552)
Control patients Initial sample only 0.731 ± 0.360 (0.604) 0.436 0.578 0.549 (0.435–0.664) 0.704 0.542 0.311 0.839 Patients exhibiting symptoms of
preterm labor
Initial sample only 0.716 ± 0.529 (0.555) Patients who delivered preterm after
demonstrating symptoms of preterm labor
All samples 0.667 ± 0.452 (0.555) 0.62 0.495 0.536 (0.38–0.693) 0.4 0.824 0.625 0.651 Patients who delivered at term after
demonstrating symptoms of preterm labor
All samples 0.669 ± 0.461 (0.551) Patients who delivered preterm after
demonstrating symptoms of preterm labor
Initial sample only 0.671 ± 0.301 (0.571) 0.3 0.613 0.378 (0.155–0.601) 0.818 0.25 0.429 0.667 Patients who delivered at term after
demonstrating symptoms of preterm labor
Initial sample only 0.747 ± 0.638 (0.542)
Abbreviations: ROC, receiver operating characteristic; AUC, area under the curve; CI, confidence interval; PPV, positive predictive value; NPV, negative predictive value.
aValues given as mean ± SD (median).
Fig. 5.Box and whisker plot of vaginal buffer capacity from all cohort-2 samples collected from the control group, patients displaying symptoms of preterm labor who experienced term delivery, and patients symptomatic for preterm labor who experienced preterm delivery. Boxes represent the interquartile range and the line within each box represents the median value. Whiskers indicate the 10th and 90th percentiles, respectively. Outlier values are indicated by crosses.
Fig. 6.ROC curve of the use of vaginal buffer capacity for predicting if patients were currently experiencing symptoms of preterm labor. The optimal buffer capacity cutoff was 0.578, the specificity was 0.581, and the sensitivity was 0.644. Abbreviation: ROC, receiver operating curve.
test could help in reducing the use of unnecessary interventions and prophylaxis for patients who do not require them[22]. However, de- spite diagnostic advances, no ideal marker has been found for predicting preterm labor or delivery.
There are several limitations that should be considered when evalu- ating the results of the present study. First, the results of the present study are based on study samples from only one region. Additionally, the significant shortcomings of the present study include that the relatively small sample size prevents the evaluation of outcomes such as earlier preterm delivery among patients experiencing preterm labor. Whereas differences between the study groups at recruitment were observed, no changes in vaginal-mucus pH were detected as nor- mal pregnancies in the control group progressed. Considerable work is needed to evaluate whether the use of pH or buffer capacity could assist in identifying which patients experiencing preterm labor will go on to undergo preterm delivery and in identifying patients who are asymp- tomatic but are at increased risk of spontaneous preterm delivery.
Second, it is possible that both markers could have been influenced by common resident vaginal microflora. Infection is a leading cause of preterm delivery and the presence of several anaerobic or facultative microorganisms in the vagina could impact on the risk of preterm deliv- ery, possibly through patients' immune responses[23]. In the present study, vaginal-swab specimens were not tested to examine vaginal microflora. Microflora alterations could explain differences in suscepti- bility to preterm delivery between individual patients[24]. Evaluating the effectiveness of the combined or sequential use of pH and buffer- capacity tests, in addition to analyses of patient microflora, warrants further research.
Finally, vaginal-swab specimens were not tested for the presence of fFN, which has been demonstrated to have a sensitivity, specificity, PPV, and NPV of 66.7%, 87.9%, 36.4%, and 96.2%, respectively, in predicting preterm delivery within 7 days of testing[25]. Additionally, the present study did not include cervical-length measurements. Future studies should examine whether the addition of vaginal pH and buffer capacity could improve on existing techniques for predicting which patients are at risk of spontaneous preterm delivery.
In conclusion, the present preliminary study could provide thefirst evidence that vaginal pH and buffer capacity measurements have pre- dictive value for preterm labor. More studies are necessary to develop practical criteria for predicting preterm delivery specifically and not preterm labor, which may or may not proceed to preterm delivery;
this could be useful in recognizing susceptible individuals and preventing preterm delivery.
Supplementary data to this article can be found online athttp://dx.
doi.org/10.1016/j.ijgo.2015.11.018.
Acknowledgements
This study was supported by a Grant-in-aid for Scientific Research from the Ministry of Education, Science and Culture of Japan granted to the Department of Obstetrics and Gynecology, Nara Medical University (Hiroshi Kobayashi).
Conflict of interest
The authors have no conflicts of interest.
References
[1]Goldenberg RL, Culhane JF, Iams JD, Romero R. Epidemiology and causes of preterm birth. Lancet 2008;371(9606):75–84.
[2]Liong S, Di Quinzio MK, Fleming G, Permezel M, Rice GE, Georgiou HM. Prediction of spontaneous preterm labour in at-risk pregnant women. Reproduction 2013;
146(4):335–45.
[3]Borg F, Gravino G, Schembri-Wismayer P, Calleja-Agius J. Prediction of preterm birth.
Minerva Ginecol 2013;65(3):345–60.
[4]Iams JD, Goldenberg RL, Meis PJ, Mercer BM, Moawad A, Das A, et al. The length of the cervix and the risk of spontaneous premature delivery. National Institute of Child Health and Human Development Maternal Fetal Medicine Unit Network. N Engl J Med 1996;334(9):567–72.
[5]Crane JM, Hutchens D. Transvaginal ultrasonographic measurement of cervical length in asymptomatic high-risk women with a short cervical length in the previous pregnancy. Ultrasound Obstet Gynecol 2011;38(1):38–43.
[6]Choi SJ, Park SD, Jang IH, Uh Y, Lee A. The prevalence of vaginal microorganisms in pregnant women with preterm labor and preterm birth. Ann Lab Med 2012;
32(3):194–200.
[7]Malak TM, Sizmur F, Bell SC, Taylor DJ. Fetalfibronectin in cervicovaginal secretions as a predictor of preterm birth. Br J Obstet Gynaecol 1996;103(7):648–53.
[8]Elizur SE, Yinon Y, Epstein GS, Seidman DS, Schiff E, Sivan E. Insulin-like growth factor binding protein-1 detection in preterm labor: evaluation of a bedside test.
Am J Perinatol 2005;22(6):305–9.
[9]Lockwood CJ, Senyei AE, Dische MR, Casal D, Shah KD, Thung SN, et al. Fetalfibronec- tin in cervical and vaginal secretions as a predictor of preterm delivery. N Engl J Med 1991;325(10):669–74.
[10]Honest H, Bachmann LM, Gupta JK, Kleijnen J, Khan KS. Accuracy of cervicovaginal fetalfibronectin test in predicting risk of spontaneous preterm birth: systematic review. BMJ 2002;325(7359):301.
[11]Vis JY, Wilms FF, Oudijk MA, Porath MM, Scheepers HC, Bloemenkamp KW, et al.
Cost-effectiveness offibronectin testing in a triage in women with threatened preterm labor: alleviation of pregnancy outcome by suspending tocolysis in early labor (APOSTEL-I trial). BMC Pregnancy Childbirth 2009;9:38.
[12]Abbott DS, Radford SK, Seed PT, Tribe RM, Shennan AH. Evaluation of a quantitative fetalfibronectin test for spontaneous preterm birth in symptomatic women. Am J Obstet Gynecol 2013;208(2):122.e1–6.
[13]van Baaren GJ, Vis JY, Wilms FF, Oudijk MA, Kwee A, Porath MM, et al. Predictive value of cervical length measurement andfibronectin testing in threatened preterm labor. Obstet Gynecol 2014;123(6):1185–92.
[14]Paternoster D, Riboni F, Vitulo A, Plebani M, Dell'Avanzo M, Battagliarin G, et al.
Phosphorylated insulin-like growth factor binding protein-1 in cervical secretions and sonographic cervical length in the prediction of spontaneous preterm delivery.
Ultrasound Obstet Gynecol 2009;34(4):437–40.
[15]Kallioniemi H, Rahkonen L, Heikinheimo O, Paavonen J. Early pregnancy vaginal fluid phosphorylated insulin-like growth factor binding protein-1 predicts preterm delivery. Prenat Diagn 2013;33(4):378–83.
[16]Pearce BD, Grove J, Bonney EA, Bliwise N, Dudley DJ, Schendel DE, et al. Interrelation- ship of cytokines, hypothalamic–pituitary-adrenal axis hormones, and psychosocial variables in the prediction of preterm birth. Gynecol Obstet Invest 2010;70(1):40–6.
[17]Patacchioli FR, Perrone G, Merlino L, Simeoni S, Bevilacqua E, Capri O, et al.
Dysregulation of diurnal salivary cortisol production is associated with spontaneous preterm delivery: a pilot study. Gynecol Obstet Invest 2013;76(1):69–73.
[18]Lagerlöf F, Oliveby A. Caries-protective factors in saliva. Adv Dent Res 1994;8(2):
229–38.
[19]Ruiz Miravet A, Montiel Company JM, Almerich Silla JM. Evaluation of caries risk in a young adult population. Med Oral Patol Oral Cir Bucal 2007;12(5):E412–8.
[20]Lussi A, von Salis-Marincek M, Ganss C, Hellwig E, Cheaib Z, Jaeggi T. Clinical study monitoring the pH on tooth surfaces in patients with and without erosion. Caries Res 2012;46(6):507–12.
[21]Tanvir Ghose. S, Samal S, Armugam S, Parida P. Measurement of cervical biometry using transvaginal ultrasonography in predicting preterm labor. J Nat Sci Biol Med 2014;5(2):369–72.
[22]Foster C, Shennan AH. Fetalfibronectin as a biomarker of preterm labor: a review of the literature and advances in its clinical use. Biomark Med 2014;8(4):471–84.
[23]Romero R, Espinoza J, Chaiworapongsa T, Kalache K. Infection and prematurity and the role of preventive strategies. Semin Neonatol 2002;7(4):259–74.
[24]Verstraelen H, Verhelst R, Roelens K, Claeys G, Weyers S, De Backer E, et al. Modified classification of Gram-stained vaginal smears to predict spontaneous preterm birth:
a prospective cohort study. Am J Obstet Gynecol 2007;196(6):528.e1–6.
[25]Liong S, Di Quinzio MK, Fleming G, Permezel M, Rice GE, Georgiou HM. New biomarkers for the prediction of spontaneous preterm labour in symptomatic pregnant women: a comparison with fetalfibronectin. BJOG 2015;122(3):370–9.