A system for measuring the pattern of cell divisions in Caenorhabditis elegans embryos
Shugo Hamahashi
School of Science for Open and Environmental Systems Graduate School of Science and Technology
Keio University
A dissertation submitted for the degree of Doctor of Philosophy
2005
Summary
The pattern of cell divisions provides crucial information to understand the mechanism of development in multicellular organisms. The pattern of cell divisions holds the position and time of individual cell and relationships between mother cells and their daughter cells. Many analyses of development often compare patterns of cell divisions, where differences of timings or orientations of cell divisions and/or positions of cells among wild-type and mutant embryos are investigated. The scales of these analyses are getting larger, so that the importance of objectivity and productivity in measuring the pattern of cell divisions are getting more critical. However, the patterns of cell divisions in Caenorhabditis elegans embryo has been manually measured by direct observation with a microscope, so that the objectivity and productivity of the measurement has been seriously low.
Therefore, I developed a system that objectively and productively measures a pattern of cell divisions of C. elegans embryo. This system first automatically detects nuclei in a set of images recorded by the 4-dimensional differential interference contrast (DIC) microscope system using nuclear regions that are image regions detecting nuclei in DIC microscope images. The nuclear regions are produced using the difference in image textures between the nucleus and the cytoplasm distinguished by local image entropy. This system then automatically identifies the 3-dimensional (3D) region of individual nuclei by grouping nuclear regions, tracks these 3D regions, and outputs the tracking trajectory. This tracking trajectory is the measured pattern of cell divisions. This system measures a pattern of cell divisions from fertilization to the onset of gastrulation of a C. elegans embryo. This system is the first embodiment that enables the objective and productive measurement of the pattern of cell divisions, which would greatly contribute to the future studies of development in multicellular organism.
Acknowledgments
I am sincerely grateful to my advisor, Dr. Shuichi Onami, who provided unfailing guidance and invaluable advices and comments. I am greatly indebted to Dr. Hideharu Amano for his support and helpful comments. I am grateful to Dr. Yuichiro Anzai, Dr. Yoshio Ohno and Dr. Motonori Hoshi for helpful comments. I would like to thank Dr. Hiroaki Kitano for his helpful comments and discussions. I would like to thank Dr. Mario Tokoro who gave me an opportunity to study in the field of computational biology.
I am grateful to Dr. Koji Kyoda who helped the software development and provided helpful comments and discussions. I would like to thank Mineo Morohashi and Dr. Akatsuki Kimura for their helpful comments and discussions. I would like to thank Mitsuru Urai, Takeshi Umezawa, Yasunori Osana, Dr. Mitsunobu Kunishi and all members in the Onami, Anzai and Amano laboratories for their supports. I would like to thank Dr. Michimune Kohno and Dr. Takahiro Sasaki for helpful advises. I would like to thank Masato Ito, Kiichi Kitajima, Yuichiro Maeda, Kazuhiro Shitama, Shokei Suda and Yoshiteru Takeshima for their continued encouragements.
I would like to thank Dr. Kenneth Kemphues for providing the par-1 (KK288) mutant. I would like to thank Dr. Julie Ahringer, Cambridge University Technical Services Limited and UK MRC Human Genome Mapping Project Resource Center, for providing C. elegans chromosome 1 RNAi library.
Finally, I would like to thank my parents, Masakuni and Nobue, for their continued encouragement and support. I would like to thank my brother, Taizo, for his help and encouragement.
Shugo Hamahashi December 2005
Table of contents
Summary...1
Acknowledgments ...2
Table of contents...3
List of Figures...4
List of Tables ...5
List of Abbreviations ...6
Publications arising from this work ...7
Chapter 1 Introduction...8
Chapter 2 Basic system: a system detecting the nuclei ...13
2.1 Introduction ...13
2.2 Results...14
2.3 Discussion ...29
2.4 Summary ...35
Methods...35
Chapter 3 Main system: a system measuring the pattern of cell divisions ...37
3.1 Introduction ...37
3.2 Results...38
3.3 Discussion ...53
3.4 Summary ...57
Methods...57
Chapter 4 Derivative system: a system measuring the spindle orientation...59
4.1 Introduction ...59
4.2 Results...60
4.3 Discussion ...66
4.4 Summary ...67
Methods...67
Chapter 5 Conclusion ...69
5.1 Summary of results ...69
5.2 Prospects ...70
References...72
List of Figures
Figure 1.1 Cell division pattern ...8
Figure 2.1 Overview of 4-dimensional differential interference contrast microscope images of Caenorhabditis elegans embryo...14
Figure 2.2 Effect of window size and threshold value on production of low-entropy regions ..16
Figure 2.3 Values of local image entropy and Yasuda et al.’s measure ...21
Figure 2.4 Low-entropy regions of different focal planes and different time points ...23
Figure 2.5 Overview of forward and backward trackings...26
Figure 2.6 Low-entropy regions in a par-1 embryo...31
Figure 2.7 Low-entropy regions in a tba-2(RNAi) embryo...32
Figure 3.1 Overview of the system and the visualization software ...39
Figure 3.2 Snapshot of graphical user interface in the nuclear detection module ...40
Figure 3.3 Low-entropy regions produced by the local image entropy ...41
Figure 3.4 Nuclear regions after the removal of non-nuclear regions ...42
Figure 3.5 Nuclear regions separately produced by the nuclear detection module...43
Figure 3.6 Step 1 and step 2 in the nuclear lineaging module ...45
Figure 3.7 Falsely merged nuclear region produced by the nuclear detection module...46
Figure 3.8 Overview of the error-correction module...48
Figure 3.9 Images of wild-type and par-1 embryos in 2- and 4-cell stages...52
Figure 4.1 Detection of spindles in a Caenorhabditis elegans embryo ...60
Figure 4.2 Orientation of nuclear regions of spindle ...61
Figure 4.3 Spindle orientations in a wild-type embryo...62
Figure 4.4 Spindle orientations in a par-3(RNAi) embryo...64
Figure 4.5 Time-transitions of spindle orientations ...65
List of Tables
Table 2.1 Discriminability and computation time of widely-used texture measures...19 Table 2.2 Performance of nuclear detection by low-entropy regions and those selected by
forward and backward trackings...24 Table 2.3 Number of image sets for which advanced trackings detected nuclei with perfect
sensitivity...24 Table 2.4 Specificity of nuclear detection by low-entropy regions selected by advanced
forward and backward trackings...28 Table 3.1 Required time for measuring a cell division pattern of wild-type embryo from one- to 24-cell stages ...50 Table 3.2 A part of a cell division pattern from 2- to 3-cell stages of a wild-type embryo ...50 Table 3.3 Verification of measured cell division patterns from one- to 24-cell stages of wild-
type embryos...51 Table 3.4 Time periods between cell stages in wild-type and par-1 embryos...52 Table 3.5 Comparison of distance between nuclei of 4-cell stage in wild-type and par-1 embryos...53
List of Abbreviations
2D two-dimensional
3D three-dimensional
4D four-dimensional
CDP cell division pattern
DIC differential interference contrast ECM error-correction module
GUI graphical user interface NDM nuclear detection module NDS nuclear detection system NLM nuclear lineaging module
PC personal computer
RAM random access memory RNA ribonucleic acid RNAi RNA interference
Publications arising from this work
Onami, S., Hamahashi, S., Nagasaki, M., Miyano, S. and Kitano, H. Automatic acquisition of cell lineage through 4D microscopy and analysis of early C. elegans embryos. In Foundations of Systems Biology. (Ed) Kitano, H., MIT Press, Cambridge, Massachusetts, 39-55, 2001.
Hamahashi, S., Onami, S. and Kitano, H. Detection of nuclei in 4D Nomarski DIC microscope images of early Caenorhabditis elegans embryos using local image entropy and object tracking.
BMC Bioinformatics 6, 125, 2005.
Hamahashi, S. and Onami, S. Objective measurement of spindle orientation in early Caenorhabditis elegans embryo. Genome Informatics 16, 86-93, 2005.
Hamahashi, S., Kitano, H. and Onami, S. A system for identification of cell division patterns in early embryogenesis of Caenorhabditis elegans using image processing and object tracking. Institute of Electronics, Information and Communication Engineers, 2006, (accepted).
Chapter 1 Introduction
The pattern of cell divisions is a crucial piece of information in studies of development in multicellular organisms (hereafter a pattern of cell divisions is called a cell division pattern (CDP)).
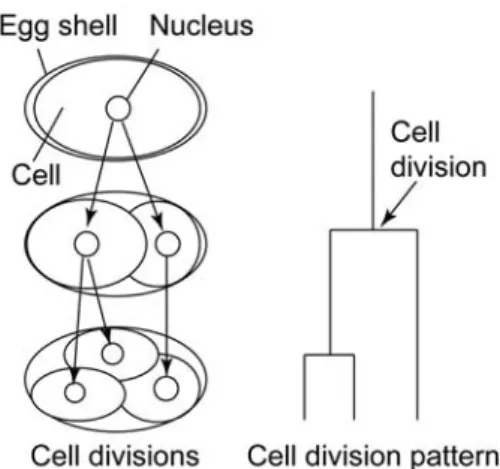
CDP holds timings and orientation of cell divisions and relationships between mother cells and their daughter cells in terms of cell lineage information (Figure 1.1). CDP is described by following cells during embryogenesis in individual organisms (Sulston et al., 1983; reviewed by Stern and Fraser, 2001; Chisholm, 2002). A fertilized egg—a single cell—develops into a multicellular organism through many spatially and temporally dynamic cellular activities, including cell division, cell migration, cell differentiation and cell death. In Caenorhabditis elegans, CDPs and cell fates are correlated (Sulston et al., 1983), where mutations affect CDPs such as timings and orientations of cell divisions. CDP is greatly contributing to understanding the mechanisms underlying the development of the organism.
Figure 1.1 Cell division pattern. A conceptual schematic diagram is shown to the left. The cell division pattern corresponding to the conceptual schematic diagram is shown to the right.
CDP is mostly the same as the cell lineage but more informative about the positions of cells. The cell lineage is described with timings and orientations of cell divisions and relationships between mother cells and their daughter cells (Sulston et al., 1983). The orientations of cell divisions are determined using positions of nuclei in cells, but positions of nuclei themselves are not described in the cell lineage. Because my system presented in this dissertation measures both the cell lineage and the positions of nuclei, I use the term “CDP” to call information holding both of them instead of the term “cell lineage”.
I chose C. elegans as a model in my work because of the importance of the animal in biology. C.
elegans is the simplest multicellular organism that has been most extensively studied in biology (Wood, 1988; Riddle et al., 1997). The total number of cells is only about a thousand (Wood, 1988).
In spite of the simplicity in number of cells, C. elegans has differentiated cells, such as an epidermis, intestine, excretory system, and nerve and muscle cells, which makes this animal an ideal model for anatomically analyzing the development of multicellular organisms. Besides, C. elegans is an ideal model for genetic analysis. C. elegans has a short life cycle; the embryogenesis takes about 12 hours and the generation cycle takes about 3 days (Wood, 1988). Thus, the animal is suited for genetic experiments. Functions of genes are conserved from C. elegans to mammals (Yuan et al., 1993;
Hengartner and Horvitz, 1994), which makes the genetic analysis of this animal suggestive for understanding higher multicellular organisms. These features make C. elegans an excellent model for study in biology. Consequently, I considered that the animal is suited for a model in my work.
CDP has been manually measured in C. elegans. Timings and orientations of cell divisions are manually identified by human recognition, where the orientations are determined using positions of nuclei because the nucleus is generally positioned at the center of a cell and is the most noticeable organelle in a cell (Sulston et al., 1983). The positions of nuclei are measured by direct observation or using recorded images with a Nomarski differential interference contrast (DIC) light microscope (hereafter this microscope is called a DIC microscope) (Nomarski and Weill, 1955). The four- dimensional (4D) DIC microscope (Hird and White, 1993; Thomas et al., 1996) is usually used to automatically record a set of images in multiple focal planes and at multiple time points for a specimen (hereafter a set of these images is called a set of 4D DIC microscope images). Nuclei move 3-dimensionally within a time interval of a set of 4D DIC microscope images. To measure CDP, individual nuclei at adjacent time points are identified and are followed, and the relationships between mother nuclei and their daughter nuclei are identified and are followed by eye observation.
The objectivity and productivity in measuring CDP have been low because the measurement has been mostly a manual process as described above. Analyses of development often compare CDPs (such as timings, orientations of cell divisions and/or positions of nuclei) among wild-type and mutant embryos (Kemphues et al., 1988), where the high objectivity in the measurements is an important matter. C. elegans has about twenty thousand genes (The C. elegans Sequencing Consortium, 1998). The recent establishment of RNA interference (RNAi) has enabled us to make each of large numbers of genes silent (Fire et al., 1998). Using such a benefit of RNAi, large-scale functional genomic analyses have been initiated (Fraser et al., 2000; Gönczy et al., 2000;
Sönnichsen et al., 2005). To investigate the functions of genes using CDPs in such a large-scale manner, the high productivity of the measurement of CDP is an important matter, too.
To help the manual measurement of CDP in C. elegans, two computer-aided systems have been developed, namely SIMI BioCell (Schnabel et al., 1997) and 3D-DIASemb (Heid et al., 2002). SIMI BioCell has a graphical user interface (GUI) that can display a set of 4D DIC microscope images, help identifying the positions of nuclei, and record these identified positions. 3D-DIASemb is similar to SIMI BioCell but can also record and display the perimeters of nuclei and cells. Although both of these systems help greatly to follow nuclei through time points in a set of 4D DIC microscope images, detecting and following nuclei are manually processed, where the positions of nuclei are determined by human recognition and those manual processes are time-consuming and labor-intensive. Therefore, the objectivity and productivity in measuring CDP are low in these systems.
To increase the objectivity and productivity in measuring CDP, automating the processes in the measurement will be an effective strategy. If detecting nuclei is automated, the positions of nuclei are expected to be measured without human subjectivity and without time and labor, i.e. positions of nuclei will be measured objectively and productively. Similarly, if following nuclei is automated, the same nucleus in adjacent time points (in a set of 4D DIC microscope images) is identified objectively and productively. Yasuda et al. attempted to develop such an automated system (Yasuda et al., 1999). Yasuda et al.’s system automatically detects and follows nuclei in a set of 4D DIC microscope images. However, because their system can not detect nuclei that are in the process of cell division, their system can not measure the timing of cell division which is an important element of CDP. Furthermore, their system needs laborious hand-tuning of system’s parameters every time a new set of 4D DIC microscope images is applied, which is a serious problem in productivity of the measurement of CDP when the system is applied to large-scale analyses (Fraser et al., 2000; Gönczy et al., 2000; Sönnichsen et al., 2005). Besides, the maximum cell stage of their measured CDP is limited under eight-cell stage. Consequently, their system requires marked improvement before it becomes applicable to analyses that use CDPs.
In this dissertation, I present a system that objectively and productively measures a CDP in a set of 4D DIC microscope images of C. elegans embryo. Actually, I present three systems that I have developed during my work (Hamahashi and Onami, 2005; Hamahashi et al., 2005; Hamahashi et al., 2006). The first system is a basic system that detects nuclei in C. elegans embryo. The second system is the main system that measures CDP in C. elegans embryo. The third system is a derivative system that measures spindle orientations in C. elegans embryo. The strategy to increase the
objectivity and productivity of the measurement in these systems is the automation of the measurements.
Basic system: The first system attained the highly objective and productive detection of nuclei in a set of 4D DIC microscope images of C. elegans. This system automatically detects nuclei using a difference in image textures between the nucleus and the cytoplasm in DIC microscope images. The difference is distinguished by local image entropy (Handmann et al., 2000) which makes the system applicable to different sets of 4D DIC microscope images without the need of hand-tuning of system’s parameters. The system produces image regions that detect nuclei (hereafter an image region that detect a nucleus is called a nuclear region) but also produces image regions that do not detect nuclei (they detect such as the boundaries between cells and the spaces between the embryo and the eggshell). This system automatically selects nuclear regions from produced regions using an object-tracking algorithm (Geerts et al., 1987; Lee et al., 1991; Awasthi et al., 1994). The object- tracking algorithm allows selecting nuclear regions detecting nuclei that are both in and not in the process of cell division, which makes this system possible to detect nuclei that are in the process of cell division. Details about this system are explained in Chapter 2.
Main system: The second system attained the highly objective and productive measurement of CDP in C. elegans. This system is the main system to measure CDP. This system first produces nuclear regions from a set of 4D DIC microscope images using the basic system. Then, this system identifies the 3-dimensional (3D) region of each nucleus by a unit that groups nuclear regions detecting the same nucleus (explained in section 3.2.3). Finally, this system tracks units along a time line and outputs a tracking trajectory that is the measured CDP. If a unit groups inappropriate nuclear regions, this system detects the unit and corrects it (such as cuts and/or merges nuclear regions) to make a new unit that groups modified nuclear regions (explained in section 3.2.4). If this system inappropriately tracks units (nuclei detected by a tracker and a tracked units are different), this system detects this failure and corrects it (explained in section 3.2.4). This system allows almost automatically measuring a CDP in a C. elegans embryo from one- to 24-cell stages, where the objectivity and productivity of the measurement are high.
Derivative system: The third system attained the objective and productive measurement of spindle orientation during second cell divisions in C. elegans embryo. This system is a derivative system that is developed based upon the main system, which demonstrates the applicability of the main system. Spindle orientations are often measured in many analyses of development (Kemphues et al., 1988; Cheng et al., 1995; Watts et al., 1996), where the spindle orientation correlates with the orientation of cell division and is suggestive for understanding the mechanism of development. The
objectivity and productivity are the important matters in these analyses. This system first automatically detects spindle using nuclear region produced by a module (the nuclear detection module explained in section 3.2.2) in the main system, where the objectivity and productivity in detecting spindles are high. Then, this system measures the spindle orientation using the regression line (Montgomery and Peck, 1982), where the objectivity and productivity in acquiring the orientations are high. Consequently, this system objectively and productively measures the spindle orientation in C. elegans embryo.
Chapter 2 Basic system: a system detecting the nuclei
2.1 Introduction
Yasuda et al. attempted to automate nuclear detection (Yasuda et al., 1999). Their system detected nuclei from two- to eight-cell stages in a specific set of 4D DIC microscope images using several edge detection operators (Prewitt, 1970; Kirsch, 1971). However, their system requires laborious hand-tuning of parameters every time a new set of 4D DIC microscope images was applied, because the edge detection operators were very sensitive to differences in image quality (e.g., brightness, contrast) among sets of images; the differences could be controlled but not eliminated (see section 2.2.4 and section 2.3.1). In addition, their system was not able to detect the nucleus that was in the process of cell division, because their detection of nucleus relied on the shape of nucleus being round (and therefore not in the process of division).
In this chapter, I present a system that I have developed to automate the detection of nuclei in a set of 4D DIC microscope images of C. elegans embryo (Hamahashi et al., 2005). In this system, local image entropy is used to produce regions of the images that have the image texture of the nucleus.
From these regions, those that actually detect nuclei are manually selected at the first and last time points of the image set, and an object-tracking algorithm (Geerts et al., 1987; Lee et al., 1991;
Awasthi et al., 1994) then selects regions that detect nuclei in between the first and last time points.
The use of local image entropy makes the system applicable to multiple image sets without the need to tune parameters. The use of an object-tracking algorithm enables the system to detect nuclei in the process of cell division. The system detected nuclei with high sensitivity and specificity from the one- to 24-cell stages.
2.2 Results
2.2.1 Appearance of nuclei in a set of 4D DIC microscope images
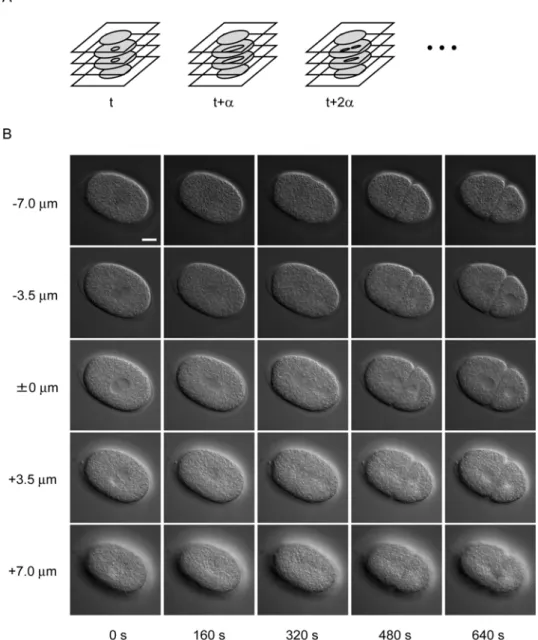
Figure 2.1 Overview of 4-dimensional differential interference contrast microscope images of Caenorhabditis elegans embryo. (A) Schematic of 4- dimensional (4D) differential interference contrast (DIC) microscope images.
Digital images of a developing embryo were recorded in multiple focal planes and a set of multifocal images was recorded with a fixed time interval, α. (B) Example of 4D DIC microscope images of a C. elegans embryo. Each column shows multifocal images recorded at a specific time point, with 3.5 µm between two focal planes. Each row shows time-lapse images recorded in a specific focal plane with 160 s between two time points. Bar is 10 µm.
The appearance of nuclei of C. elegans embryos in a set of 4D DIC microscope images (Figure 2.1) varies among different focus levels and different developmental stages. The nucleus appears as a smooth, round region in the center of the cell, the cytoplasm of which appears as a rough region at all developmental stages. The boundary of the nucleus is apparent when the focus level is close to the level of the center of the nucleus (0 µm, 0 s in Figure 2.1B). As the focus level becomes higher or lower, the nucleus becomes smaller, reflecting the 3D shape of the nucleus and the boundary of the nucleus becomes blurred (–3.5 µm and +3.5 µm in Figure 2.1B). The nucleus becomes invisible when the focus level goes beyond the level of the upper or lower end of the nucleus (–7.0 µm and +7.0 µm in Figure 2.1B). As the embryo develops, the number of cells in the embryo increases through repeated cell divisions, each of which produces two daughter cells from a single mother cell.
When cell division begins, the nucleus begins to elongate and the boundary of the nucleus becomes blurred (160 s in Figure 2.1B). As cell division progresses, the nucleus continues to elongate (320 s in Figure 2.1B). The elongated nucleus is fragmented into several pieces (480 s in Figure 2.1B), which then form daughter nuclei in two daughter cells (640 s in Figure 2.1B). The size of the nuclei gradually decreases as the embryo develops and the number of nuclei increases (8 µm in diameter at the one-cell stage and 5 µm at the 24-cell stage). Although the appearance of the nuclei in the images varies among different focal planes and different developmental stages, a smooth image texture is a common feature of the appearance of nuclei.
2.2.2 Detection of nuclei using regions of low local image entropy
To detect nuclei in the 4D DIC microscope images, I used a common feature of nuclei in the images, that is, their smooth image texture (see previous section, Figure 2.1B). To quantify the smoothness of image texture in various regions of an image, I used local image entropy (Handmann et al., 2000), which computes the image entropy (Pratt, 1991) of a small area surrounding a point of interest in an image. Image entropy represents the smoothness of image texture; its value becomes high when the texture is rough and low when the texture is smooth. Because smooth image texture is a common feature of the appearance of nuclei in 4D DIC microscope images, I expected local image entropy to be lower in the nuclei than in the cytoplasm. An important feature of image entropy is low sensitivity to differences in image quality, particularly in terms of the brightness of the image. Therefore, I expected that local image entropy would quantify the smoothness of image texture in multiple images in a manner that was not sensitive to differences in quality among images. (The validity of choosing image entropy from widely-used texture measures is evaluated in section 2.2.3.)
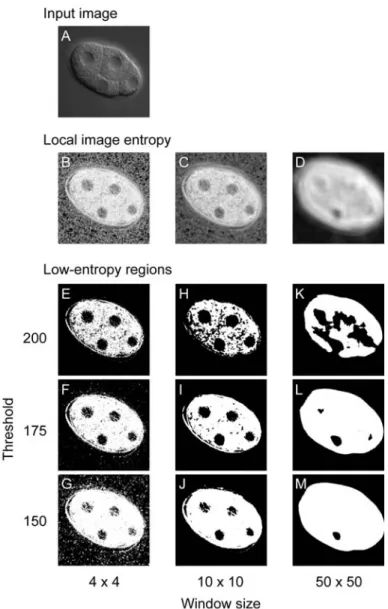
Figure 2.2 Effect of window size and threshold value on production of low- entropy regions. (A) Input image. Low-entropy regions were produced from an image of a four-cell-stage embryo using various window sizes and threshold values. (B–D) Effect of window size on image conversion using local image entropy. The input image was applied to the image conversion using window sizes of 4 × 4 (B), 10 × 10 (C), and 50 × 50 (D) pixels. Darker colors represent lower local image entropies. (E–M) Effect of window size and threshold value on low-entropy regions. Low-entropy regions (black) were produced using threshold values of 200 (E, H, K), 175 (F, I, L), or 150 (G, J, M) from the images resulting from the image conversion, using window sizes of 4 × 4 (E–
G), 10 × 10 (H–J) or 50 × 50 (K–M) pixels. A window of 10 × 10 pixels corresponds to that of 1 µm × 1 µm.
I defined an image conversion using local image entropy as follows. Let [xij] be the matrix representing a digitized input image. Then the result of image conversion using local image entropy in an X × Y pixel window is an image [yij], where the value of yij equals the entropy of the input image lying in the X × Y pixel window Wij whose top left is xij. The image entropy is
, where N is the number of gray levels and P(k) is the probability of occurrence of gray level k in W
∑
=−−
= kN01 ( )log2 ( )
ij Pk P k
y
ij. Because of the presence of the window, the number of columns and rows of [yij] is smaller than those of [xij] by X – 1 and Y – 1, respectively.
To determine whether local image entropy could effectively distinguish nuclei from cytoplasm in 4D DIC microscope images, I converted the images using various window sizes (from 2 × 2 to 50 × 50 pixels, results for 4 × 4, 10 × 10 and 50 × 50 pixels are shown in Figure 2.2). As expected, local image entropy was lower (darker) in the nuclei than in the cytoplasm (e.g., 10 × 10 window size in Figure 2.2). When I used a large (50 × 50) window, the difference in local image entropy between nuclei and cytoplasm became smaller. When I used a small (4 × 4) window, high-entropy spots (bright spots) appeared throughout the images. These results indicate that local image entropy effectively distinguishes nuclei from cytoplasm in 4D DIC microscope images. For images prepared in my experiments, 10 × 10 pixels (1 µm × 1 µm) appeared likely to be the optimal size of the window.
2.2.3 Evaluation of choosing image entropy from widely-used texture measures
There is a huge body of literature on texture analysis (Pratt, 1991; Tuceryan and Jain, 1998; Jahne et al., 1999). To evaluate the validity of choosing image entropy from many texture measures, I investigated 25 widely-used texture measures selected from all four texture analysis methods categorized by Tuceryan and Jain (Tuceryan and Jain, 1998). The investigated texture measures are listed as follows:
A. Statistical methods a. First-order statistics
1. Mean
2. Standard deviation 3. Skewness
4. Kurtosis 5. Energy 6. Entropy
b. Second-order statistics 1. Co-occurrence: energy
2. Co-occurrence: entropy 3. Co-occurrence: contrast 4. Co-occurrence: homogeneity 5. Co-occurrence: correlation 6. autocorrelation
B. Geometrical methods
1. Voronoi tessellation features 2. Structural methods
C. Model based methods
1. Markov random fields D. Signal processing methods
a. Spatial domain filters 1. Laplacian operator 2. Kirsch operator 3. Prewitt operator 4. Moment M00 5. Moment M01 6. Moment M02 7. Moment M10 8. Moment M11 9. Moment M20 b. Fourier domain filtering
1. Radial features of power spectrum
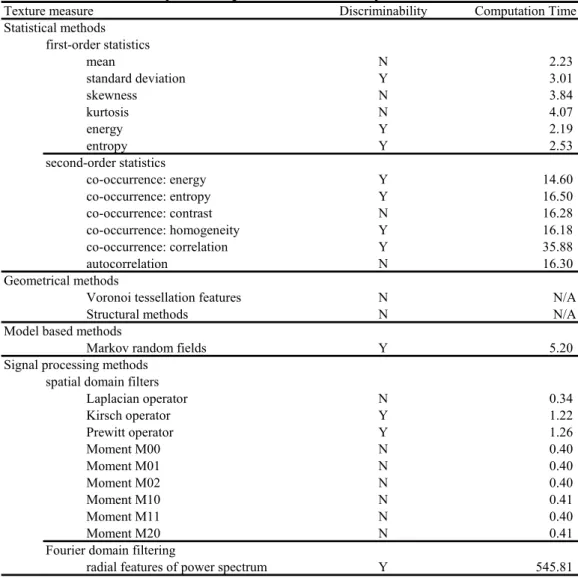
For the evaluation of the performance of each measure, I implemented them in accordance with methods given in the literature (Pratt, 1991; Tuceryan and Jain, 1998; Jahne et al., 1999) and applied them to my DIC microscope images of C. elegans embryos. The discriminability in image textures between the nucleus and the cytoplasm for each texture measure was judged using thresholding (Otsu, 1979) in which the value of each texture measure was binarized by its optimized threshold.
The computation time for each texture measure was recorded. I did not implement the Geometrical methods measures, because my DIC microscope images were not composed of texture elements (Tuceryan and Jain, 1998).
Of the resulting 23 measures, 11 measures discriminated between nucleus and cytoplasm in my DIC microscope images of a C. elegans embryo (standard deviation; energy; entropy; co-occurrence:
energy; co-occurrence: entropy; co-occurrence: homogeneity; co-occurrence: correlation; Markov
random field; Kirsch operator; Prewitt operator; and Fourier domain filtering). I concluded that, among these 11 measures, entropy provided the best performance for the NDS, as follows.
Entropy was better than the four second-order statistics measures (co-occurrence: energy; co- occurrence: entropy; co-occurrence: homogeneity; co-occurrence: correlation) and the Fourier domain filtering measure in terms of computation time. The computation time was at least 6.5 times longer than that of entropy in the case of these second-order statistics measures, and more than 200 times longer in the case of the Fourier domain filtering measure (Table 2.1). A shorter computation time is preferred in my system because my system was developed for detecting nuclei in 4D DIC microscope images of C. elegans embryos. A set of my 4D DIC microscope images usually consists of more than 6720 images from the one- to 24-cell stages.
Texture measure Discriminability Computation Time
Statistical methods first-order statistics
mean N 2.23
standard deviation Y 3.01
skewness N 3.84
kurtosis N 4.07
energy Y 2.19
entropy Y 2.53
second-order statistics
co-occurrence: energy Y 14.60
co-occurrence: entropy Y 16.50
co-occurrence: contrast N 16.28
co-occurrence: homogeneity Y 16.18
co-occurrence: correlation Y 35.88
autocorrelation N 16.30
Geometrical methods
Voronoi tessellation features N N/A
Structural methods N N/A
Model based methods
Markov random fields Y 5.20
Signal processing methods spatial domain filters
Laplacian operator N 0.34
Kirsch operator Y 1.22
Prewitt operator Y 1.26
Moment M00 N 0.40
Moment M01 N 0.40
Moment M02 N 0.40
Moment M10 N 0.41
Moment M11 N 0.40
Moment M20 N 0.41
Fourier domain filtering
radial features of power spectrum Y 545.81
"Y" and "N" mean "discriminable" and "not discriminable" respectively. Computation times were measured by a PC which used a 3.2 GHz Intel Pentium 4 processor with HT Technology and 2 GB of SDRAM memory. All programs were written in a programming language C++.
Table 2.1 Discriminability and computation time of widely-used texture measures
Entropy was better than the two spatial domain filters (Kirsch operator and Prewitt operator) and the Markov random field in terms of sensitivity to differences in image quality (see section 2.2.4 and section 2.3.1). For the Markov random field, in more than 10 different DIC microscope images of C.
elegans embryos, I tried but could not find a set of parameters with which the measure successfully discriminated the image textures between the nucleus and the cytoplasm.
Entropy was better than the two first-order statistics measures (standard deviation and energy) because entropy discriminated the image textures between the nucleus and the cytoplasm more clearly than did these two measures. Standard deviation, like entropy, is a texture measure widely- used to quantify the smoothness of image texture. In my test images, the standard deviation in the cytoplasmic region varied widely, and many small regions in the cytoplasm had standard deviations as small as in the nucleus. This wide variation in standard deviation in the cytoplasmic region may come from the dependency of standard deviation on actual pixel values in texture. Entropy does not depend on actual values in texture, but it does depend on the smoothness of texture. Energy discriminated between nucleus and cytoplasm far more clearly than did standard deviation. However, the difference in energy between the nucleus and cytoplasm was smaller than the difference in entropy.
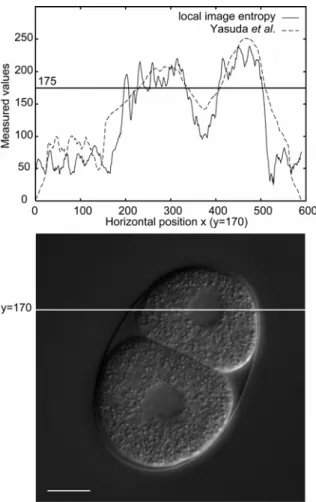
2.2.4 Sensitivities to the image quality of local image entropy and Yasuda et al.’s measure
I investigated whether local image entropy is less sensitive to image quality than Yasuda et al.’s measure, because less sensitivity is preferred to eliminate a laborious hand-tuning of system’s parameters. Yasuda et al.’s system (Yasuda et al., 1999) used a combination of edge-detection operator (the Kirsch or the Prewitt operators) and the blur filter to detect nuclei from DIC microscope images; the combination of the edge-detection operator and the blue filter was the Yasuda et al.’s measure. To investigate the sensitivities to the image quality of local image entropy and Yasuda et al.’s measure, I used both local image entropy and Yasuda et al.’s measure and quantified the smoothness of image texture (Figure 2.3).
The gradient of Yasuda et al.’s measure at the boundary between nucleus and cytoplasm was easier than that of local image entropy (Figure 2.3). This result indicates that the nuclear detection using Yasuda et al.’s measure is more sensitive to the differences in image quality.
Figure 2.3 Values of local image entropy and Yasuda et al.’s measure. The upper figure shows values measured by local image entropy and Yasuda et al.’s measure. 175 is a threshold value to binarize the texture measures; the produced regions will consist of the positions having larger values than the threshold value. The horizontal position in the upper figure corresponds to the horizontal position in the lower picture of y = 170. In the upper figure, the solid line shows the values of local image entropy and the broken line shows the values obtained by our earlier system (Yasuda et al., 1999). Bar is 10 µm.
2.2.5 Nuclear detection using low-entropy regions
To detect nuclei, I produced low-entropy regions (Figure 2.2E–M) applying thresholding (Otsu, 1979) to the images resulted from the image conversion of local image entropy. The low-entropy regions were produced as follows: neighboring pixels whose local image entropy was lower than the threshold were grouped, and the resulting group was defined as a low-entropy region. As expected, many of these low-entropy regions corresponded to nuclei in the original images, whereas the size and number of the regions depended on the threshold value. The shapes of the low-entropy regions approximated those of corresponding nuclei when the threshold value was set to 175 (Figure 2.2F, I, L). As the threshold value decreased, the regions became smaller and more fragmented (Figure 2.2G, J, M). As the threshold value increased, the regions became larger and more aggregated (Figure 2.2E,
H, K). These results indicate that low-entropy regions can be used to detect nuclei in 4D DIC microscope images. For images prepared in my experiments, 175 was likely to be the optimal threshold value. In addition to the low-entropy regions that corresponded to nuclei, many low- entropy regions were produced that did not correspond to nuclei. These low-entropy regions corresponded to regions that have similar (smooth) image textures to that of the nucleus, such as the boundaries between cells and the spaces between the embryo and the eggshell.
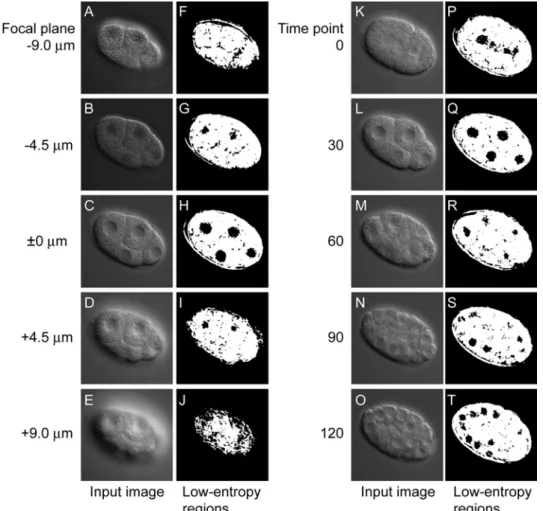
I evaluated the performance of nuclear detection in a set of 4D DIC microscope images by using low-entropy regions. For the evaluation, I produced low-entropy regions from five sets of images of C. elegans embryos using a 10 × 10 pixel window and a threshold value of 175 (Figure 2.4). Each set of images consisted of 10,080 images (56 focal planes × 180 time points = 10,080 images). I then calculated the sensitivity and specificity as measures of performance.
Sensitivity was defined as the ratio of the sum of the number of nuclei detected at each time point to the sum of the number of nuclei existing at each time point. A nucleus was considered to be
“detected” at a specific time point when it was detected by at least one low-entropy region at any focal plane at this specific time point. This definition of sensitivity is reasonable because of the difficulty in specifying the number of low-entropy regions that are expected to detect a given nucleus. The following three factors underlie this difficulty. First, a single nucleus is usually detected by several low-entropy regions in different focal planes at a single time point. Second, a single nucleus is sometimes detected by several low-entropy regions in the same focal plane at a single time point. Third, it is difficult to determine which focal plane is the top end and which is the bottom end of the focal planes at which a given nucleus is expected to be detected in low-entropy regions, because the appearance of the nucleus becomes gradually blurred as the focal plane becomes farther from the center of the nucleus (Figure 2.1B).
Specificity was defined as the ratio of the number of low-entropy regions detecting nuclei to the number of low-entropy regions produced. Because local image entropy is not sensitive to differences in image quality, particularly in terms of the brightness of the image, I expected that the performance of nuclear detection by examination of low-entropy regions would differ little among sets of 4D DIC microscope images.
Figure 2.4 Low-entropy regions of different focal planes and different time points. (A–E and K–O) Input images. (F–J and P–T) Low-entropy regions (black) produced from the input images. Low-entropy regions were produced from multifocal images of an embryo at a specific time point in the four-cell stage with 4.5 µm between two focal planes (A–E) and from time-lapse images of an embryo at a specific focal plane with 30 min between two time points (K–
L). The low-entropy regions produced are displayed to the right of each input image. The window size was 10 × 10 pixels and the threshold value was 175.
Low-entropy regions that actually detected nuclei were manually selected in five sets of 4D DIC microscope images of an embryo. The resulting five sets of low-entropy regions were used as references to calculate the sensitivity and specificity of nuclear detection. Sensitivity was calculated using low-entropy regions of all time points from time point 0 to that corresponding to the end of the 24-cell stage. Specificity was calculated using low-entropy regions at 11 time points, obtained by sampling every 10 time points from the beginning of the two-cell stage to the end of the 24-cell stage.
The number of time points from the beginning of the two-cell stage to the end of the 24-cell stage was 106 on average.
I obtained perfect (= 1.0) sensitivity for all sets of images from the one- to the 24-cell stages (Table 2.2). All nuclei were detected at any time point independently of whether or not they were in the process of cell division. To confirm that this perfect sensitivity was not solely a feature of the five sets of images examined, I produced low-entropy regions from 44 sets of images of C. elegans embryos using 10 × 10 pixel windows and threshold values of 175, and then calculated the sensitivity. I obtained perfect sensitivity for all 44 sets of images of embryos from the one- to the 24- cell stages (data not shown). Sensitivity became imperfect in the later stages of embryogenesis, i.e., around the 44-cell stage or later (data not shown). In contrast, very low (< 0.10) specificity was obtained for all sets of images (Table 2.2). In summary, low-entropy regions could be used to detect nuclei in a set of 4D DIC microscope images of C. elegans embryos from the one- to 24-cell stages with very high sensitivity and very low specificity. The performance of nuclear detection by low- entropy regions differed little among sets of images.
Low-entropy regions 0.06 (1.0) 0.08 (1.0) 0.06 (1.0) 0.08 (1.0) 0.08 (1.0) Forward tracking 0.38 (1.0) 0.48 (1.0) 0.55 (1.0) 0.44 (1.0) 0.53 (1.0) Forward and backward
trackings 0.44 (1.0) 0.55 (1.0) 0.67 (1.0) 0.5 (1.0) 0.63 (1.0) Table 2.2 Performance of nuclear detection by low-entropy regions and those selected forward and backward trackings
set 5
Data are specificity and (sensitivity) for five sets of 4D DIC microscope images of a C. elegans embryo from the one- to 24-cell stages (1 set = 56 focal planes × ~120 time points = ~6720 images).
set 1 set 2 set 3 set 4
1 pixel 4% 8% 12% 16% 20%
1 pixel 5 5 5 4 4 4
30% 5 5 4 4 4 3
50% 5 5 4 4 2 1
70% 5 5 4 4 2 1
90% 1 1 1 1 0 0
Sensitivities of nuclear detection by low-entropy regions selected by advanced forward and backward trackings were calculated for five sets of 4D DIC microscope images of a C. elegansembryo from the one- to 24-cell stages. Number of image sets for which sensitivity of nuclear detection were 1.0 is shown.
Tt
Tf
Table 2.3 Number of image sets for which advanced trackings detected nuclei with perfect sensitivity
2.2.6 Selection of low-entropy regions using object-tracking algorithm in the forward direction of time
The very high sensitivity and very low specificity of nuclear detection by using low-entropy regions motivated me to develop a process that selected low-entropy regions that actually detected nuclei. To develop this process, I used spatial and temporal information on the nucleus. In terms of spatial information, I expected the nucleus to be detected by several low-entropy regions, each of which would overlap with another region in an adjacent focal plane at the same time point, because the radius of the nucleus (> 2.5 µm) was much larger than the distance between two adjacent focal planes (0.5 µm). Therefore, a low-entropy region would be more likely to detect a nucleus than others when it overlapped with a region that detected the nucleus in an adjacent focal plane at the same time point. In terms of temporal information, I expected the nucleus to be detected by several low-entropy regions, each of which would overlap with another region in the same focal plane at an adjacent time point, because the nucleus rarely moves more than a distance equal to its diameter (> 5 µm) within the time equal to the interval between two adjacent time points (40 s). Therefore, a low- entropy region would be more likely to detect a nucleus than others when the region overlapped with a region that detected the nucleus in the same focal plane at an adjacent time point.
To select low-entropy regions by using this spatial and temporal information, I used an object- tracking algorithm (Geerts et al., 1987; Lee et al., 1991; Awasthi et al., 1994) (Figure 2.5). The tracking algorithm was composed of the following two recursive processes. First, a low-entropy region in focal plane f at time point t is selected if the region overlaps with a region that has been selected in either focal plane f – 1 or f + 1 at time point t. Second, a low-entropy region at focal plane f at time point t is selected if the region overlaps with a region that has been selected in focal plane f at time point t – 1. Manual selection of a low-entropy region at time point 0 triggers these processes.
I call this algorithm forward tracking because it tracks nuclei in the forward direction of time.
To examine whether forward tracking effectively selects low-entropy regions that can actually detect nuclei, I applied this algorithm to the low-entropy regions produced from five sets of 4D DIC microscope images of C. elegans embryos from the one- to 24-cell stages (Table 2.2). As expected, I obtained perfect sensitivity for nuclear detection by the selected low-entropy regions. All nuclei were detected at any time point, independently of whether or not they were in the process of cell division. Specificity was about 6.7 times better than before selection, although it was still far from perfect. These results indicate that forward tracking effectively selects low-entropy regions that can actually detect nuclei.
Figure 2.5 Overview of forward and backward trackings. Low-entropy regions selected by forward tracking are shown in the left column and those selected by backward tracking after the selection by forward tracking are shown in the right column. These low-entropy regions (white) are overlaid on their corresponding input images. Solid arrows represent the tracking of low- entropy regions. The broken arrow represents a dead-end branch of tracking.
2.2.7 Further selection of low-entropy regions using object-tracking algorithm in the backward direction of time
To further select low-entropy regions, I used another tracking algorithm. This algorithm, called backward tracking, used the same recursive processes as forward tracking, with the exception of the direction of tracking, i.e., it tracked nuclei in the backward direction of time (Figure 2.5). I expected that this backward tracking would be effective for selecting low-entropy regions after forward tracking, because forward tracking usually creates many dead-end branches (Figure 2.5), which
consist of low-entropy regions that do not detect nuclei. Backward tracking selected low-entropy regions that were not included in these dead-end branches (Figure 2.5).
Backward tracking was composed of the following two recursive processes. First, a low-entropy region in focal plane f at time point t is selected if the region overlaps with a region that has been selected in either focal plane f – 1 or f + 1 at time point t. Second, a low-entropy region in focal plane f at time point t is selected if the region overlaps with a region that has been selected in focal plane f at time point t + 1. Manual selection of low-entropy regions at the last time point triggers the processes.
To examine whether backward tracking is effective for selection of low-entropy regions after forward tracking, I applied backward tracking to the five sets of low-entropy regions selected by forward tracking (Table 2.2). Again, I obtained perfect sensitivity for nuclear detection by low- entropy regions selected by backward tracking. All nuclei were detected at any time point independently of whether or not they were in the process of cell division. Sensitivity was markedly better than before backward tracking, although it was still far from perfect. These results indicate that backward tracking is effective for selection of low-entropy regions after forward tracking.
2.2.8 Excellent selection of low-entropy regions using object-tracking algorithm, depending on the extent of overlap between two regions
The very high sensitivity but far lower perfect specificity (0.56 in average) of low-entropy regions selected by the combination of forward and backward trackings motivated me to develop a process that would more effectively select low-entropy regions that could detect nuclei. To develop this process, I used more detailed spatial and temporal information on the nucleus. In terms of more detailed spatial information, I expected the nucleus to be detected by several low-entropy regions, each of which overlapped to a large extent with one of the others in an adjacent focal plane at the same time point, because the 3D shape of the nucleus is usually simple. Therefore, a low-entropy region would become more likely to detect a nucleus when the region overlapped to a large extent with a region that detected the nucleus in an adjacent focal plane at the same time point. In terms of more detailed temporal information, I expected that a nucleus would be detected by several low- entropy regions, each of which overlapped to a certain extent with another in the same focal plane at two adjacent time points, because the nucleus usually moves much less than a distance equal to its diameter within the time equal to the interval between two adjacent time points. Therefore, a low- entropy region would become more likely to detect a nucleus when the region overlapped with a region that detected the nucleus in the same focal plane at two adjacent time points, and when both regions overlapped by a large extent.
To select low-entropy regions using this more detailed spatial and temporal information, I introduced a minimum overlap ratio to the forward and backward trackings. The minimum overlap ratio between two low-entropy regions was defined as the smallest ratio of the number of pixels shared by these two regions to the number of pixels making up each region. Thus, when the minimum overlap ratio between two overlapping regions increases, the two regions overlap to a greater extent, i.e., the two regions are more likely to detect the same nucleus. In the forward and backward trackings, I used this minimum overlap ratio to select pairs of low-entropy regions that overlapped to an extent greater than a prefixed value—i.e., pairs of low-entropy regions that were more likely to detect the same nucleus than a prefixed likelihood.
Forward tracking with a minimum overlap ratio was composed of the following two recursive processes. First, a low-entropy region in focal plane f at time point t is selected if the region overlaps with a region that has been selected either at focal plane f – 1 or f + 1 at time point t by a minimum overlap ratio more than the threshold Tf. Second, a low-entropy region in focal plane f at time point t is selected if the region overlaps with a region that has been selected in focal plane f at time point t – 1 by a minimum overlap ratio more than the threshold Tt. Manual selection of a low-entropy region at time point 0 triggers the processes in the same way as with the original forward tracking.
Backward tracking with a minimum overlap ratio is composed of the same recursive processes as forward tracking with a minimum overlap ratio, except that the direction of tracking is reversed—i.e., it tracks nuclei in the backward direction of time in the same way as with the original backward tracking. Manual selection of low-entropy regions at the last time point triggers the processes in the same way as with the original backward tracking. I expected that, as Tf and Tt increased, the selected low-entropy regions would become more likely to detect nuclei.
1 pixel‡ 0.48 (0.06) 0.54 (0.11) 0.56 (0.11) 0.56 (0.10) 0.58 (0.10) 0.59 (0.10)
30% 0.57 (0.08) 0.69 (0.11) 0.74 (0.11) 0.78 (0.10) 0.84 (0.09) 0.87 (0.07)
50% 0.66 (0.11) 0.79 (0.11) 0.84 (0.08) 0.87 (0.07) 0.90 (0.06) 0.94 (0.03)
70% 0.74 (0.12) 0.86 (0.08) 0.90 (0.07) 0.93 (0.05) 0.94 (0.05) 0.97 (0.03)
90% 0.83 (0.10) 0.93 (0.04) 0.95 (0.03) 0.98* (0.01*) 0.99* (0.01*) 1.00* (0.00*) 1 pixel‡ 0.56 (0.08) 0.62 (0.13) 0.64 (0.13) 0.65 (0.12) 0.67 (0.13) 0.69 (0.13)
30% 0.70 (0.10) 0.83 (0.12) 0.87 (0.09) 0.90 (0.07) 0.93 (0.05) 0.95 (0.03)
50% 0.82 (0.12) 0.91 (0.07) 0.93 (0.05) 0.95 (0.05) 0.97 (0.04) 0.98 (0.02)
70% 0.87 (0.11) 0.96 (0.05) 0.97 (0.04) 0.99 (0.02) 0.99 (0.01) 1.00 (0.00)
90% 0.93 (0.08) 0.99 (0.01) 1.00 (0.00) 1.00* (0.00*) 1.00* (0.00*) 1.00* (0.00*)
Table 2.4 Specificity of nuclear detection by low-entropy regions selected by advanced forward and backward trackings
Tt Tf
Forward and backward trackings
Forward tracking
1 pixel† 4% 8% 12% 16% 20%
Data are mean and (SD) for five sets of 4D DIC microscope images of aC. elegansembryo from the one- to 24-cell stages. *Data are for four sets of DIC microscope images, because no low-entropy regions were selected in one image set. †Low-entropy regions were selected when they shared at least one pixel with regions already selected in the same focal plane at an adjacent time point, i.e., the same condition as used for the original forward and backward trackings. ‡Low-entropy regions were selected when they shared at least one pixel with regions already selected in an adjacent focal plane at the same time point, i.e., the same condition as used for the original forward and backward trackings.
To examine whether the combination of forward and backward trackings with minimum overlap ratio (hereafter called advanced forward and backward trackings) would more effectively select low entropy regions than a combination of the original forward and backward trackings, I applied this combination of advanced forward and backward trackings to the low-entropy regions produced from five sets of 4D DIC microscope images of C .elegans embryos from the one- to 24-cell stages.
Various sets of Tf and Tt were examined (Table 2.3 and Table 2.4). As expected, as Tf and Tt increased, the specificity of detection by the selected low-entropy region increased, whereas the sensitivity of detection by the region decreased. I found many sets of Tf and Tt that provided very high specificity (= 1.0), and several of them also provided perfect sensitivity (for example, Tf = 70%
and Tt = 4% in Table 2.4). In this set of Tf and Tt, the selected low-entropy regions nearly perfectly detected all nuclei at any time point, independently of whether or not the nuclei were in the process of cell division. These results indicate that the combination of advanced forward and backward trackings more effectively selected low-entropy regions than did the combination of original forward and backward trackings. When an optimal set of Tf and Tt was applied, the combination of advanced forward and backward trackings nearly perfectly selected low-entropy regions that could detect nuclei.
2.3 Discussion
2.3.1 Less sensitivity of this system to differences in image quality than that of Yasuda et al.’s system
This system is less sensitive than Yasuda et al.’s system to differences in image quality (Yasuda et al., 1999). The difference in local image entropy (the image texture measure used in the new system) between nucleus and cytoplasm is remarkably greater than that in the image texture measure used in Yasuda et al.’s system (hereafter called Yasuda et al.’s measure) (Figure 2.3). The difference in local image entropy at the boundary between nucleus and cytoplasm is remarkably greater than that in Yasuda et al.’s measure.
Yasuda et al.’s system (Yasuda et al., 1999) used edge-detection operators, that is, Kirsch and the Prewitt operators, to detect nuclei from DIC microscope images. Because these edge-detection operators are very sensitive to differences in the intensity of local pixels, the output values of these operators varied widely in both the nucleus and cytoplasm. Therefore, application of thresholding directly to the images resulting from image conversion using these operators did not effectively discriminate between nucleus and cytoplasm.
To deal with this problem, Yasuda et al.’s system applied a blur filter to the images resulted from image conversion. The combination of the edge-detection operator and the blue filter was the Yasuda et al.’s measure. The blur filter reduced the variation of the output values of the edge- detection operators, so that the thresholding of the resulting images allowed discriminating the image textures of the nucleus and the cytoplasm. However, the gradient at the boundary between nucleus and cytoplasm becomes easier than that of local image entropy (Figure 2.3). Thus, the nuclear detection using Yasuda et al.’s measure was more sensitive to the differences in image quality, so that size of nuclear region with Yasuda et al.’s measure would change greater than that of my system when the threshold values are changed by the same value. Yasuda et al.’s system therefore required laborious hand-tuning of the thresholding each time a new image set was applied.
2.3.2 Advantage of this system
One major advantage of this system is the use of local image entropy to quantify the appearance of the nucleus in the images. Yasuda et al.’s system used edge detection operators to quantify the appearance of the nucleus (Yasuda et al., 1999). Because these operators were sensitive to differences in image quality (e.g., brightness, contrast) among sets of images, Yasuda et al.’s system required laborious hand-tuning of system parameters each time a new image set was used (section 2.2.4 and section 2.3.1). Local image entropy is not sensitive to differences in image quality among sets of images because it represents the smoothness of the image texture (section 2.2.1). Therefore, my system can be applied to different image sets without the need to change the system parameters. I applied five sets of 4D DIC microscope images to my system, and the system detected the nuclei in these sets with similar sensitivity and specificity when I used the same parameter values (Table 2.2).
This reduced sensitivity to differences in image quality makes my system applicable to research. I can apply this system to sets of 4D DIC microscope images of mutant C. elegans embryos (Figure 2.6) and embryos in which specific genes are silenced by RNA interference (Figure 2.7).
Another major advantage of my system is the use of object-tracking algorithms to examine all regions with the features of the image texture of the nucleus (i.e., low local image entropy) in a set of 4D DIC microscope images and to select regions that can actually detect nuclei. A DIC microscope image of a C. elegans embryo contains many regions that have similar (smooth) image textures to that of the nucleus but that do not actually correspond to the nucleus, such as the boundaries between cells and the spaces between the embryo and the eggshell (Figure 2.4). Thus, in addition to image texture, other features of the nucleus are needed to completely distinguish the nucleus. Yasuda et al.’s system used the (round) shape of the nucleus that was not in the process of cell division in addition to the feature of image texture, as quantified by edge detection operators (Yasuda et al., 1999). Yasuda et al.’s system could not detect nuclei in the process of cell division. The object-
tracking algorithm in my system uses spatial and temporal information on the nucleus, and this information is independent of the process of cell division. Thus, my system detects all nuclei—
whether or not the cell is dividing—at every time point from one- to 24-cell stages. This continuous detection of nuclei is a great help in following the CDP.
Figure 2.6 Low-entropy regions in a par-1 embryo. Input images of a par-1 embryo are shown in the left column and low-entropy regions (black) are shown in the right column. Bar is 10 µm.
Figure 2.7 Low-entropy regions in a tba-2(RNAi) embryo. Input images are shown in the left column and low-entropy regions (black) are shown in the right column. Bar is 10 µm.
My system effectively detected nuclei over a markedly longer developmental period than Yasuda et al.’s system did, i.e., from the one- to 24-cell (Table 2.3 and Table 2.4) stages compared with only the two- to eight-cell stages (Yasuda et al., 1999). This extension of the period of effective nuclear detection primarily results from the very high sensitivity of nuclear detection by low-entropy regions before forward and backward trackings (Table 2.2). The sensitivity and specificity of nuclear detection by these “original” low-entropy regions depend on the parameters used to produce the regions (i.e., window size and entropy threshold): the higher the sensitivity, the lower the specificity.
My system uses a set of values for these parameters that provides very high sensitivity and very low specificity of nuclear detection by the original low-entropy regions (Table 2.2), because subsequent forward and backward trackings effectively distinguish those regions that actually detect nuclei from those that do not.
Yasuda et al.’s system used a two-step strategy similar to my system: i.e., regions that had the image texture of the nucleus were produced using edge detection operators, and from these “likely nuclear”
regions, those that actually detected nuclei were selected using the shape of the nucleus. The sensitivity and specificity of nuclear detection by these “original” likely nuclear regions depended on the parameters used to produce the regions. However, the shape-dependent selection of likely nuclear regions was far less effective than the selection of low-entropy regions by forward and backward trackings. Thus, Yasuda et al.’s system used a set of parameter values that provided markedly lower sensitivity and markedly higher specificity of nuclear detection by the original likely nuclear regions than by the original low-entropy regions. In the current study, I found very high sensitivity of nuclear detection by the original low-entropy regions up to the 44-cell stage (data not shown). Thus, improvement in the selection of low-entropy regions will further extend the period of effective nuclear detection. I am developing an improved system that uses both a tracking algorithm and the known shape and size of nuclei in non-dividing cells to select low-entropy regions.
Fluorescent labeling of nuclei is a method that has recently been developed for identifying the positions of the nuclei in living C. elegans embryos (Kelly et al., 1997; Praitis et al., 2001). With this method, the genetic information of an embryo is artificially modified so that the embryo expresses nuclear protein fused with fluorescent protein, such as histone H2B fused with green fluorescent protein (GFP) (Praitis et al., 2001); the embryo is illuminated by excitatory light (e.g., blue or UV light for GFP), and the expressed fusion protein produces light of a specific color (e.g., green for GFP). Because the nuclei are labeled with a specific color, detection of the nuclei is much easier than that using the DIC microscope. However, the development of the embryo expressing the fusion protein may differ from that of the intact embryo because of the presence of GFP or the modification of genetic information (Fire, 1986; Liu et al., 1999; Zhang et al., 2002). Fluorescent labeling can be used to visualize nuclei for a markedly shorter period than with the DIC microscope because of photobleaching: i.e., the intensity of fluorescence of the fusion protein decreases because of exposure of the protein to the excitatory light (Strome et al., 2001), although the amount of photobleaching can be reduced by the use of multiphoton fluorescence imaging (Denk et al., 1990).
In contrast, the DIC microscope can be used to visualize the nuclei of an intact embryo throughout the development of C. elegans. Therefore, to describe the precise position of nuclei in living C.
elegans embryos, identification of the position of the nucleus using the DIC microscope seems more suitable than that using fluorescent labeling of nuclei.