ALOS Research Final Report (PI N° 157)
Combined radar and visible stereoscopic remote sensing of tropical ecosystems
Eric Mougin
August, 2011
Géosciences Environnement Toulouse – UMR 5563 (CNRS-UPS-IRD)
Postal address : Géosciences Environnement Toulouse – Observatoire Midi-Pyrénées 14, avenue Edouard Belin 31400 Toulouse – France
Tel. (33) 5 61 33 29 76 – Fax : (33) 5 61 33 25 60 -
LIST OF PRINCIPAL PARTICIPANTS
Principal Applicant:
Name: MOUGIN ERIC Official title: Dr.
Department: Géosciences Environnement Toulouse (GET) Organization: CNRS
Address: Observatoire Midi-Pyrénées 14 avenue Edouard Belin 31400 TOULOUSE
Country: FRANCE
Email: [email protected] / [email protected] Telephone: +33 5 61 33 29 76 facsimile: +33 5 61 33 25 60
Co-applicants:
Name Organization Email Hiernaux Pierre GET, France
[email protected] Manuela Grippa GET, France
manuela.grippa@ get.obs-mip.fr Christophe Proisy IRD-UMR AMAP, France
[email protected] Pierre-Louis Frison UMLV, France
[email protected] Pierre Couteron IRD-UMR AMAP, France
[email protected] François Fromard CNRS-UMR ECOLAB
franç[email protected] Valdenira F. Dos Santos IEPA, Brazil
[email protected] Pedro Walfir UFPA, Brazil
COMBINED RADAR AND VISIBLE STEREOSCOPIC REMOTE SENSING OF TROPICAL ECOSYSTEMS
Due to several constraints, ALOS data has been only downloaded from 2009.
Since this date, all the participants have actively worked with the ALOS images for parameters retrieval, land cover and forest mapping, and Digital Slope Model (DSM) generation. The main study sites are located in tropical regions including the dense forests (section A) of French Guyana and the semi-arid Sahelian savannas in Mali (section B). In addition, the potentialities of PALSAR images for land cover identification in tropical islands have been investigated (section C).
A. Tropical forests
Within the frame of global warming and climate change, terrestrial ecosystems play a major role in carbon cycle. Either they release carbon to the atmosphere in the case of land cover change (deforestation, forest degradation, fire) or they absorb atmospheric carbon during the growth of vegetation. Forests are of prime concern since they represent about 85% of terrestrial biomass, and among them, tropical forests contained more than a quarter of the carbon of the terrestrial biosphere. During the United Nation Framework Convention of the Climate Change (UNFCCC) held in 2005 at Montréal (Canada), tropical countries have launched an initiative leading to address the issue of Reducing the Emission from Deforestation (RED). The basic principle of a future REDD policy is that countries can reduce emissions from deforestation and forest degradation to be financially compensated through a fund or a carbon market.
Consequently, major issues consist in the estimation of forest biomass, designated by the appellation "Monitoring, Reporting, Verification (MRV).
A1. Estimation of forest standing biomass Introduction
Predicting structural organization and biomass of tropical forest from remote sensing observation constitutes a great challenge. It should be recognised that even with new spatial data, high standing biomass of multilayered forests cannot be easily estimated from space contrary to boreal or temperate forests. A dedicated, methodological effort is therefore necessary. Particularly, the complementarities of the different new sources of remote-sensing information have to be explored.
Although radar signal saturation is observed at the midlevel of biomass range (e.g.
Imhoff, 1995; Mougin et al., 1999) that commonly reaches values of 500 tons of dry matter per hectare (t DM/ha), radar imagery provide calibrated and cloud free images, i.e useful data for monitoring tropical forest (e.g. Lucas et al., 2007). Besides, new and promising results have been obtained through the use of very high spatial resolution (VHR) optical images. The renew of optical remote sensing for estimating structural forest parameters comes from texture analysis which demonstrated to be the first time images-derived signatures that did not level off for high levels of biomass. The Fourier-
based textural ordination (FOTO) of VHR images demonstrated a unique potential to capture the whole range of tropical forest dynamics (Couteron et al., 2005). Moreover, FOTO texture indices are potentially related to rainforest structure (Barbier et al., 2010) and relationships with aboveground biomass seem to be solid in high-biomass mangroves (Proisy et al., 2007). However, the monitoring of tropical regions using VHR optical images can be problematic due to quasi permanent cloud cover.
Objectives
The present research project aims to provide a comprehensive framework for tropical forest structure monitoring and biomass assessment with the ambition to quantify spatial variations of biomass above the highest saturation thresholds currently observed with spaceborne radars (from 200 tDM/ha upwards). Our objectives are to investigate the potentialities of the combined use of ALOS PALSAR (radar) and PRISM (optical) data for mapping dense tropical forest structure and above-ground biomass.
Study site and database
The experimental sites are located in French Guiana, South America (Fig. A-1). The region, and particularly the coastal environment calls for the development of radar (Mougin et al., 1999; Proisy et al., 2000, 2002; Lucas et al., 2007), optical (Couteron et al., 2005; Proisy et al., 2007) or Lidar (Proisy et al., 2009) remote sensing-based methods to analyze broad-scale forest ecosystem dynamics.
Figure A-1: Location of French Guiana in South America.
The experimental sites are named Plomb Mountain (PM, 5°00'N, 52°55'W and Sinnamary (SI, 5°26' N, 53°02W). Both sites are composed of undisturbed forest. The experimental PM site is composed of a hilly landscape in the north whereas, in the south, a volcano-sedimentary massif reaches 332 m above sea level. Detailed information about this site can be found in Couteron et al. (2005). At the opposite, the SI mangroves sites display a flat topography. Due to the coastal dynamics of the region (Fromard et al,. 2004), mangrove growth stages are patchily distributed over the coastal
landscape with clusters of young trees sometimes occurring in close vicinity to patches of mature trees of 40-m height.
Field experiments are conducted in order to measure the main structural parameters including standing biomass in a wide range of forest situations or growth stages. All PM forest plots are one hectare (100m x 100m). For the SI site, areas of inventory range from 1000 m² to 10 000 m² depending on the homogeneity of the growth stage (see Proisy et al., 2007 for further details).
14 mangrove forest plots are selected. However, all the forest data are not yet available.
Measured above-ground biomass (AGB) varies from 129 tons of dry matter per hectare (tDM/ha) to 701 tDM/ha (Fig. A-2). Additional forest plots will be added in the analysis as soon as they will be provided by the forest services.
Figure A-2: Histogram of above ground biomass estimated for the Plomb Mountain site (PM) and the Sinnamary mangrove site (SI).
Remote sensing data Radar data
Five ALOS PALSAR images have been downloaded from the archive in PLR mode (Table A-1). In the dataset collected, we considered level 1.5 (intensity) and checked the accuracy of the computed backscattering coefficients from polarimetric channels. The images were decompressed using PolSARPro V3.0 Software (© ESA). Intensity (Fig. A- 3) and HH-VV correlation coefficient pHHVV images have been computed and integrated to our GIS database. Geocoding quality was controlled thanks to the superimposition on a very high resolution optical image.
1 12/05/2007 100 02:09 24.0
2 01/04/2009 100 02:09 24.0
3 17/05/2009 100 02:10 25.8
4 17/05/2009 90 02:10 25.8
5 01/04/2009 90 02:10 24.0
1.5 102
Acquisition time (GMT)
Incidence angle at
image center (°) Processing level ID scene Acquisition date Path Frame
Table A-1: PALSAR data ordered and used in the present study.
Figure A-3: Location of tropical forest sites in French Guiana. Background images are ALOS PALSAR images acquired at different dates (see Table 1).
Figure A-4: Subset of the ALOS PALSAR images acquired over the Sinnamary mangrove site. White dots indicate location of forest inventory plots.
VHR optical data
Unfortunately, no ‘free cloud’ PRISM image has been acquired over the French Guyana site. We therefore used a) black and white aerial photographs at 1:25000 acquired by IGN (Institut Géographique National) in 1992 for the MP site; b) a Geoeye image acquired over the SI region. Aerial photographs were digitized with a pixel size of 1 meter whereas Geoeye panchromatic image has a 0.5 meter resolution. The diversity of geomorphology of the sites and the patchwork of mangrove growth stages result in contrasted textural aspects of the forest canopy, which are apparent on both type of images (Fig. A-5).
Figure A-5: Typical range of canopy textures image as provided in the aerial photographs over the MP site (top) and in the Geoeye image acquired over the mangrove SI site (bottom).
Methodology
The methodology followed to estimate forest parameters consists in combining optical VHR images (Geoeye instead of PRISM data) and PALSAR images. The optical images are analyzed using the FOTO method to derive FOTO maps (see Proisy et al., 2007 for the detailed procedure). From the FOTO maps, produce forest parameters maps are derived taken as reference for the L-band radar data analysis (inversion algorithm development and the validation stage).
Deriving Backscattering coefficients
We derive reflectivity estimates in terms of Gamma noted ° defined as:
°= ° -10 log10 (cos(θ))
where θ is the incidence angle at the centre of the considered target. This term corresponds to the reflectivity of distributed scatterers per unit area of incident wave front. Backscattering coefficients ° are computed by averaging intensity DN² values over all pixels included within the area of the forest plots. The calibration factor CF equals to -83dB for all images is provided in the header files.
°= 10 log10 (CF . DN2/cos(θ))
Canopy grain ‘FOTO’ indices
Canopy grain indices over the MP and SI sites are computed using the Fourier-based textural ordination (FOTO) applied to the aerial photographs and to the Geoeye image.
The FOTO method computes texture indices of canopy grain by performing a standardized principal component analysis (PCA) on the Fourier spectra obtained for image windows of adequate size (see Couteron et al., 2005; Proisy et al., 2007; Barbier et al., 2010; Barbier et al., 2011 for further details). We use the scores of the 3 first component axes as texture indices for the mangrove SI site, whereas for the MP site only the first axis is used.
Results
Relationships between ° L-HV and FOTO indices
Relationships between forest top canopy parameters as measured by FOTO indices and L-band penetrating radar signal, potentially informative of structural volume inside the forest canopy are investigated (Fig. A-6). For the SI site, we compute FOTO indices and
° signatures for all previously inventoried forest areas, i.e. 14 forest plots although 9 of them need to be re-inventoried.
Figure A-6: Relationships between PC1 (scores of first component axis) and °L-HV for mangroves (left) and rainforest without taking account topography (right).
Canopy texture gradient over mangroves is found to be related to °HV with a coefficient of determination r² of 0.87, for PC1 (Fig. A-6) and up to 0.94 when 3 FOTO axes are taken into account in the analysis (Fig. A-7).
In contrast, no clear relationships between FOTO indices and °HV is found for the rainforest MP site. This can be explained by the saturation of the L-band backscattering coefficient for very high standing biomass as those found in tropical forests. However, the effect of topography on °HV values still need to be quantified. To this end, we are presently analyzing a new Lidar dataset in order to provide an estimation of the actual incidence angle.
Figure A-7: Derivation of ° L-HV from FOTO indices of mangroves
Estimation of Above-Ground biomass from L-band data
a. Co-polarization ratio versus biomass
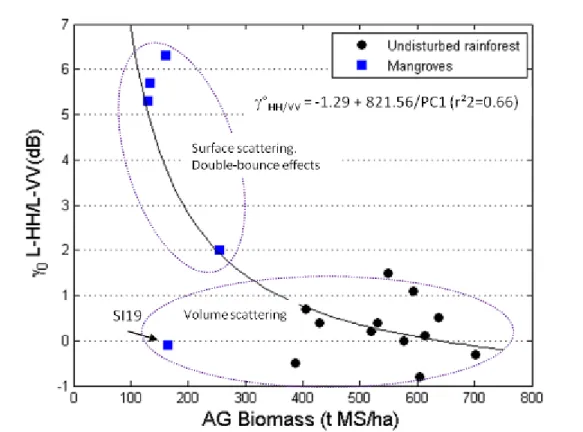
Since it may provide information about the dominant scattering mechanisms between the radar wave and the different part of the forest canopy, analysis of co-polarization ratio is a prerequisite before the use of cross-polarization signatures (Fig. A-8).
Three of five mangroves plots are composed of 25-35m tall trees with DBH around 30 cm and ABG less than 200 t MS/ha. There is no understorey vegetation. High values of HH/HV ratio suggest an important contribution of double-bounce effects between the elongated trees and the inundated (by fresh water) surface. By contrast, the forest plot SI19 (Fig. A-9) show small differences between HH and VV suggesting that the surface scattering is strongly attenuated by the lower stratum composed of Rhizophora mangrove trees and large crowns of the biggest trees (DBH>60cm).
For the MP rainforest site, differences between HH and VV are smaller than 1dB.
Dominant scattering mechanisms are attributed to volume scattering by the vegetation (crown).
b. Cross-polarization versus biomass
The ° L-HV values remained stable (-22.8 to -21.8dB) for AGB values ranging from 129 to 165 tDM/ha. With less than 2dB for an increase of 400 tDM/ha, the relationships between ° L-HV values became flat above 300 tDM/ha. As presented in the Fig. A-9, the tendency line should be considered with caution because 1) forest ecosystems do not show the same canopy structure and 2) A saturation of the L-HV radar signal is observed for rainforest.
Figure A-8: Variation of the ratio ° L-HH / ° L-VV versus aboveground biomass for both types of forest.
Figure A-9: Relationships between ° L-HV and aboveground biomass for both types of forest.
Current work and perspectives
We are now conducting an important field campaign in the Sinnamary mangrove site (SI) to update all the past forest inventories and to complement the analysis of PALSAR signatures. This is a huge work due to the difficulties associated to field work in such a forest. This campaign is supported by the French National Space Center (CNES) within the frame of the TROPISAR campaign for the evaluation of the ESA BIOMASS P-band mission.
The influence of topography is found to be large for the PM site. Our present work is to correct the induced variation of local incidence angle by using Lidar-derived digital elevation model. No correction is necessary for the mangrove stands since they grow they grow over a flat topography.
The same analysis is being to be performed with TROPISAR P-band data acquired over the SI mangrove region in August 2009. L- and P-band potentialities for above ground biomass inversion will be evaluated using the FOTO approach.
These preliminary results demonstrate the usefulness of combined optical and radar data such as the PRISM and PALSAR data for deriving tropical forest attributes.
A2. Land Cover and tropical forest mapping
Due to its ability to observe land surfaces despite the cloud cover, radar remote sensing is an ideal tool for tropical forest monitoring. In particular, radar polarimetry is sensitive to the structure and orientation of the scatterers interacting with the illuminating wave. Consequently it presents a strong potential for forest cartography. Support Vector Machine (SVM) classification algorithm is especially well suited for radar polarimetric data. Its main asset is its ability to account for numerous and heterogeneous parameters, which enable to take into account a large bunch of polarimetric indicators. In addition, it does not make any a priori assumption on the theoretical distribution of the data, such as the classical method based on the Wishart distribution, which are frequently not observed over natural surfaces.
The ALOS PALSAR sensor offers a unique opportunity to confirm the potentialities of radar polarimetry for land cover and also to analyze the potential of spaceborne by comparison to airborne radar polarimetry.
Dual and fully polarimetric data have been analyzed over different sites, located in Polynesia (French Polynesia) and South America (Brazil and French Guyana), Central Africa (Gabon). These studies, still in progress, are performed in close collaboration with a French forestry organism, ONFI (Office National des forêts International), which is involved in numerous projects in partnership with local governments in the frame of United Nation REDD program.
A2.1. Contribution of ALOS PALSAR data to the management of the park of Lopé, Gabon
The Ecosystem and Relict Cultural Landscape of Lopé-Okanda belongs to the UNESCO World Heritage since 2007. It demonstrates an unusual interface between dense and well-conserved tropical rainforest and relict savannah environments with a great diversity of species, including endangered large mammals, and habitats. The site illustrates ecological and biological processes in terms of species and habitat adaptation to post-glacial climatic changes. It contains evidence of the successive passages of different peoples who have left extensive and comparatively well-preserved remains of habitation around hilltops, caves and shelters, evidence of iron-working and a remarkable collection of some 1,800 petroglyphs (rock carvings). The property’s collection of Neolithic and Iron Age sites, together with the rock art found there, reflects a major migration route of Bantu and other peoples from West Africa along the River Ogooué valley to the north of the dense evergreen Congo forests and to central east and southern Africa, that has shaped the development of the whole of sub-Saharan Africa.
Since 1995, the National Park Lopé is subject to annual fire plan to slow the progression of the forest and maintain the savannah. This objective priority management meets the requirements related to international status as a mixed site's natural and cultural World Heritage Site in 2007.
Figure A-10a: PALSAR-DP HH/HV acquisition on September 5 2008.
R: |HH|, G: |HV|, B: Entropy
Figure A-10b: Classification result
The aim of this study is to assess the contribution of ALOS-PALSAR data for the monitoring of the management of the park of Lopé, in particular to investigate the respect of the fire plan allowing the conservation of savannas. Two PALSAR data acquired in 2008 and 2009 in DP mode HH/HV has been analyzed. A color composite image obtained from the 2008 acquisition is shown Figure A-10a. Six different classes have been able to be discriminated: two forest classes and four different savanna classes as illustrated in Figure A-10b. Moreover, the results show that PALSAR-DP data allow for the discrimination of areas respecting the fire plan from others, demonstrating the potential of PALSAR data to assist the management of the park. The fire plan must be followed carefully as the savannas that have not been maintained for several years cannot be preserved.
A2.2. Cartography of natural vegetation in French Guyana
Numerous studies have been made over French Guyana leading to the availability of extensive documentation of the area. In addition, field campaigns have been conducted in order to validate the results obtained. A fully polarimetric acquisition has been acquired in March 2010 over the region surrounding Cayenne. This acquisition allows for the discrimination of several vegetation types: mangroves, dry and swampy savannas, floodplain, flooded areas, gold mining areas, mature forest. These vegetation types are clearly visible on the Pauli decomposition shown in Figure A-11.
Figure A-11: Pauli composition of fully polarimetric PALSAR data acquired on March 10, 2010, over the region of Cayenne. R: |HH-VV|, G:|HH+VV|, B: |HV|
a) Pauli decomposition from the
simulated compact polarimetric mode.
R: |VV+HH|, G: |HV|, B: |VV-HH|
b) Color composite image from simulated Dual Polarimetric mode. R: |HH|, G:
|HV|, B: Entropy
Figure A-12: Color composite images derived from PALSAR data acquired the 10th of March 2010, over the region of Cayenne.
Moreover, simulations of partial polarimetric modes such as DP modes available with PALSAR sensor, or compact polarimetry (Souyris et al., 2005) or the hybrid polarimetric (Raney, 2007) mode according to the authors, are simulated. Illustrations are given in Figure A-12. Results show that the same and lowest classification performance is obtained for DP mode in HH/HV and VV/HV, while significant amelioration is observed for HH/VV DP which performs as well as compact polarimetric mode, especially due to a better discrimination between the different types of cropped vegetation. Finally, with no surprise, best results are obtained for fully polarimetric data especially due to the ability to discriminate between young and mature mangroves.
A2.3. Cartography of a forest plantation in Brazil
ONFI, in partnership with the French car manufacturer Peugeot, is involved in a reforestation project in Brazil. The concerned site is a fazenda located in the Mato Grosso state. In 1999, 1800 ha of the fazenda was clear-cut areas. The experiment consists in the reforestation of the site with mainly native species, to study the natural potential of forest regeneration. Since 1999, the site is subject to field survey conducted regularly. More than 20 strata were identified in term of species, age or tree spacing, as shown in Figure A-13. A fully polarimetric data acquired the 28th of March 2009 has been analyzed (Figure A-14). Results of classification showed that only 9 classes were able to be discriminated by PALSAR data: 2 different types of dense plantations, 2 types of woodlands, and 4 types of sparse trees. Surprisingly, very low correlation was observed between radar backscattering coefficient ° and biomass. This is due to the typical structure of trees that have been planted, such as teak species for example, which is made of a unique trunk with no branches and only few and large leaves, as illustrated in Figure A-13b.
The analysis of partial polarimetric modes shows that they are far less performant for classification than fully polarimetric data. The different Compact or Dual polarimetric modes observe similar performances, at the exception of DP VV/HV that shows the lowest overall classification accuracy. This result is typical of the study site, due to the specificity of woody species that have been planted, as mentioned before for teak species for example. In that case, the double bounce is a reflection mechanism which is significant for the discrimination.
a)
b)
Figure A-13: a) map of forest strata encountered over the fazenda; b) photo of a plot of teak species
Figure A-14: Pauli decomposition of the fully polarimetric PALSAR data acquired the 28th of March 2009. R: |HH-VV|, G: |HV|, B: |HH + VV|
B. Sahelian semi-arid savannas
B1. Radar observations
The monitoring of semi-arid areas is the focus of numerous studies over a Sahelian region, located in the Gourma, Mali. In situ measurements have been performed during terrain campaign or by automatic stations for more than twenty years, making this test- site especially well suited for the validation of methods aiming at estimating surface parameters. Most of radar studies have involved C band data acquired by SAR on board ERS or ENVISAT satellites and scatterometers on board ERS and METOP satellites. It has been shown that the seasonal cycle is particularly well observed by radar data: the radar signal is rather low and constant during the whole dry season, extending from November to May and corresponding to dry and bare soil conditions; then it increases after the beginning of the rainy season, with the moistened of the soil and the growth of the herbaceous vegetation to reach a maximum level around the end of the rainy season, in September; then the radar response decreases with the drying of the soil and the vegetation, to reach the constant level observed during the dry season. With the objectives of land cover mapping, complementarities between C- and L-band are to be confirmed in such regions where vegetation is sparse or absent.
Study site and database
The study site is located in Northern Mali in the Gourma region (Figure B-1).
Figure B1 - Gourma site location (West-Africa).
Over the Gourma region, a time series of PALSAR scenes acquired between January 2007 and April 2009 is analyzed. It consists in 24 acquisitions made in different mode (WB1, FBD, FBS, PLR), mainly in HH polarization. The analysis is made by comparison with a time series acquired by C band ASAR on board ENVISAT.
24-Dec-06 HH WB1
17-Jan-07 HH FBS
04-Mar-07 HH FBS
28-Mar-07 All PLR
20-Jul-07 HH/HV FBD
04-Sep-07 HH/HV FBD
20-Oct-07 HH FBS
01-Jan-08 HH WB1
16-Feb-08 HH WB1
06-Mar-08 HH FBS
02-Apr-08 HH WB1
21-Apr-08 HH FBS
18-May-08 HH WB1
06-Jun-08 HH/HV FBD
03-Jul-08 HH WB1
20-Jul-08 All PLR
06-Sep-08 HH/HV FBD
03-Oct-08 HH WB1
22-Oct-08 HH/HV FBD
22-Jan-09 HH FBS
18-Feb-09 HH WB1
09-Mar-09 HH FBS
02-Apr-09 All PLR
22 Apr 09 All PLR
Table B-1: List of all the ordered ALOS-PALSAR images acquired over the Gourma region, Mali. Data acquired during the rainy season are in bold character.
Results
Figure B-2 show a comparison between ENVISAT-ASAR (C-band) and ALOS-PALSAR (L-band) images acquired during the dry season. An overall close correspondence is observed between C- and L-band images. However, the hydrological network and geological features are much well identified with PALSAR data due to its higher penetration within the sandy, loamy and clayed soils (Frison et al., 2009). In particular, remnant of alluvial system and lacustrine depression are clearly detected on the PALSAR image.
Figure B-3 present multi-temporal color-coded images acquired by PALSAR in WB1 mode. Seasonal variations observed in PALSAR time series are especially significant over the ponds of the region enabling water surfaces to be discriminated (Frison et al.,
2011). This is of particular interest as these latter are the principal water resources of local population and livestock. A more in depth analysis is currently under progress.
a) ASAR data acquired the 20th of December 2005. Wide Swath mode, HH
polarization
b) PALSAR data acquired the 1st of January 2008. WB1 mode, HH polarization
Figure B-2: The Gourma region, Mali, as seen by ASAR (a) and PALSAR (b) sensors.
Figure B-3: Time color composite image of PALSAR data (HH polarization) over the Gourma region, Mali. 1st of January, 16th if February, and 2nd of April 2008.
Color patches correspond to the ponds of the region.
B2. Generation of DSM from PRISM images
The exploitation of ALOS data on the ESA side requires the development of validation procedures and tools in order to monitor the product quality and more specifically to support the update of the processing chain software.
Some tools are dedicated to the analysis of the PRISM georeferencing model in validating the instrument and attitude models. Because the product geolocation is degrading with time, some further researches are focused on the geometric parameters used and their associated deformation models.
These background experiences are considered as good basis to design and implement a processing chain dedicated to the generation of digital surface model starting from a PRISM triplet product.
Tested and validated using well known test sites (La Crau, France – Piemont, Italie), the related procedure is considered to be reliable and ready to support a thematic approach.
Here, our objective is to evaluate the benefits of using PRISM DSM (Digital Slope Model) data for hydrological simulations. The available PRISM dataset includes two PRISM triplet products (1B1 product level), acquired in April 19, 2007. Moreover, for
image orientation purposes, we use as reference data one SPOT 5 2.5 ortho rectified product and a set of ground control points.
The general method considers a PRISM stereo views, nadir / forward views or nadir / backward views exploiting epipolarity, to retrieve the scene elevation information.
The PRISM stereo view dataset is defined here as two images expressed in a same image grid (same geometry) into which a same pixel is observed with two different viewing angles. While applying image matching on this dataset, the displacements along the line direction is directly due to the terrain relief. Therefore, the displacements can be inverted in order to deduce the altitude information.
Figure B-4 is an attempt to depict the geometric transformations in order to express the reference image gird into a working image grid. A reference model and a working model are considered. Typically, for PRISM triplet product, the backward or the forward image data is projected into the nadir image grid.
MNT Reference Data
Reference Data in working data image grid
Refere nce model
Working mo
del
Figure B-4. Reference data into the working image geometry.
This operation is not trivial because the both georeferencing models, the reference and the working ones, should be calibrated with regards to an absolute reference. In addition, whereas the reference model required a direct mapping function (from image space to the object space), the working model should include the direct mapping function and the invert mapping function (from object space to image space).
The georeferencing model (physical model), PRISM and AVNIR-2, detailed in the JAXA algorithm description document (2006, RevJ) has been implemented and used. Several exchanges with JAXA / RESTEC team have been fundamental in order to improve our understanding of geometric alignment parameters and related models.
For each view, the georeferencing model is applied, its accuracy is evaluated. The subsequent stage is the estimate of the boresight angles in order to improve the georeferencing model accuracy.
The JAXA physical model provides a direct mapping function. The invert mapping function can be deduced from the direct one with recursive estimations, locally applied.
However, an RPC based approach has been adopted in order to better regularized the image deformations. The RPC based approach provides the direct and invert mapping functions which are involved in the production of the stereo view dataset.
The calibrated physical model is used to generate a three dimensional grid of Ground Control Point over the whole image. The three dimensional grid is then used to estimate the RPCs coefficients.
The georeferencing model accuracy achieved after boresight angle calibration is about 8 m (RMS) for the nadir, forward and backward image views. Without calibration, the georeferencing model accuracy depends on the selected PRISM view; for instance 110 m RMS is observed for the backward view whereas 30 m (RMS) is observed for the nadir view. Regarding to the reference data, the GCPs (GPS testfield survey) are not well distributed over the whole of PRISM image. In addition, the SPOT imagery scene extent does not fully overlap the PRISM data. It may results in limitations of the georeferencing accuracy.
Figure B-5 shows the image matching results while comparing the nadir and the forward views. The matching accuracy is correct with a large number of confident points. When full resolution images are considered as input of the matching procedure, a noise is observed on the correlation results. This noise is often due to the compression noise visible in each input image view.
Different attempts have been adopted to reduce the noise, without degrading the accuracy of the measurement, using image filtering. Unfortunately, they were unsuccessful.
If the resolution of the input images is downsized, the noise is automatically reduced.
When considering a pixel size of 5 m (50 % scale) the matching results does not need to be filtered. The visual aspect of the displacement map is correct.
First triplet product, (2.5 m images) Second triplet product (2.5 images) Figure B-5: Image of displacements.
After the validation of the matching results, the altitude information is deduced and the DSM is generated. The PRISM DSM data are agreeing with the SRTM one (30 m). The PRISM DSM data accuracy is better. Moreover, the related PRISM DSM image displays more details that the SRTM one and should a valuable source of information for thematic analysis.
C. Land Use (French Polynesia)
See hereafter the paper (Lardeux et al., 2008) presented at the ALOS Symposium, Rhodes, Greece in November 2008.
Contribution of ALOS PALSAR data for land use estimation
C. Lardeux(1), P.-L. Frison(1), C. Tison(2), J.-C. Souyris(2), S. Niculescu(3), B. Stoll(4), J.-P. Rudant(1)
(1) UMLV, Institut Francilien des Geosciences 5 bd Descartes, 77454 Marne la Vallee Cedex 2, France, E- mail: [email protected]
(2) CNES, 18 avenue edouard belin, 31401 Toulouse cedex 4, France.
(3) Université de Bretagne Occidentale, IUEM – Géomer, Technopôle Brest-Iroise Place Nicolas Copernic 29280 Plouzané Cedex, France
(4) UPF, Universitée de Polynésie française bp 6570, 98702 FAA'A aéroport de tahiti Polynésie française, France
Abstract
While they preserve some of polarimetric information as those that would be recorded by a full polarimetric (FP) radar sensor, compact polarimetry (CP) is relevant for system constraints reduction. This study focuses on the comparison between the FP mode, the CP mode as /4 mode and the dual polarimetric mode (DP) of ALOS PALSAR.
The SVM (Support Vector Machine) algorithm has been implemented as it allows to take into account numerous and heterogeneous polarimetric indices, such as the intensity channels, the degree of coherence between different polarisation, the H/a/α parameters or the Freeman parameters obtained from the corresponding target
decomposition methods.
The results obtained with AIRSAR full polarimetric data over a Polynesian island to provide a global
cartography are discussed and compared to the results obtained with the simulation of the /4 modes and the DP mode. It is shown that the contribution of the different polarimetric indicators improve significantly the
classification accuracy with respect to the /4 mode and the DP mode of PALSAR.
Keywords: SAR polarimetry, compact polarimetry, classification.
1. INTRODUCTION
The overall goal of this study is to assess the potential of polarimetric SAR data for land-use estimation over tropical vegetation. The study site is the Tubuai Island in French Polynesia for which local authorities are concerned with vegetation inventory. Full polarimetric data have shown their potential for the cartography of the vegetation from AIRSAR acquisitions that have been realised in 2000 over this area. The acquisition of ALOS data will allow to update the vegetation cartography, in particular for the monitoring of invasive species. In order to optimize the future ALOS acquisition modes, the focus is put on the evaluation of dual polarisation mode with respect to the full polarisation mode and compared to the /4 mode [1].
When dealing with classification methods applied to full polarimetric data, the Wishart classification [2] is generally used. In order to combine numerous and heterogeneous polarimetric indices derived from single or multy-frequency polarimetric SAR data, the SVM (Support Vector Machine) classification method [3] is
implemented. This later is especially well suited to handle linearly non separable case by using Kernel functions.
The study area and the dataset are presented in the second part of this paper. The third part details the SVM algorithm [3] and describes the different polarimetric indices used in the classifications. The results are presented in the last part of the paper.
2. STUDY AREA AND DATASET 2.1 The Tubuai Island
French Polynesia islands are located at the middle of the South Pacific Ocean. They are quickly evolving in the tourism industry, and from the economic and geostrategic points of view. They are subject to a strong
environmental planning leading to landscape changes as well to the introduction of invasive species.
Consequently, the local administration is involved in the global cartography and inventory of the Polynesian landscape leading to support an AIRSAR mission. We focus on data acquired over the Tubuai Island, in the Australes Archipelago at the South of French Polynesia. Tubuai is a 45 km2 island with a population of about 6000 inhabitants. It is particularly relevant because of its great landscape diversity: several types of forests, agricultural fields, and some residential areas scattered along the coast. Different land use classes are present, including 4 forest classes: Hibiscus tiliaceus (also called Purau), Pinus Caribeae (also called Pinus),
Paraserianthes Falcataria (also called Falcata) and Psidium Cattleianum (called Guava). The latter is particularly watched as it is an invasive species. The “low vegetation” is composed by 2 classes: the fern land and the swampy vegetation. The last class describe the bare soils. Several ground surveys has been carried out, and a Quickbird image acquired in August 2004 is also available to supply an accurate validation data set over the entire island. The classes are summarized in Tab 1. The ground surveys allow the definition of different regions of interest. They are randomly divided in 2 distinct subsets, one defining the training and the other the control dataset. The training and control pixels number is the same for each class and is also given in Tab 1.
Table 1. Vegetation classes of the Tubuai Island Vegetation type Vegetation
Class
Training/control pixels number
Forest
Pinus 5322
Falcata 2589
Purau 6186
Guava 348
low vegetation Fern land 2191
Swamp 5511
No
vegetation 4445 2.1.2 Dataset
An AIRSAR airborne mission took place in August 2000 over the main Polynesian islands. The AIRSAR data were acquired over the Tubuai Island along 2 passes in reverse path, in Polsar mode. The data set used in this study consists in full polarimetric data in L (λ = 23 cm) and P (λ = 67cm) bands with an additional C band channel (λ=5.7cm) in VV polarization. Full polarimetric data are delivered in MLC (Multi Look Complex) format, corresponding to about 9 looks, with a resolution of 5 meters. The relative phase of the original data has been calibrated [4] and an intensity bias has been corrected both in L and P bands values to retrieve expected value over dense forest areas.
3. METHODOLOGY 3.1 SVM
The SVM is a classification algorithm based on the searching the best surface separating the training samples.
Each input data are defined by a vector composed by the so called primitives, which, in our case, are the polarimetric indices. The interest of the SVM is the use of the kernel function that handles separable
heterogeneous and noisy data as shown in the Fig 1. More details about the SVM algorithm can be found in [3]
and [5].
Figure 1. SVM : Non linear case 3.2 Polarimetric indices
Full polarimetric sensor allows determining the covariance matrix C. This latter is constructed from the scattering vector kl expressed in the lexicographic basis as follows:
T l l
l , C= k k
S S S
=
k 2 .
qq pq pp
(1)
where Spq denotes the scattering matrix element corresponding to the p-q polarization of the receiving- transmitting wave (p,q referring to horizontal, h, or vertical, v, linear polarization), <.> stands for he spatial averaging made during the multi-look process. Many different polarimetric indices are extracted from the covariance matrix. In a previous study ([5], the contribution of the polarimetric indices as been assessed through an iterative algorithm based on the so-called greedy backward methods [6]. The greedy backward algorithm removes step by step the less efficient components (based on the mean of the producer accuracy (MPA) of the classification) of an initial vector configuration.
The results showed that a subset of polarimetric indices is particularly discriminating, which allow to define the V1 Vector to be use in the SVM algorithm. These are presented below and summarized in the Tab 2.
The modulus and the phase of the polarimetric degrees of coherence [7]vv
ρhh , ρhvvv, ρhvhh, ρlllr, ρrrlr, ρllrr , computed over a 3x3 neighbourhood as follow:
2 . 2.
q' p' pq
q' p' pq q'
p' pq
S S
S
= S
ρ (2)
where p, q, p‟, q‟ stands for h, v, l or r polarization.
The 3 parameters H/A/ representing the entropy, the scattering mechanism, and the anisotropy estimated from the Cloude and Pottier decomposition [8].
The 3 intensity parameters Ps, Pd, Pv, corresponding to the weight of single, double and volume contribution in the backscattered response of the Freeman decomposition [9].
The texture is taken into account through the coefficient of variationμ
= σ
cv , and are representing the standard deviation and mean of the intensities in the linear and circular polarization computed over a 5x5 neighbourhood.
At the exception of the coefficient of variation cv, all the other polarimetric indices have been estimated after the application of a polarimetric filter [10] to original data.
Table 2. Vector configuration of the FP and /4 mode
V1 V2 V3
cv-vv, cv-hv, cv-vv, cv-ll, cv-lr, cv-rr
cv-vv, cv-hv, cv-vv cv-ll, cv-lr
C2
|hh-vv|, hh-vv, |hh-hv| hh-hv, |vv-hv| |hh-vv|, hh-vv S S
SPAN
2 sp 2 sp
cv-pq, cv-pq
|ll-rr|, |ll-lr|,ll-lr, |rr-lr|, rr-lr, |ll-lr|,ll-lr
pq pq
I I
a/ a/ |pq-pqv|, pq-pq
Ps, Pd, Pv Ps, Pd, Pv H/a/
(relative to the DP mode)
21 elts 14 elts 13 elts
3.3 Compact Polarimetry: the “/4” Mode
The “/4” mode consists in a transmitter polarization either circular or oriented at 45°, and in receivers that are in horizontal and vertical polarizations with respect to the line of sight [1].
Due to some symmetry properties (reflection, rotation, azimuthal) for natural media, some hypothesis can be made to reconstruct the full polarimetric information. One important hypothesis made to reconstruct the full polarimetric information is:
Shh.Shv* Shv.Svv* 0 (3)
This property is generally observed over vegetated areas.
Consequently, some polarimetric parameters loose their signification, or become redundant with other. For example, the circular intensities Ill and Irr are equal. In the same way, the degree of coherence ll-rr has no more interest, as well as the degree of coherence involving the cross linear polarisation hv that is equal to zero. The corresponding polarimetric indices obtained from the V1 vector with such restriction define the V2 vector that is summarized Tab 2.
3.3 Dual polarimetric mode (PALSAR)
The dual polarimetric mode of ALOS PALSAR consists in the emission of the wave in one linear polarization with a reception in two linear polarizations. Consequently, the result is a couple of intensities of 2 linear configurations (i.e. hh/hv, vv/hv or hh/vv) with the addition of the phase difference between the 2 polarisations.
Then the corresponding covariance matrix C2 is composed by 3 non zero elements, 2 of whom are diagonal (i.e.
4 non zero coefficients). The different polarimetric indices that can be derived from such measurements define a vector V3 which is detailed in Tab 3. It can be noticed that the H/a/ estimated for the DP mode are relative to the diagonalization of the 2x2 matrix C2 and are consequently less relevant than those computed with the FP mode relative to the 3x3 matrix.
4. RESULTS AND DISCUSSION
The overall performance of the classification is given by the Mean of the Producer Accuracy (MPA), while the Producer Accuracy is used to estimate the performance for the different classes.
The results obtained at L band in the FP mode are compared to those obtained with simulation of the /4 and DP modes of PALSAR. In addition, to investigate the expected added value of an additional ASAR acquisition for example, for each mode the intensity and the texture coefficient of the VV polarisation of the C band are added. Results are summarized in Tab 3. Also are shown for indication the results obtained with Alternate Polarisation (AP) mode like defined on the ASAR sensor (i.e. 2 linearly polarised intensities only, with no differential phase).
Table 3. SVM classification results for the FP, DP and AP modes for L band and L+CVV: MPA (%) L band L band+CVV
FP 92 97
π/4 79 92
PALSAR DP
HH/HV 77 89
VV/HV 69 86
HH/VV 78 92
ASAR AP
HH/HV 59 81
VV/HV 53 75
HH/VV 59 80
When only the L band is concerned, the classification accuracy of the FP mode with the SVM algorithm (92%) is improved of more than 20% with respect to the Wishart algorithm (MPA= 69%). It shows the interest of the SVM algorithm for the classification of FP data.
Among the different partial polarimetric modes, the /4 mode gives the best accuracy with a MPA value of 79%, (i.e. 13% lower than the FP mode). Similar results are obtained with the HH/HV (77%) and HH/VV (78%) DP mode. The lost of the differential phase between the 2 linear polarisation channels, as in the AP mode, lead to a strongly reduced classification accuracy with MPA value of 59%, that is 33% lower than with FP mode. It can be noticed that the VV/HV configuration for both DP and AP modes show the lowest results.
The VV/HV is the less performant among the DP modes with a MPA 20% lower than the FP mode.
The Producer Accuracies of the different vegetation classes are detailed in Tab 4 for the L band. It is shown that only the FP mode is able to discriminate between the different forest classes. The partial polarimetric data introduce significant confusion between the forest classes with a PA lower than 79% for the 4 forest classes.
Among the different forest classes, the “Guava” and “Falcata” are especially difficult to be discriminated. On the contrary, the partial polarimetric modes allow a good discrimination between the 3 vegetation types that are
“bare soils”, “low vegetation”, and „forest” as testify the MPA of 94% obtained when only these 3 land use types are investigated.
The addition of the C band VV intensity and coefficient of variation improves significantly the performance of the DP and /4 modes with a MPA of 92% that is only 5% lower than for similar configuration involving full polarimetric data at L band (97%). This increasing is due to the better discrimination between the forest classes, as it is detailed in Tab 5. The MPA value obtained over only the 4 forest classes is now of 86% with respect to 63% when only the L band DP mode is used. The combination of the C band to AP mode at L band gives performance about 10% lower than the previous configuration (see Tab. 3). The lower performance of the AP mode principally comes from the unability to discriminate the “Fern land” from the “swampy vegetation” (not shown here).
Finally the FP mode gives very good results in all the classes with some confusion for the Falcata.
Table 4. SVM classification results for the FP, DP for L band: MPA (%) FP /4 HH/HV VV/H
V
HH/V V
Forest
Pinus 87 66 65 66 67
Falcata 82 61 55 23 54
Purau 89 77 77 77 79
Guava 91 66 59 58 65
Low vegetation
Fern
land 98 87 87 70 88
Swamp 100 97 97 95 98
No vegetation 99 96 95 94 97
MPA 92 79 77 69 78
Table 5. SVM classification results for the FP, DP for L band+CVV: MPA (%) FP /4 HH/H
V VV/HV HH/V
V
Forest
Pinus 99 98 98 98 98
Falcata 90 81 77 60 78
Purau 97 92 92 91 93
Guava 94 86 72 74 82
Low vegetation
Fern
land 98 91 92 84 94
Swamp 100 98 98 97 99
No vegetation 99 97 97 96 98
MPA 97 92 89 86 92
5. CONCLUSIONS
This study shows the interest of the full polarimetry data for the cartography in tropical environments. The simulation of different compact polarimetric modes like /4 and ALOS DP (in HH/HV and HH/VV
configuration) show similar results. When only L band is considered, it allows the discrimination of “forest”,
“low vegetation”, and “no vegetation” classes. However, when C band in VV polarisation is added to the L band (corresponding for example to one PALSAR plus one ASAR acquisitions) the results are significantly improved for the forest classes, leading to MPA lower of only 5% with respect to FP mode.
The lost of the differential phase between the two linear polarization channels acquisition, as in the case of ASAR AP mode reduces significantly the classification performance. In both DP and AP modes, the VV/HV acquisition shows the poorest performance with respect to HH/HV and HH/VV configurations.
Acknowledgement
The authors are grateful to Jean-Yves Meyer for the survey mission and thank the Government of French Polynesia and its Urbanism Department for providing the AirSAR, MASTER and Quickbird data required for this study.
References
[1] J.-C. Souyris, P. Imbo, R. Fjørtoft, S. Mingot, J.-S. Lee, “Compact Polarimetry Based on Symmetry Properties of Geophysical Media: The /4 Mode,” IEEE Trans. Geosci. Remote Sens., vol. 43, no. 3, Mar. 2005.
Page(s):634 – 646
[2] J. S. Lee, M. R. Grunes, R. Kwok, “Classification of multi-look polarimetric SAR imagery based on complex Wishart distribution,” Int. J. Rem. Sens., vol. 15, n° 11, 1994, 2299-2311.
[3] C. J. Burges, “A tutorial on support vector machines for pattern recognition, in Data mining and knowledge discovery,” U. Fayyad, Ed. Kluwer Academic, 1998, pp. 1-43.
[4] H. A. Zebker, J. J. van Zyl, and D.H.Held, “Imaging radar polarimetry frow waves synthesis,” J.Geophy.
Res, vol. 91, no B5. pp. 683-701, Jan. 1987.
[5] C. Lardeux, P-L. Frison, C. Tison, D. Deleflie, J-C. Souyris, J-P. Rudant, B. Stoll, “Comparison of compact polarimetric with full polarimetric radar data for land use discrimination based on SVM classification,” Proc.
POLinSAR, Frascati, Italie, Jan. 2007
[6] Guyon, I., Weston, J., Barnhill, S., & Vapnik, V., “Gene selection for cancer classification using support vector machines./ Machine Learning,” 46/(1-3), 389-422, 2002.
[7] Mattia F., Le Toan T., Souyris J.-C., De Cariolis G., Floury N., Posa F., Pasqueriello G., “The effect of surface roughness on multifrequency polarimetric SAR data,” IEEE Trans. Geosci. Remote Sensing, vol. 35, n°
4, pp 954-966, 1997.
[8] S. R. Cloude, E. Pottier, “A Review of Target Decomposition Theorems in Radar Polarimetry,” IEEE TGRS, vol. 34, no. 2, pp 498-518, Sept. 1995.
[9] A. Freeman and S. L. Durden, “A three-component scattering model for polarimetric SAR data,” IEEE Trans. Geosci. Remote Sens., vol. 36, no.3, pp. 963-973, May 1998.
[10] J. S. Lee, M. R Grunes, G. de Grandi, “Polarimetric SAR speckle filtering and its implication for classification,” IEEE Trans. Geosci. and Rem. Sens., vol. 37, n0 5, 1999, 2362-2373.