GEOGRAPHICAL REPORTS
OF TOKYO METROPOLITAN UNIVERSITY 47 (2012) 27-37
RELATION BETWEEN THE SEASONAL TRANSITION OF CIRCULATIONS AND PREMONSOON PRECIPITATION IN
THE HIMALAYAN FOOTHILLS
Azusa FUKUSHIMA and Hideo TAKAHASHI
Abstract The relation between the seasonal transition of circulations and the premonsoon precipitation in the Himalayan foothills is investigated. The daily precipitation data in Nepal provided by the Department of Hydrology and Meteorology (DHM) from 1976 to 2002 are used for the analysis. From the interannual variations in the precipitation amount, the years 1981, 1988, 1990, and 2000 are defined as wet (active convection) years for the premonsoon season. The years 1979, 1995, 1996, and 1991 are selected as dry (non-active convection) years. In both types of years, a remarkable seasonal change in the circulations is observed during the premonsoon season. Increases in the air temperature and water vapor flux gradually occur from February or March in the lower troposphere. In the middle troposphere, the temperature increases three months later compared with the temperature in the lower troposphere. The vertical condition means convective instability during the premonsoon season. After June, the stratification becomes stable because the temperature is increase in the middle troposphere. The process of the temperature increase correlates with the northward shift of the westerly jet axis in the upper troposphere.
The variation in precipitation amount for the premonsoon season is closely related to the strength of the subtropical jet stream. The strong jet axis is predominant in the dry years, and the weak jet axis is predominant in the wet years, with low and high air temperature anomalies, respectively, in the middle troposphere. The zonal wind at 200 hPa in February is a potential index for predicting the premonsoon rainfall amount in the Himalayan foothills.
Key words: premonsoon, precipitation, South Asia, subtropical jet stream, convective instability
1.Introduction
The premonsoon season precedes the summer monsoon season in South Asia. Previous studies mostly focused on seasonal changes in circulation for a step of the summer monsoon onset (e.g., Minoura et al. 2003). The characteristics of rainfall phenomena in the premonsoon season have been reported by several studies for Bangladesh and the Indochina Peninsula (Islam et al. 2005; Kiguchi and Matsumoto 2005). According to Yamane et al. (2010a), from their analysis of literature on the
- 26 - - 27 -
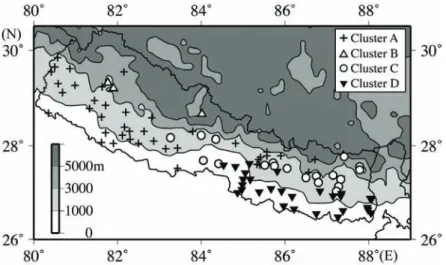
Fig. 1 Distribution map of the regions in Nepal classified by cluster analysis. The filled circles, filled triangles, open circles, and crosses represent Cluster A, Cluster B, Cluster C, and Cluster D, respectively. Shades indicate the altitude according to GTOPO30.
survey of storm in 1990–2005, most local storms that cause severe damage in Bangladesh occur in April. The environmental characteristics indicate that there are large amounts of convective available potential energy (CAPE) when the storms occur (Yamane et al. 2010b). Islam et al. (2005) reported that active convection accompanied by heavy thunderstorms occurs at night in northern Bangladesh during the premonsoon season. Kiguchi and Matsumoto (2005) pointed out that the enhancement of water vapor flux from the Bay of Bengal, which is accompanied by the passage of mid-latitudinal troughs, activates convection around the Indochina Peninsula during the premonsoon season.
Therefore, premonsoon rainfall phenomena can be considered to related to mid-latitudinal synoptic disturbances.
The subtropical jet stream is predominant on the southern slopes of the Himalayas during the non-monsoon season (Yasunari 1976a; 1976b). During the monsoon season, the jet stream moves north of the Tibetan Plateau (TP). The development of the Tibetan high accompanied by heating over the TP is closely related to the jet shift (Murakami 1958). Ueno et al. (2008) noted that a seasonal change in the circulation occurs in two steps from the premonsoon to monsoon seasons using observation data from the Khumbu Himalayas. First, the mountain-valley winds become weak at the same time as the subtropical jet stream shifts northward. Second, active convections accompanied by the formation of a monsoon vortex in the Bay of Bengal occur. The seasonal change in circulation around the Himalayas should be considered to be closely related to the shift of the jet stream. However, the relation between the seasonal variation of circulation and the precipitation amount with regard to the interannual variation was not investigated in previous studies.
The purpose of our study is to clarify the relationship between the seasonal variation in precipitation and circulation for the premonsoon season. To clarify the reason for annual variation of the premonsoon precipitation, we compared active and non-active convection years (defined by seasonal precipitation amount) using long-term rain gauge data for Nepal.
- 28 - - 29 -
2.Data and Method
Daily rainfall data for Nepal which we used was provided by the Department of Meteorology and Hydrology (DHM) from 1976 to 2002. The data was digitized by Maeno et al. (2004) using data books from 1976 to 1996. For the period from 1997 to 2002, we used digital data distributed by DHM.
Stations where less than 20% of the data covering the entire period under study were missing were utilized for the analysis.
Since premonsoon rainfall phenomena have been reported in the lower altitude areas around the Bay of Bengal (e.g., Islam et al. 2005) to the foothills of the Himalayas (Fukushima and Takahashi 2012), the precipitation data in the lower altitude areas of Nepal are suitable for the analysis. The precipitation data in the eastern Terai region as defined by Fukushima and Takahashi (2012) were used for the analysis to select several dry and wet years. The region was defined by cluster analysis (aggregative hierarchical clustering). Input data for the analysis were standardized pentad precipitation averaged for 27 years at each station. For the cluster analysis, the stations were combined in descending order corresponding to the distance between the stations; this was calculated according to Ward’s method using the Euclidean distance. We stopped the combinations when the distance drastically became larger than the prior combination steps. Four clusters were obtained (Fig. 1).
Because each cluster was regionally biased, we defined each cluster as a region. The eastern Terai region is located in southeastern Nepal and includes 26 stations. Most of the stations in the region are located in the lower plain area. This region is characterized by little precipitation in the winter and large amounts of precipitation in the spring and summer (the premonsoon and the monsoon).
We calculated the regional average of the daily precipitation dataset from the daily precipitation data for each station from the DHM. The premonsoon precipitation was defined as the integrated value of the averaged daily precipitation in the region from March to May. Rainfall days were calculated to the regional averaged rainfall day dataset from the daily precipitation data of each station. A rainfall day was defined as days where over 0.1 mm precipitation was observed. The wet and dry years were selected depends on secular variations of the premonsoon precipitation amount. The dry years were defined as the four years with the lowest premonsoon precipitation (below -1σ; σ is the standard deviation), and the wet years were defined as the four years with the highest premonsoon precipitation (over +1σ).
Japanese reanalysis data (JRA-25) from 1979 to 2002 were used for composite analysis of the atmospheric circulations (Onogi et al. 2007). The potential equivalent temperature (θe) and horizontal water vapor flux (qu, qv) were calculated using JRA-25.
3.Seasonal Transition upon Atmospheric Circulation Determination of wet and dry years
Previous studies pointed out that the rainfall phenomena during the premonsoon season are related to mid-latitudinal troughs (Kiguchi and Matsumoto 2005) and active convection (Islam et al. 2005).
The activity of disturbances (mid-latitudinal troughs) or convections is influenced by the seasonal or interannual variation of large-scale circulations. When the relation between precipitation and circulations is focused in this study, the characteristics on the seasonal variation of circulations are compared between active and non-active convection years. To define years of active or non-active
- 28 - - 29 -
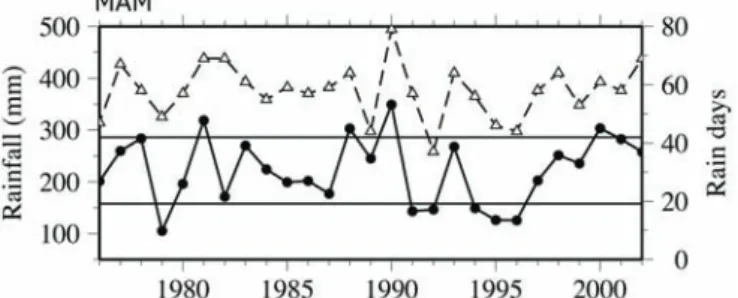
convection, interannual variation of the premonsoon precipitation is examined. Figure 2 shows the secular variation in the premonsoon precipitation of the eastern Terai region from 1979 to 2002. The averaged amount of premonsoon precipitation was 222 mm, and the standard deviation was 64 mm for the period. The maximum amount of precipitation observed was 348.8 mm in 1990, and the minimum amount observed was 105.5 mm in 1979. Owing to the interannual variation, there was no significant long-term trend for the period (evaluated by the Mann-Kendall rank test) (not shown).
Rainfall days, which were defined as days with over 0.1 mm rainfall, showed a similar variation as the precipitation.
The years 1981, 1988, 1990, and 2000 were defined as wet (active convection) years because the premonsoon precipitation exceeded +1σ (Fig. 2). In contrast, 1979, 1991, 1995, and 1996 were defined as dry (non-active convection) years because the premonsoon precipitation was below -1σ.
According to Maeno et al. (2004), years with abundant monsoon precipitation (June to September) for all stations used in this study were 1984, 1985, and 1996. In contrast, years with scarce monsoon precipitation were 1977, 1979, and 1992. In addition, heavy rainfall, which was defined by the five-year probable rainfall, occurred during the monsoon season in 1981. Compared to our results, 1979 and 1992 were dry years for both the premonsoon and the monsoon seasons. On the other hand, the wet years of monsoon precipitation according to Maeno et al. (2004) showed an opposite characteristic to the premonsoon precipitation in our study. The year 1981 was wet in terms of the premonsoon precipitation and had significant heavy rainfall during the monsoon season according to Maeno et al. (2004).
Fig. 2 Secular variation in premonsoon precipitation amount in eastern Terai (cluster D). The filled circles with solid lines indicate the premonsoon precipitation amount (average from March to May) in eastern Terai. The open triangles with dashed lines represent the premonsoon rainfall days in the region. The upper and lower solid horizontal lines represent +1σ and -1σ (σ:
standard deviation) values of the premonsoon precipitation amount, respectively.
Seasonal variation of subtropical jet stream
To compare the seasonal transition of circulations, we performed a composite analysis of circulations. The time-latitude cross section of the zonal wind for 86.25°E at 200 hPa is shown in Fig.
3. The five-day running average values were represented. The composite values for wet and dry years are shown in Figs. 3a and 3b, respectively. Figure 3c shows the difference between the dry and wet years (only values with a 95% statistical significance as tested by Welch’s t-test are shown). The average from 1979 to 2002 is shown in Fig. 3d. The eastern Terai region in Nepal is located around 26°–30°N.
- 30 - - 31 -
Fig. 3 Time-latitudinal cross section of zonal wind on 86.25°E at 200 hPa. The zonal wind is represented by the contour (m s-1). The vector indicates the wind vector (m s-1). The composites of (a) wet years and (b) dry years, (c) difference between the dry and wet years, and (d) average of the zonal wind from 1979 to 2002 are shown. Anomaly values with 95% statistical significance as tested by Welch’s t-test are shown only in (c).
On average, a strong westerly wind axis is located around 30°N from February to the middle of April. The axis begins to weaken in the beginning of May and moves to around 40°N from June to August. After June, the easterly wind is predominant south of 30°N. The strong westerly is predominant over Nepal from the winter to premonsoon seasons. For dry and wet years, the strong westerly wind is also predominant in February and March (Figs. 3a and 3b). However, the westerly is stronger in the dry years than in the wet years. The westerly anomaly is predominant from the middle of February to the end of May (whole period of the premonsoon). There is a significant difference in westerly wind speed between the dry and wet years of over 5 m s-1 (Fig. 3c). The positive (westerly) anomaly in Fig. 3c shows the absence of the jet axis during May in the wet years. This suggests an early shift of the jet in the wet years. On the other hand, owing to the predominance of the easterly wind during the monsoon season, the positive anomalies after June indicate the comparative weakness of the easterly wind during the monsoon season in the dry years (Fig. 3c). As a result, the dry years are characterized by a strong westerly dominance in the premonsoon season and a weak easterly in the monsoon season. The wet years have opposite characteristics to the dry years.
Vertical distribution of air temperature
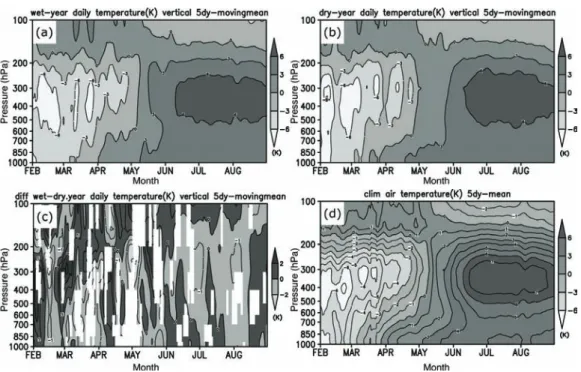
Figure 4 shows the time-latitudinal cross section of the vertical condition for the air temperature (T) averaged in the area covering 26.25°–27.5°N and 85°E°–88.75°E. The vertical axis means the
- 30 - - 31 -
height, and the horizontal axis means the month from February to August. The composite values are represented by the five-day running average of anomalies from the annual average (Figs. 4a and 4b).
The difference between the dry and wet years is shown in Fig. 4c with 95% significance as tested by Welch’s t-test. Figure 4d shows the normal condition of T averaged for 1979–2002.
Fig. 4 Time-vertical cross section of air temperature. The air temperature is represented by the contour (K). The represented values are the five-day moving averages of the regional average at 26.25°–27.5°N and 85°–88.75°E. The composites of the (a) wet years and (b) dry years, (c) difference between the dry and wet years, and (d) average of the zonal wind from 1979 to 2002 are shown.
Anomalies from the annual mean at each height are shown in (a), (b), and (d). Anomalies with 95%
statistical significance as tested by Welch’s t-test are shown only in (c).
The normal condition shows that the process of increasing temperature in the lower troposphere (below 500 hPa) occurs from March to May (Fig. 4d). From April to June, a clear increase in T occurs in the middle troposphere (the maximum is located at 300 hPa). The increase in T is related to the development of the Tibetan high in the monsoon season. The lower T than the surrounding levels is distributed in the middle troposphere from February to May. This is due to the difference in stages for the temperature increase between the lower and upper troposphere. The process of increasing temperature in the lower troposphere was similar for the wet and dry years (Figs. 4a and 4b). The main difference was in the middle to upper troposphere. T in wet years increases faster than in dry years in the middle troposphere for May (Figs. 4a and 4b). The anomaly shows a significant difference of over 3 K at 300 hPa in mid-May (Fig. 4c). Moreover, the difference in T also appears in the middle troposphere for February (Fig. 4c). After June, no significant anomalies appear at all levels.
The difference in T means the predominance of low temperature during the dry years and the predominance of high temperature for the wet years in the middle troposphere during the premonsoon
- 32 - - 33 -
season. When there is a strong prevailing subtropical jet stream over the foothills of the Himalayas, the temperature is lower in the middle troposphere. As a result, the T field correlates to the westerly jet shift in each of the wet and dry years. However, the warming process during the seasonal transition in the lower troposphere has almost the same values. In addition, the seasonal fixing of the temperature increase in the lower troposphere during the dry and wet years is of interest considering the onset mechanism of the monsoon circulation.
Seasonal variation of water vapor flux
The result in the previous section shows that there is a significant increase in the air temperature of the lower troposphere during the premonsoon season (Fig. 4). The water vapor transport was assumed to increase with the temperature increase. The southerly component of the water vapor flux (WV-flux) is considered to play an important role in water vapor transport from the sea (the Arabian Sea or Bay of Bengal) to the foothills of the Himalayas. Figure 5 shows the vertical cross section of the southerly component of the WV-flux (qv) (contour) and the vector of the WV-flux. The vertical axis represents the height, and the horizontal axis represents the month (February to August). The values were calculated as the average for the area covering 26.25°–27.5°N and 85°–88.75°E. Increasing trend of qv in the lower troposphere below 700 hPa observes from February to May (Fig. 5d). The height of the contour of 0.01 kg kg-1 m s-1 reaches 600 hPa in July and August. During the wet years, the qv below 700 hPa begins to increase in the beginning of February (Fig. 5a). On the other hand, the qv starts to increase gradually in the dry years during March to April (Fig. 5b). Therefore, the amount of water vapor transport during the premonsoon season is larger in the wet years than in the dry years. However, the differences are not significant in statistically (Fig. 5c).
Fig. 5 Same as Fig. 4, but for southerly components of water vapor flux with the contour (kg kg-1 m s-1).
- 32 - - 33 -
The qv anomaly represents a significant anomaly in June (Fig. 5c). In the middle of June, qv decreases temporarily in the wet years (Fig. 5a). In contrast, qv decreases from the end of June to the beginning of July in the dry years (Fig. 5b). The results suggest a delay in the seasonal change of qv in the dry years relative to the wet years.
Seasonal variation of convective instability
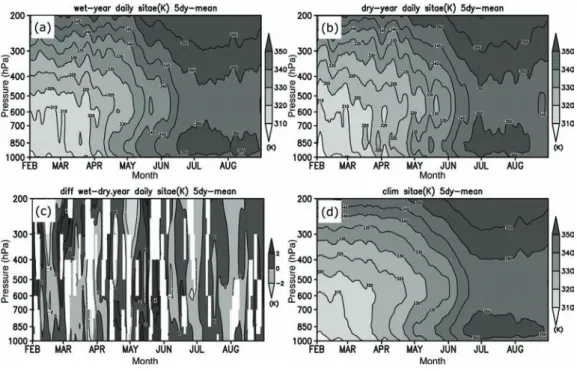
The vertical stratification of the atmosphere is discussed here. The equivalent potential temperature (θe) is a function of the temperature and water vapor amount. If θe becomes large with increasing height, stratification of the atmosphere has large convective instability (i.e., high possibility of the convection). Figure 6 shows the time-vertical cross sections of the equivalent potential temperature (θe) on a composite of the dry and wet years (Figs. 6a and 6b), on the anomaly field (Fig.
6c), and on the normal value averaged for 24 years (Fig. 6d). The coordinate axes and averaged area are the same as those for Figs. 4 and 5.
Fig. 6 Same as Fig. 4, but for equivalent potential temperature with the contour (K).
Under normal conditions, θe over 320 K is maintained from February to March below 700 hPa (Fig. 6d). The θe has an increasing trend from April to June in the lower troposphere. However, a lower value of θe than the surrounding levels is predominant in the middle troposphere at around 400–700 hPa from April to June. This means that there is convective instability between the middle and lower troposphere. After mid-June, the stratification becomes stable by increasingθe of over 345 K at almost all levels of the troposphere. One of the reasons for the increasing θe in the monsoon season is the high temperature in the middle troposphere and the large amount of water vapor flux in the lower troposphere (Fig. 5). In the wet years, the amount of θe is significantly larger than that in the dry years
- 34 - - 35 -
from mid-April to May in the lower troposphere below 700 hPa (Figs. 6a and 6c). The θ
e significantly remains below 330 K for May at 600 hPa in the dry years (Figs. 6b and 6c). A significant positive difference in the middle troposphere (around 700 to 200 hPa) in the beginning of March is due to the air temperature anomaly (Figs. 4c and 6c). On the other hand, another positive anomaly from the end of May to early June is closely related to the WV-flux anomaly (Figs. 5c and 6c). In contrast, there is little difference after June.
4.Interannual Variation upon Seasonal Transition of the Circulations for the Premonsoon Season
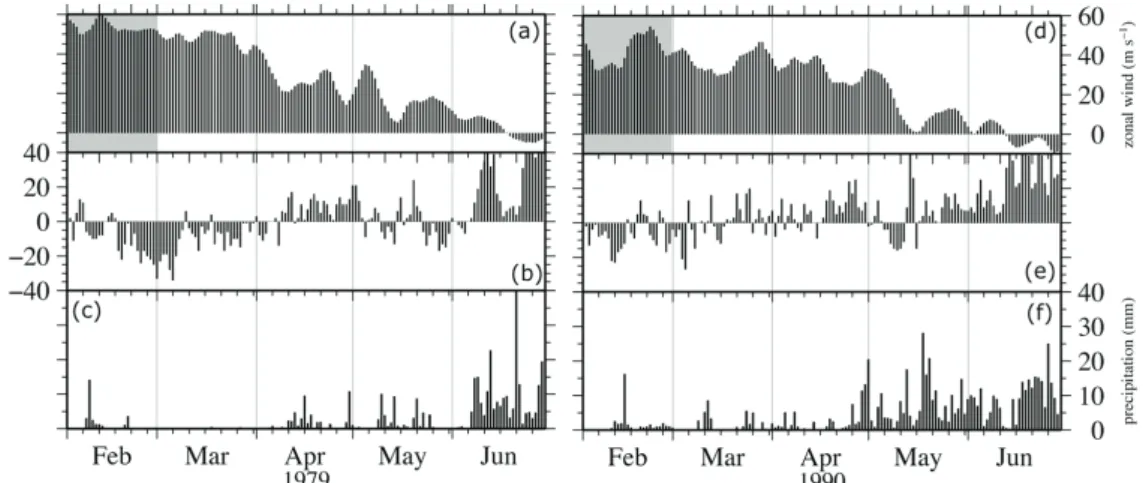
Figure 7 shows the time evolution of the atmospheric condition and precipitation for two years. In the composite analysis, the year of 1979 (left panel) was used for the dry year, and 1990 (right panel) was used for the wet year. The spatial averaged zonal wind at 200 hPa indicates the strength of the subtropical jet stream, and the spatial averaged horizontal vorticity in the vicinity of the Bay of Bengal at 850 hPa roughly represents the monsoon depression activity (Figs. 7a, 7b, 7d, and 7e). In February and March of 1979, a strong westerly (positive values of the zonal wind) was predominant (Fig. 7a).
The vorticity indicated negative values during the prevailing westerly (Fig. 7b). As the westerly rapidly decreased from April to May, the frequency of positive vorticity increased. In contrast, the westerly was very weak in 1990 compared to that in 1979 (Fig. 7d). The vorticity indicated frequent positive values from February to June (Fig. 7e). In both years, the rainfall increased when the cyclonic vorticity increased with the weak westerly (Figs. 7c and 7f). In addition, the positive vorticity greatly increased in June when the predominant wind switched to an easterly (Figs. 7a, 7b, 7d, and 7f). This corresponded to the start of monsoon depression activity in the vicinity of the Bay of Bengal.
Fig. 7 Time evolution of the upper zonal wind and the vorticity near the Bay of Bengal in dry and wet years.
(a, d) Regional averaged zonal wind at 200 hPa (averaged for 22.5°–27.5°N and 80°–90°E) (m s
-1
); (b, e) regional averaged horizontal vorticity at 850 hPa (averaged for 20°–25°N and 85°–90°E) (10
-6
s
-1
), and (c, f) daily precipitation in eastern Terai (mm day
-1
). The left panel shows a dry year (1979), and the right panel shows a wet year (1990).
- 34 - - 35 -
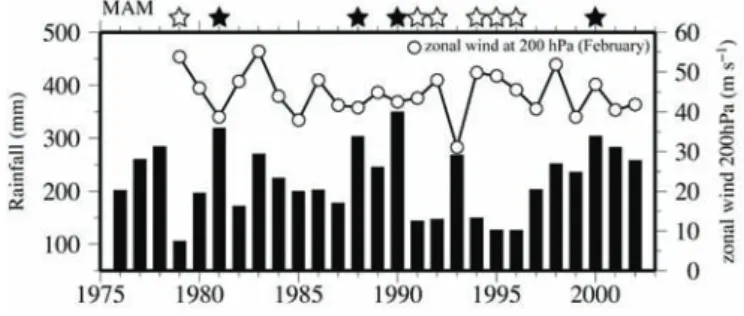
As a result, the strength of the westerly in winter was found to be an important factor for the interannual variation of the amount of premonsoon rainfall. Figure 8 shows the relation between the premonsoon precipitation amount in eastern Terai and the averaged zonal wind at 200 hPa in February.
The correlation coefficient (R) was -0.38 for the period from 1979 to 2002. However, the extracted years of over 1σ (absolute value) (shown as stars in Fig. 8) indicate an R of -0.72. The results suggest that remarkably strong and weak westerlies have a large influence on the premonsoon precipitation of eastern Terai in Nepal. While strong westerlies tend to correspond to dry years, weak westerlies tend to correspond to wet years.
5.Conclusion
We investigated the interannual variability of the premonsoon precipitation in eastern Terai and the seasonal change in the circulation from winter to summer. The wet years were defined as 1981, 1988, 1990, and 2000 based on the amount of premonsoon precipitation. In contrast, 1979, 1991, 1995, and 1996 were defined as dry years. From the results, a weak subtropical jet stream correlates with a wet year, and a strong jet stream correlates with a dry year, with high and low temperatures, respectively, in the middle troposphere. These characteristics are coupled in both the lower and middle troposphere
Fig. 8 Secular variation in premonsoon precipitation and upper zonal wind in February. The premonsoon rainfall amount is represented in bars, and the averaged zonal wind at 200 hPa in February (averaged for 22.5°–27.5°N and 80°–90°E) is shown as open circles with a solid line. The filled stars indicate dry years (below -1σ of premonsoon rainfall), and the open stars indicate wet years (over +1σ of premonsoon rainfall).
for both types of years. Moreover, when we focused on the progression phase of the circulation, the shift in the subtropical jet stream in the wet year occurred much earlier than that in the dry year. In addition, the southerly WV-flux in the lower troposphere increased from early March in step with the shift in the jet stream.
The convective instability occurs around the Himalayas in the premonsoon season owing to the lower temperature condition in the middle troposphere and the increased water vapor transport in the lower troposphere. The vertical condition of the equivalent potential temperature indicated no clear differences between the dry and wet years for the premonsoon season. Although a quantitative difference in the components existed between the dry and wet years, the strength of the convective
- 36 - - 37 -
instability was almost the same (not shown). This is due to the coupled (fixed) variability of the middle and lower troposphere. Much of the southerly WV-flux in the lower troposphere and higher temperature are feature in the wet years; the colder temperature in the middle troposphere and less of the southerly WV-flux are feature in the dry year. The difference in atmospheric conditions in the middle and the lower troposphere is closely related to the strength of the subtropical jet stream.
The interannual variability of the premonsoon precipitation is correlated with the strength of westerlies in February (Fig. 8). In particular, this correlation is high in remarkably wet and dry years.
This correlation can potentially be used to forecast the amount of premonsoon rainfall.
References
Fukushima, A. and Takahashi, H. 2012. Regional and seasonal variability of rainfall characteristics in Nepal. Geographical Review of Japan 85: (In press). **
Islam, M. N., Terao, T., Uyeda, H., Hayashi, T. and Kikuchi, T. 2005. Spatial and temporal variations of precipitation in and around Bangladesh. J. Meteor. Soc. Japan 83: 21-39.
Kiguchi, M. and Matsumoto, J. 2005. The rainfall phenomena during the pre-monsoon period over the Indochina Peninsula in the GAME-IOP year, 1998. J. Meteor. Soc. Japan 83: 89-106.
Maeno, K., Omori, H., Matsumoto, J. and Hayashi, T. 2004. Characteristics of daily precipitation during the monsoon season in Nepal. Journal of Geography (Chigaku Zasshi) 113: 512-523. **
Minoura, D., Kawamura, R. and Matsuura, T. 2003. A mechanism of the onset of the South Asian summer monsoon. J. Meteor. Soc. Japan 81: 563-580.
Murakami, T. 1958. The sudden change of upper westerlies near the Tibetan Plateau at the beginning of summer season. J. Meteor. Soc. Japan 36: 239-247. **
Onogi, K., Tsutsui, J., Koide, H., Sakamoto, M., Kobayashi, S., Hatsushika, H., Matsumoto, T., Yamazaki, N., Kamahori, H., Takahashi, K., Kadokura, S., Wada, K., Kato, K., Oyama, R., Ose, T., Mannoji, N. and Taira, R. 2007. The JRA-25 reanalysis. J. Meteor. Soc. Japan 85: 369-432.
Ueno, K., Toyotsu, K., Bertolani, L. and Tartari, G. 2008. Stepwise onset of monsoon weather observed in the Nepal Himalaya. Mon. Wea. Rev 136: 2507-2522.
Yamane, Y., Hayashi, T., Dewan, A. M. and Akter, F. 2010a. Severe local convective storms in Bangladesh: Part I. Climatology. Atmos. Res 95: 400-406.
Yamane, Y., Hayashi, T., Dewan, A. M. and Akter, F. 2010b. Severe local convective storms in Bangladesh: Part II. Environmental conditions. Atmos. Res 95: 407-418.
Yasunari, T. 1976a. Spectral analysis of monsoonal precipitation in the Nepal Himalaya. Seppyo 38: 59-65.
Yasunari, T. 1976b. Seasonal weather variation in Khumbu Himal. Seppyo 38: 74-83.
Yasunari, T. and Fujii, R. 1983. Himalaya no Hyoga to Kiko (Glacier and Climate of the Himalayas), Tokyo: Tokyo-do: 254. *
(*: in Japanese, **: in Japanese with English abstract)
- 36 - - 37 -