PRODUCTION RATE OF MORUS ALBA POLLEN GRAINS IN AN ABANDONED M.ALBA PLANTATION
Jota KIYONAGA*
Abstract As a basic study for pollen analysis, the production rate of Morus alba (white mulberry) pollen grains in an abandonedM. alba plantation was determined over a three-year period from 1997 to 1999. The number of pollen grains per male catkin was assessed and the fall rate of male catkins was measured using five litter traps. The mean production rate was 2.6 × 10¹² grains ha-1yr-1(range = 2.2-3.4 × 10¹²grains ha-1yr-1). This is near the lower end of the range of pollen production rates that have been obtained from many other tree species across several forests.
Resumo en Esperanto Kiel fundamenta studado por polen-analizo, polenera produktaĵo por jaro de morsarbo, Morus albaen forlasita M. albaplantejo estis determinita dum tri-jara periodo de 1997ĝis 1999. La nombro de poleneroj por vira infloresko estis esplorita, kai la defalonombro por jaro de vira infloreskoj estis mezrita, uzante kvin rubajn kaptilojn, t.e. sakojn por ricevi defalintajn infloreskojn. La meza produktaĵ-rilatumo de poleneroj estis 2.6 × 10¹² eroj hektaro-1 jaro-1 (amplekso estis 2.2-3.4 × 10¹²eroj hektaro-1jaro-1).Ĉi tiu estas apud malalta fino de amplekso de polena produktaĵo, kio estis akirita por multaj aliaj arbospecioj el kelkaj arbaroj.
Key words:Pollen grains, production rate,Morus alba, forest stand, abandoned plantation
1. Introduction
The results of pollen analysis are usually expressed as the percentage of fossil pollen of each taxon at each horizon of a sediment section. Some pollen-analytical results are expressed as pollen influx or the number of pollen grains per cm3of sample sediments. However, neither of these approaches directly indicates the relative dominance of particular pollen-resource plant taxon, because there is great variation in the production and dispersal patterns of pollen grains across taxa (Erdtman 1969; Faegri et al. 1989; Moore et al. 1991). Thus numerical studies on pollen production and dispersal are required to reconstruct paleovegetation. The studies on the production rate of pollen grains for many species are positioned as a part of these studies.
In Japan, pollen production rates in forests have been investigated since the 1980s in order to assess the productivity of forest ecosystems (e.g. Saito and Takeoka 1983, 1985; Saito et al.1991;
Saito et al.2007). The previous studies determined pollen production as the production rate of pollen grains, i.e. the number of pollen grains produced per unit area per year by dominant in the
* Bureau of Construction, Tokyo Metropolitan Government.
forest stand. These studies provide important data that may be used as a basis for pollen analysis studies. Accordingly, some palynologists have studied the production rates of pollen grains in forest stands since the 1990s (e.g. Kiyonaga 1991; Miyake et al.1999; Kiyonaga 2002).
The present study aimed to obtain a preliminary measure of the production rate ofMorus alba L. (white mulberry) pollen grains in an oldM. albaplantation that has a forest physiognomy of this species, as a basic study for pollen analysis. M. albabelongs to Moraceae, whose fossil pollen are occasionally found at remarkably high percentages in sediments of the late prehistoric age and historic times in central Japan (e.g. Tsuji et al.1992; Kiyonaga 1999; Yoshikawa 2004).
2. Method
The production rate of M. albapollen grains (P) was determined by multiplying the number of pollen grains per male catkin of M. alba(PC) by the production rate of male catkins of M. albain a M. alba-dominated forest stand (M) using equation (1).
P=Pc·M (1)
Number of pollen grains per male catkin
Branches bearing male catkins were collected from aM. albasample tree (DBH: Diameter at breast height = 21 cm, height = 6 m) that grew near the study stand. Branches were taken just before pollen release in mid-April in 1997, 1998, and 1999.
Male catkins of M. albahold many male flowers, therefore, the number of male flowers per male catkin was first counted for all male catkins on the collected branches. The number of anthers per male flower was then counted for flowers randomly sampled from all male catkins counted.
For above two-step counting a stereoscopic microscope was used. Finally, the number of pollen grains per anther was counted for all anthers on male flowers chosen randomly from all male flowers counted. For this procedure, the anther was torn open using a needle and the pollen grains in the anther were washed in a single drop of water on a glass slide. This water was then evaporated in a desiccator, and the pollen grains remaining on the slide were covered with glycerin and overlaid with a cover glass. The total number of M. alba pollen grains on the slide was counted under × 100 magnification using a biological microscope with a mechanical stage and an ocular micrometer.
The mean number of male flowers per male catkin (f), mean number of anthers per male flower (a) and mean number of pollen grains per anther (p) were determined for the sample tree for each year. These values were then used to calculate the number of pollen grains per male catkin (PC) using equation (2).
PC=f·a·p (2)
Fig.1 Map showing the study stand, according to the 1:25,000 topographic map "Musashi-Fuchu"
published in 2000 by Geospatial Information Authority of Japan.
Production rate of male catkins
The production rate of male catkins ofM. albawas measured by counting the number of fallen male catkins in the study stand, which was dominated by M. albatrees.
Because the male catkins of M. albafall after flowering without coming apart, the number of fallen male catkins within a unit area during the flowering season must be equal to their production rate (M). Consequently, Mcan be determined by counting the number of male catkins in the litter traps set beneath the canopy of the stand.
The study stand is a forest in Tokyo Metropolitan University, approximately 40 km west of the center of Tokyo City. It is situated on a gentle side slope facing south in the northwestern part of Tama Hills (Fig. 1). The area of the study stand is ca. 0.01 ha, and the forest canopy was 13 m high.
The stand was composed of three vertical layers: a tree layer, a shrub layer and a herbaceous layer. The tree layer was strongly dominated by M. alba, with only this species present in the center of the stand, but a few trees ofQuercus serrata,Carpinus laxifloraand Prunus jamasakura are also present toward the periphery. The shrub layer was strongly dominated byArundinaria chinowith a small number of additional species such as Magnolia kobus, Neolitsea sericea, Cornus controversa and Ligustrum japonicum. Because of the dense growth of A. chino, the herbaceous layer contained very few other plants, with only a fewLiriope platyphylla,N. sericea, Rubus palmatus,Aralia elata,Aucuba japonicaand L. japonicumpresent. This stand is considered to be an abandoned mulberry plantation because of the dense distribution of M. albatrees and thick growth of A. chino. Supporting this estimation, the base map for a 1:10,000 vegetation map
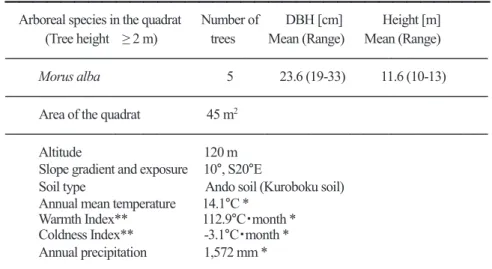
Table 1 General description of the study stand
―――――――――――――――――――――――――――――――――――
Arboreal species in the quadrat Number of DBH [cm] Height [m]
(Tree height ≥ 2 m) trees Mean (Range) Mean (Range)
―――――――――――――――――――――――――――――――――――
Morus alba 5 23.6 (19-33) 11.6 (10-13)
―――――――――――――――――――――――――――――――――――
Area of the quadrat 45 m2
―――――――――――――――――――――――――――――――――――
Altitude 120 m Slope gradient and exposure 10°, S20°E
Soil type Ando soil (Kuroboku soil) Annual mean temperature 14.1°C *
Warmth Index** 112.9°C・month * Coldness Index** -3.1°C・month * Annual precipitation 1,572 mm *
―――――――――――――――――――――――――――――――――――
* Based on climatic data at Hachioji Met. Sta., 8 km northwest from the study stand(Japan Meteorological Agency 2008)
** Kira (1977)
Fig. 2 Crown projection diagram showing the coverage of the quadrat and litter traps in the study stand.
as mulberry plantation. Although the age of the stand is not clear, it is estimated that the mulberry plantation was abandoned 10–20 years before, as the vegetation in this area is shown as not mulberry plantation but broadleaved forest on a 1:2,500 topographic map drawn in 1990 that was published by Tokyo Metropolitan Government.
A 45 m2quadrat (Table 1 and Fig. 2) was situated in the study stand. Five litter traps were placed in this quadrat for one or one and half months each spring during the flowering period:
April 20–May 18, 1997; April 18–May 23, 1998; April 17–May 30, 1999.
The litter traps used in this study were made of cotton cloth bags attached to 80 cm diameter wire frames. The mouth of each litter trap had an area of 0.5 m2and was 90 cm above the ground.
Production rate of pollen grains
Based on the results obtained in the above procedure, the production rate of pollen grains in each year was determined using equation (1).
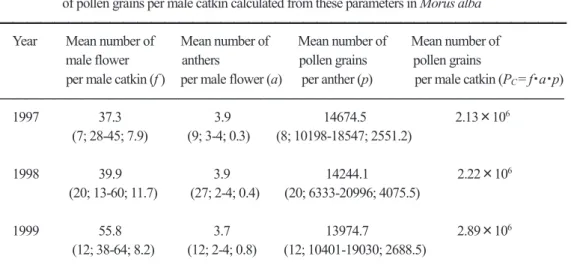
Table 2 Results of counting male flowers per male catkin, anthers per male flower and pollen grains per anther, obtained from a sample tree whose DBH and height were 21 cm and 6 m, and numbers of pollen grains per male catkin calculated from these parameters in Morus alba
―――――――――――――――――――――――――――――――――――――――――
Year Mean number of Mean number of Mean number of Mean number of male flower anthers pollen grains pollen grains
per male catkin (f) per male flower (a) per anther (p) per male catkin (PC=f・a・p)
―――――――――――――――――――――――――――――――――――――――――
1997 37.3 3.9 14674.5 2.13×10⁶
(7; 28-45; 7.9) (9; 3-4; 0.3) (8; 10198-18547; 2551.2)
1998 39.9 3.9 14244.1 2.22×10⁶
(20; 13-60; 11.7) (27; 2-4; 0.4) (20; 6333-20996; 4075.5)
1999 55.8 3.7 13974.7 2.89×10⁶ (12; 38-64; 8.2) (12; 2-4; 0.8) (12; 10401-19030; 2688.5)
―――――――――――――――――――――――――――――――――――――――――
Figures in a parenthesis show the number of samples, range and standard deviation in order.
Table 3 Annual fall rates of male catkins for Morus alba, measured with five litter traps in the study stand, and estimated annual production rates for the number of Morus albapollen grains in the study
stand
* Mean±standard deviation for five litter traps (0.5 m2each)
3. Results and Discussion
The values of f,a,pand PCdetermined in this study are shown in Table 2. There was little variation in the values of aand p, with a ratio of maximum to minimum (max:min) ratio of approximately 1.0. In contrast, there was slightly significant variation in the values of f, resulting in a slightly significant variation in the values of PC(max:min ratio = 1.5 and 1.4, respectively).
The values of Pc,Mand Pare shown in Table 3. The value of Mdecreased year by year, leading to a significant max:min ratio of 2.1. However, the year-to-year fluctuation in PCand M showed different patterns, resulting in not so large variation inP(2.2-3.4 × 10¹²grains ha-1yr-1; max:min ratio = 1.6). The mean value of Pacross the three years was 2.6 × 10¹²grains ha-1yr-1.
This value is similar to, but near the lower end of, the pollen production rates that have been obtained for other species (1011-1013grains ha-1yr-1). Similar pollen production values have been obtained for a giant tree forest of Abies firma(3.0 × 10¹²grains ha-1yr-1; Saito et al.2007) , a young Cryptomeria japonicaforest (2.8 × 10¹²grains ha-1yr-1; Hashizume and Sakamoto 1992) , an old Juglans ailanthifoliaforest (2.0 × 10¹²grains ha-1yr-1; Saito 1986), a youngCastanea crenataand Q. serrataforest (2.0 × 10¹²grains ha-1yr-1; Kiyonaga 1995), a mature Quercus myrsinaefolia forest (2.1 × 10¹²grains ha-1yr-1; Kiyonaga 2003) and a young Quercus acutissimaforest (2.1 × 10¹²grains ha-1yr-1; Kiyonaga 2009).
It should be noted that the pollen production rate of M. albawas obtained from only one stand in the present study. Therefore, additional measurements from various other stands of this species are required to improve our understanding of the production rates of this species. Additionally, assessments of pollen production rates of other Moraceae species are also required as basic study for pollen analysis.
Acknowledgements
This paper is dedicated with sincere gratitude to Professor Haruo Yamazaki on the occasion of his retirement from Tokyo Metropolitan University.
References
Erdtman, G. 1969. Handbook of Palynology, an Introduction to the Study of Pollen Grains and Spores.New York: Hafner Publishing Co.
Faegri, K., Iversen, J., Kaland, P. E. and Krzywinski, K. 1989. Textbook of Pollen Analysis, 4th Ed.
London: John Wiley & Sons.
Hashizume, H. and Sakamoto, D. 1992. Studies on pollen production in Cryptomeria japonica and Chamaecyparis obtusa forests.Research Bulletin of the Tottori University Forests 21:
31–50.**
Japan Meteorological Agency 2008. Normals, ver.7, for the period 1971–2000, CD-ROM, Japan Meteorological Business Support Center.*
Kira, T. 1977. Forest vegetation of Japan 1.1 Introduction. In Primary Productivity of Japanese Forests.eds. Shidei, T. and Kira, T., JIBP Synthesis 16: 1–9. Tokyo: University of Tokyo Press.
Kiyonaga, J. 1991. Production rate of Quercus serrata pollen grains in a secondary Quercus serrataforest. Geographical Reports of Tokyo Metropolitan University 26: 219–226.
Kiyonaga, J. 1995. Production rate of pollen grains of Castanea crenatain a Quercus serratasecondary forest. Geographical Reports of Tokyo Metropolitan University30: 81–88.
Kiyonaga, J. 1999. Kafunkasekigun kara mita Ikego isekigun to sono shuuhen-iki no shokuseishi (Vegetational history in and around Ikego Sites based on pollen analysis). In Ikego isekigun X, No.1-A chiten, Dai 4 bunsatsu: Beppen shizenkagaku bunseki (Ikego Sites X, Point No.1-A, 4:Scientific analysis), Kanagawa Archaeology Foundation, 127–160. *
Kiyonaga, J. 2002. Production rate of Quercus glauca pollen grains in a Quercus glauca secondary forest. Geographical Reports of Tokyo Metropolitan University 37: 61–66.
Kiyonaga, J. 2003. Production rate of pollen grains in Quercus myrsinaefolia stands. Japanese Journal of Palynology 49: 25–31.**
Kiyonaga, J. 2009. Production rate of Quercus acutissimapollen grains in a Quercus actissima secondary forest stand.Geographical Reports of Tokyo Metropolitan University 44: 55–62.
Miyake, N., Ishikawa, S., Nehira, K. and Nakagishi, N. 1999. Pollen deposition patterns in a temperate mixed forest on Mt. Kuishi, southwestern Japan: I. Pollen production rates of Quercus acuta and effects of the fall of the male catkins on pollen deposition. Japanese Journal of Palynology 45: 13–26.*
Miyawaki, A. and Tohma, H. 1975. Vegetation und Vegetationskarte des NW-Teils in neuen Stadt Tama (Westl. Tokyo). In Ökologische Studien für Umweltschutz des NW-Teils in neuen Stadt Tama (Westl. Tokyo), Herausgegeben von Miyawaki, A., 1–92.***
Moore, P. D., Webb, J. A. and Collinson, M. E. 1991. Pollen Analysis. 2nd edition. Oxford:
Blackwell Scientific Publications.
Saito, H. 1986. Pollen production rates of Siebold walnut (Juglans ailanthifolia) stands. The Scientific Reports of Kyoto Prefectural University,Agriculture. 38: 7–16.**
Saito, H., Itsubo, T. and Takeoka, M. 1991. Production rates of reproductive organ in Quercus serrata stands: the investment of photosynthates in seed production. Bulletin of the Kyoto Prefectural University Forests. 35: 1–14.**
Saito, H. and Takeoka, M. 1983. Pollen production in 60-year-old plantations of Chamaecyparis obtusa.Japanese Journal of Ecology 33: 365–373.**
Saito, H. and Takeoka, M. 1985. Pollen production rates in a young Japanese red pine forest.
Japanese Journal of Ecology 35: 67–76.
Saito, H., Tominaga, K. and Doi, A. 2007. Pollen production of an Abies firmaforest in Oohara, northern Kyoto.Japanese Journal of Palynology 53: 47–51.**
Tsuji, S., Minaki, M. and Koike, H. 1992. Plant fossil assemblages and vegetational history in the western Shimousa Upland, central Japan.The Journal of Phytogeography and Taxonomy 40:
47–54.**
Yoshikawa, M. 2004. Aota-iseki ni okeru joumonjidai banki ikou no kafunkaseki-gun (Fossil pollen assemblages from sediments of last Jomon period from Aota Site). In Nihonkai engan Toohoku-jidoushadou kankei hakkutsu chousa houkokusho V, Aota iseki: Kanren-shokagaku shashin-zuhan hen (Reports of excavation concerned with Tohoku Superhighway along coastal area facing Japan Sea V, Aota Site: Concerned scientific reports and photographic plates), Niigata Prefectural Board of Education and NiigataArchaeology Survey Agency. 35–42.*
(*: in Japanese, **: in Japanese with English abstract, ***: in Japanese with German abstract)