• 検索結果がありません。

Establishing the 3D model of the underground water management system at southern Kyoto-city

N/A
N/A
Protected

Academic year: 2021

シェア "Establishing the 3D model of the underground water management system at southern Kyoto-city"

Copied!
7
0
0

読み込み中.... (全文を見る)

全文

(1)

Establishing the 3D model of the underground water management system at southern Kyoto‑city

著者 Kitaoka Takafumi, Kusumi Harushige journal or

publication title

Proceeding of EIT‑JSCE Joint International Symposium 2009

year 2009‑09‑06

URL http://hdl.handle.net/10112/5716

(2)

Establishing the 3D model of the underground water management system at southern Kyoto-city

Takafumi Kitaoka

1

and Harushige Kusumi

2

1Graduate school of Kansai University E-mai

2 Dept. of Civil and Environment Engineering, Kansai University E-mail : [email protected]

ABSTRACT:

The Kyoto city has various traditional cultures and industries. One of these is the production of Japanese sake, for which Fushimi-Ward is famous. The purpose of my study is to establish a 3D management model for underground water. This area has a lot of ground water of good water quality suited to making Japanese sake, and consequently. The underground water of the Fushimi area has been protected by the Fushimi sake brewing union. They are famous for preventing the construction of the Nara subway suggested in the 3rd year of Showa. They protect underground water from various potentially harmful construction projects. However the construction of a sewer was started last year in Fushimi Ward. They worry about the effects of the construction. I believe that this management model will be useful in predicting the effects of the underground construction. This 3D model will be needed to save the underground water in the Fushimi area. We have to protect the underground water in the Fushimi area and in order to protect traditional Japanese sake.

1. INTRODUCTION

Fushimi Ward located in the south of Kyoto-City is composed of the plains part along three rivers, Katsura river, Kamogawa river, Uzi river, the Higashiyama mountain range with the southern end of Momoyama hill. Fushimi Ward is rich in underflow water. The underground water of Fushimi is traditional industry, and the abundant underground water has been used for a long time.

However, sewers have been constructed since last year in Fushimi Ward. It is important to understand the behavior of underground water flow, in order that, any contamination can be rapidly responded to.

The purpose of my study is to establish a 3D management model for underground water in this region, analyze the seepage flow, and examines the behavior of the underground water.

2. GEOLOGICAL CONDITIONS IN KYOTO BASIN

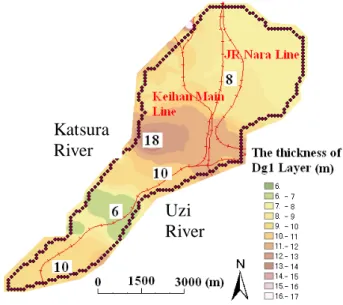
Kyoto basin is surrounded by mountains formed by a bowl shaped depression in the Paleozoic strata and granite, as is shown in Fig.1. The Paleozoic

strata basin rock is an impermeable bed upon which there is a permeable, dilluvial layer and then alluvial layer. Thus the region saves a lot of underground water.

Lake Biwa Katsura

River

Uji River Kizu

River Otoko

yama Tennou

zan

Fushimi Ward

Fig.1 Geological map on the Kyoto basin

(3)

3. GEOLOGICAL COMPOSITIONS OF FUSHIMI WARD

As for the geological composition in the region that will be analyzed, there is a diluvial layer that is the laminated ground of gravel, sand, and clay and the alluvial layer that is a similar laminated ground coats this to the place by about 5m. We understood geological composition in a region concerned by arranging the data of the topographical map and

“KANSAIKEN JIBAN JYOUHOU DATA BASE in 2008” which has a lot of geological data.

4. THE WATER LEVEL OF FUSHIMI

Fig2 shows the expansion of the area around Fushimi Brewery Union. The position of the observation wells in the present study is recorded.

Kyoto City sets up 13 observation wells in the part where the shield passes. Moreover, we borrow each brewing company's stop well, and set the water meter in 9 places. The water level data is obtained from the 22 observation wells in total. The position of 13 observation wells that Kyoto City sets up with triangular signs, and the position of 9 observation wells that the brewing company sets up with circle marks, Fig2. Kyoto City offered us datum of the well owned by the City. We compared the observed underground water head with the underground water head obtained by the analytical result, and examined the validity of the stratum we made.

Moreover, we made the water level contour chart from the result of these underground water heads, and forecasted roughly how the underground water flows. Fig3 shows the underground water flows toward the part where three rivers in the southwest are joined from the hill part in northeast.

5. STRATUM OF THE MODEL

(1)Stratum division

We studied the shallow aquifer of about 30m from the ground level where the shield passes. Fig4 shows the plan chart of the model in the region concerned. We divided it into three layers (the alluvium, the Dg1 layer, and the impermeable layer) based on the classification by geological features and the classifications according to N value.

Fig.4 The plan chart of the model in a region concerned.

Fig.3 Water head contour map

Fig.2 Location of monitoring wells Katsura

River

Uzi River

Water head T.P. (m)

Fig.4 Conceptual diagram of the model Katsura

River

Uzi

River

Kamogawa

River

(4)

The layer thickness of the alluvial layer is shown in Figure5 according to the contour data. The layer thickness is roughly shown by the figure at the point. The thickness of the alluvium disappears from the white line along the railway track between Keihan Main Line and the JR Nara Line in the Fushimi Ward northern part toward the Momoyama hill in the east. The alluvial layer is thick in the part where three rivers located in the southern part of Fushimi Ward are joined. It is about 15m in thickest part. Fig6 shows the layer thickness distribution in the Dg1 layer. The layer thickness is thick in the part where the shield passes. Moreover, the layer in the area with the Momoyama hill in the northern part of Fushimi Ward is raised, while going to the east part. Based on TP=-20m, we set an impermeable layer at the bottom of the model under the alluvium and the Dg1 layer. About 400 boring data was used to understand the geological features in the analyzed region.

(2)Range of analytical object

Fig7 shows the range of modeling that is the researched in the study. We decided that analysis range would be the area of about 9000m from the east to the west and about 9500m from the south to north, as the figure7 shows. The part enclosed by red shows the part where the shield chiefly passes.

The size of the mesh is a square of 100m×100m.

Fig8 shows the completed model chart. The number of nodes of analytical meshes is 44045, and the number of elements is 39291. A perpendicular direction is displayed at ten times magnification.

Fig.5 Alluvial layer thickness

Fig6. Diluvial layer of thickness

Fig7.The models range

Fig8.Completed model chart Katsura

River

Uzi River

Uzi River Katsura

River

Uzi River Katsura

River

(5)

6. SEEPAGE FLOW ANALYSIS

In three dimension seepage flow analysis in the present study, AC-UNSAF3D by the finite element method was used.

(1)Boundary condition

Fig9 shows the boundary condition. The boundary of the model is set referring to the topographical map of three rivers and divides. The water head was brought together from the data base of the Ministry of Land, Infrastructure and Transport managed.

Fig10 shows the location of river water monitoring.

Table 1 shows the comparison of the value in which the river head had been brought together as a head of water during a year and the underground water head of each observation point obtained from Arc- GIS. It is understood that the underground water head is higher than the stream water head from Table 1. Therefore, it is predictable that the underground water flows into the river. We set the water fixed boundaries set from the above- mentioned result of the survey to the river of the model. The fixed water head boundary is set such that it matches the boundary set to the river at its current located as well as the divide.

(2)Ground physicality parameter

We set a general value as the ground physicality parameters used in this analysis according to the reference literature etc. It is shown in Table2

Average yearly River-head

(TP.m)

Underground water head

(TP.m)

Yodo 4.9 10.33

Nouso 6.70 8.54

Hazukashi 7.68 8.27

Hukakusa 17.89 21.50

Table.1 Ground physicality parameter

Fig9. Boundary conditions

Fig10. Location of water monitoring

Table.2 Comparison between the underground water head and river head

(6)

(3)Result of seepage flow analysis

The vector of the velocity of the underground is shown in figure11 as a result of doing the analysis for steady state. This flow velocity vector shows the point of TP=0m. The flow velocity vector of the underground water of each element was shown and the overall flow was shown by a macro vector. Red vector degree flow velocity is fast, and blue vector degree flow velocity is slow. Flow velocity in northeastern is shown by a blue vector because the flow velocity of the impermeable layer is shown.

The part shown by a red vector shows the flow velocity of the Dg1 layer, the flows are faster than the impermeable layers. Roughly speaking, the underground water flows toward the part where three rivers joined from a northeastern hilly district.

The analytical results are shown in Fig12.13. The comparison of the water head contour charts obtained from the analysis model and contour chart obtained from the result of the survey of Figure2 tells us that we can reproduce roughly how the underground water flows. To examine the model, Fig14 show the water head data of the various points of the model is compared by using data of the head of water of shallow observation well obtained from the brewing company and that of the underground water head from shallow observation well Kyoto City built. Most results show the error margin of about 2m. Therefore, overall it is a good result. However it will be necessary to examine the boundary condition and the ground physical properties value in addition and to improve the model in the future.

Fig11. The underground water flow vector

Fig12. Hydrocephalic contour colors

Fig13. Hydrocephalic contour line

Fig14. Comparison between values measured

and the predictions of the analysis

(7)

7. SUMMARY

The final purpose of the present study is to consider the behavior of the polluter when the velocity of the underground water changes or the pollution arises along with the drainage construction in Fushimi district where brewing companies with good quality underground water concentrates. The finding in the present stage obtained in the present study is shown follows.

We figured out the stratum characteristic in the analyzed region from the boring data, and organized them. Three dimensional ground model was made from these. The underground water movement was analyzed from the made stratum model, and a rough flow of the underground water movement was reproduced.

8. VIEW IN THE FUTURE

Future tasks are to correct the input conditions of the ground physical properties value and the boundary condition, etc. to obtain closer result to the actual measurement value. If the model becomes more accurate on the whole, the next step is to analyze and consider the change of the underground stream movement caused by doing the shield street. Moreover, it is necessary to consider with the simulation analysis whether the polluter extends to a good quality aquifer in the deep part that the brewing companies chiefly uses when the metals caused in the construction of the sewage pipe begin to melt into underground water.

REFFERNECES

Kansai Ground Information Conference : Kansai Ground Information Database (in Japanese) CD- ROM, 2008.

2)Karlheinz Spitz and Joanna Moreno : The

modeling of Underground water Environment due

to Civil Engineers (in Japanese) Gihodo published

C. pp.328-334, 2003.

Fig2  shows  the  expansion  of  the area around  Fushimi Brewery Union.  The position of the  observation wells  in the present study is recorded
Fig8 shows the completed model chart. The number  of nodes of analytical meshes is 44045, and the  number of elements is 39291
Table 1 shows the comparison of the value in which  the river  head had been brought together as a head  of water during a year and the underground water  head of each observation point obtained from  Arc-GIS

参照

関連したドキュメント

It is suggested by our method that most of the quadratic algebras for all St¨ ackel equivalence classes of 3D second order quantum superintegrable systems on conformally flat

In particular, we consider a reverse Lee decomposition for the deformation gra- dient and we choose an appropriate state space in which one of the variables, characterizing the

[3] Chen Guowang and L¨ u Shengguan, Initial boundary value problem for three dimensional Ginzburg-Landau model equation in population problems, (Chi- nese) Acta Mathematicae

In this work, we present a new model of thermo-electro-viscoelasticity, we prove the existence and uniqueness of the solution of contact problem with Tresca’s friction law by

The main problem upon which most of the geometric topology is based is that of classifying and comparing the various supplementary structures that can be imposed on a

Splitting homotopies : Another View of the Lyubeznik Resolution There are systematic ways to find smaller resolutions of a given resolution which are actually subresolutions.. This is

Then it follows immediately from a suitable version of “Hensel’s Lemma” [cf., e.g., the argument of [4], Lemma 2.1] that S may be obtained, as the notation suggests, as the m A

In order to be able to apply the Cartan–K¨ ahler theorem to prove existence of solutions in the real-analytic category, one needs a stronger result than Proposition 2.3; one needs