INTRODUCTION
In recent years, methods that measure liver stiff- ness non-invasively with ultrasound, such as acoustic radiation force impulse imaging(ARFI)1), transient elastography(TE)2), and strain elastography(SE)3), have been reported to be useful in evaluating hepatic fibrosis. Shear wave elastography(SWE)is a new Original
Factors Related to Liver Stiffness in Patients with Hepatitis C During Direct-acting Antiviral
Agent Treatment
Ryosaku Shirahashi, Toshikuni Suda, Osamu Okawa, Naohiko Tokutomi, Masaya Tamano
Department of Gastroenterology, Dokkyo Medical University Saitama Medical Center, 2-1-50 Minami-Koshigaya, Koshigaya-shi, Saitama 343-8555, Japan
SUMMARY
Background and Aim:The purpose of this study was to observe the changes over time in liver stiff- ness measured by shear wave elastography(SWE)in hepatitis C patients during direct-acting antiviral agent(DAA)treatment and evaluate the factors affecting the liver stiffness.
Methods:The subjects were 206 consecutive patients diagnosed with hepatitis C in the Dokkyo Medical University Saitama Medical Center treated with DAAs. SWE was performed to measure the propagation velocity of shear waves(Vs)before starting treatment(baseline), at the end of treatment(EOT), and 12 weeks after EOT(follow-up 12). The change in Vs(ΔVs)was calculated for the difference between base- line and follow-up 12. Clinical parameters were obtained on the same day as SWE. Multiple regression analysis was used to identify factors related to ΔVs.
Results:Data from 149 patients were used;all 149 patients achieved sustained virological response.
Mean Vs decreased significantly, from 1.58±0.92 m/s at baseline to 1.46±0.27 m/s at EOT(P=0.00045).
Mean Vs at follow-up 12 was 1.42±0.28 m/s, significantly lower than at EOT(P=0.00002). The mean ΔVs was 0.147±0.164 m/s. On multiple regression analysis, prothrombin time%(PT%)and the change in alanine aminotransferase(ΔALT)from baseline were significantly related to ΔVs. Baseline ALT and the FIB4-index tended to affect ΔVs.
Conclusions:In hepatitis C patients, Vs measured by SWE improved with 12 weeks of DAA therapy and continued to improve to follow-up 12. Baseline PT% and ΔALT contributed significantly to the improvement of Vs during DAA treatment, and the FIB-4 index also had a great effect.
Key words: direct-acting antiviral agents, hepatitis C, liver stiffness, shear wave elastography, sustained virological response
Received June 3, 2019;accepted July 1, 2019 Reprint requests to:Masaya Tamano, Professor
Department of Gastroenterology, Dokkyo Medical University Saitama Medical Center, 2-1-50 Minami-Koshigaya, Koshigaya-shi, Saitama 343-8555, Japan
technology that gauges liver stiffness by measuring the propagation velocity of shear waves(Vs)generat- ed in liver tissue. Vs measurements with SWE are reported to be useful in diagnosing the fibrosis in hep- atitis C patients4).
It has been previously reported that, in hepatitis C patients, liver stiffness measured by SWE was higher in the naïve group than in the sustained virological response(SVR)group, presumably due to hepatitis activity5). Improvement of liver stiffness compared with the pre-treatment level was reported in hepatitis C patients who achieved SVR by treatment with direct-acting antiviral agents(DAAs)6), and this improvement of liver stiffness was shown to be more prominent in hepatitis C patients with advanced fibro- sis7,8).
The purpose of this study was to observe the changes over time in liver stiffness measured by SWE in hepatitis C patients during DAA treatment and evaluate the factors affecting liver stiffness.
METHODS Patients
The subjects were 206 consecutive patients diag- nosed with hepatitis C patients in the Dokkyo Medical University Saitama Medical Center who were treated with DAAs between July 2015 and February 2016.
Patients with decompensated liver cirrhosis, hepatocel- lular carcinoma, autoimmune disease, collagen disease, or chronic heart disease were excluded. Patients with a history of drinking ≥20 g alcohol per day and those diagnosed with obvious fatty liver on abdominal ultra- sound were also excluded.
This prospective study was approved by the Ethics Committee of the Dokkyo Medical University Saitama Medical Center, and written, informed consent was obtained from all participants. This study conformed to the ethical guidelines of the 2008 Declaration of Helsinki.
Measurement of the Velocity of the Shear Wave
Measurement of Vs by SWE was performed using a LOGIQ E9(GE Healthcare, Milwaukee, WI, USA).
The right lobe of the liver was visualized through an intercostal space while the patient was lying in a supine position with the right arm in maximum
abduction. Measurements were taken while subjects held their breath during spontaneous breathing. The visual depth of the system was fixed at 8 cm, and the region of interest(ROI)was 1-2 cm below the surface of the liver. The system was adjusted so that sample volume depth was 4 cm or less. The apparatus auto- matically calculated the Vs, and the results are expressed in m/s. The result was considered reliable only when 10 successful shots and a measurement success rate>80% were obtained.
The duration of DAAs treatment of all patients was 12 weeks. SWE was performed before starting treat- ment(baseline), at the end of treatment(EOT), and 12 weeks after EOT(follow-up 12). The change in Vs
(ΔVs)was calculated for the difference between base- line and follow-up 12.
Clinical parameters
Clinical parameters, which were obtained on the same day that SWE was performed, were compared.
Clinical parameters other than Vs were the follow- ing:aspartate aminotransferase(AST), alanine ami- notransferase(ALT), total bilirubin(T-Bil), albumin
(Alb), leukocytes(WBC), hemoglobin(Hb), platelets
(Plt), prothrombin time%(PT%), a-fetoprotein
(AFP), and Mac-2 binding protein glycosylation-iso- mer(M2BPGi). These parameters were measured on the same days as SWE. The FIB-4 index was estimat- ed using the values of serum AST, ALT, Plt, and age.
ΔALT, ΔAFP, and ΔM2BPGi were calculated with differences between baseline and follow-up 12, similar to ΔVs.
Each parameter at baseline, ΔALT, ΔAFP, and Δ M2BPGi were used as explanatory variables in multi- ple regression analysis.
Statistical analysis
Continuous data for liver stiffness and other clinical parameters are expressed as means±standard devia- tion(SD). A paired Wilcoxon test was used to test for differences in each parameter before and after the start of treatment. Friedman’s test was used to test multiple comparisons of each parameter. Multiple regression analysis was used to examine the factors that contributed to ΔVs. Values of P<0.05 were regarded as significant.
RESULTS
A total of 206 consecutive hepatitis C patients were recruited for the study. Twenty-nine of these patients, including six patients with a history of HCC, 20 patients diagnosed with fatty liver by ultrasound, and 9 patients with a history of drinking ≥20 g/day of alcohol, were excluded. Another 4 patients in whom liver stiffness could not be measured because of obesi- ty or hepatic atrophy and 8 patients with large mea- surement errors were also excluded from the evalua- tion. In addition, another 16 patients, including 5 patients who discontinued their hospital visits after DAA therapy and 9 patients without periodic SWE measurements, were withdrawn from the study.
There were no patients with autoimmune hepatitis or cardiac failure. Therefore, data from 149 patients were finally used for the analysis(Figure 1).
The DAAs used for treatment in 149 of these patients were sofosbuvir(SOF), ledipasvir(LDV)in 52 patients, ombitasvir/paritaprevir/ritonavir in 41
patients, and SOF/ribavirin in 56 patients. Table 1 shows the characteristics of the 149 patients(62 men, 8 7 women;mean age 6 6 . 6±1 1 . 8 years). Forty patients(26.9%)had previously received interferon
(IFN)therapy. Their mean ALT was 56.2±38.7(10- 252)IU/L, including a large number of hepatitis patients with relatively mild active disease. Other bio- chemical values, AFP, M2BPGi, and Vs, were consis- tent with chronic hepatitis or compensated liver cir- rhosis.
DAA therapy was continued for 12 weeks. All 149 patients achieved SVR at follow-up 12.
Figure 2 shows the changes in Vs. Mean Vs decreased significantly during the 12-week treatment period, from 1.58±0.92 m/s at baseline to 1.46±0.27 m/s at EOT(P=0.00045). Mean Vs at follow-up 12 was 1.42±0.28 m/s, a significant decrease from the Vs at EOT( P=0 . 0 0 0 0 2). The mean difference between baseline and follow-up 12 of Vs(ΔVs)was 0.147±0.164 m/s.
Figure 3 shows that Vs was significantly correlated with the FIB-4 index at baseline(r=0.5483, P=
0.0000). Figure 4 shows the comparison of ΔVs between the group of patients with the FIB-4 index<
3.25(n=93)and the group of patients with the FIB-4 index ≥3.25(n=56). Although ΔVs tended to be Figure 1 Flowchart of the study
A total of 206 consecutive hepatitis C patients were recruited. Twenty-nine of these patients, including six patients with a history of HCC, 20 patients diagnosed with fatty liver by ultrasound, and 9 patients with a history of drinking ≥ 20 g/day of alcohol, were excluded. Another 12 patients in whom liver stiffness could not be measured were also excluded from the evaluation. In addition, anoth- er 16 patients who were lost to follow-up were withdrawn from the study. Data from 149 patients were finally used for the analysis. MLS;measure liver stiffness.
Table 1 Patient characteristics(n=149)
Age(yr) 66.6±11.8
Sex(male/female) 62/87
Serotype(1/2) 92/57
IFN(Yes/No) 40/109
HCV RNA(LogIU/ml) 5.8±0.9
ALT(IU/L) 56.2±38.7
Total bilirubin(mg/dL) 0.83±0.29
Serum albmin(g/dL) 4.18±0.37
WBC(×103/mm3) 5.0±1.7
Hb(g/dL) 13.7±1.4
Platelet(×104/mm3) 16.1±5.5
Prothrombin time(%) 98.3±16.2
AFP(ng/mL) 9.7±19.7
Fib4 index 3.6±2.7
M2BPGi(C.O.I.) 3.0±3.3
Vs(m/s) 1.57±0.25
AFP:a-fetoprotein, ALT:alanine aminotransferase, Hb:hemoglobin, HCV:hepatitis C virus, IFN:interferon, M2BPGi:Mac-2 binding protein glycosylation isomer, Vs:velocity of shear wave, WBC:white blood cell.
Figure 2 Changes in Vs from baseline to follow-up 12 Mean Vs decreases significantly during the 12-week treatment period, from 1.58±0.92 m/s at baseline to 1.46±0.27 m/s at EOT(P=0.00045). Mean Vs at follow-up 12 is 1.42±0.28 m/s, a significant decrease from the Vs at EOT(P=0.00002).
Figure 4 Comparison of ΔVs between the group with the FIB-4 index
<3.25 and the group with the FIB-4 index ≥3.25
Comparison of ΔVs between the group of patients with FIB-4 index < 3.25(n=93)and the group of patients with FIB-4 index ≥3.25(n=56)
shows that ΔVs tends to be greater in the group with a FIB-4 index
≥3.25, but there is no significant difference(P=0.05825).
Figure 3 Relationship between Vs and the FIB-4 index at baseline
Vs correlates significantly with the FIB-4 index at baseline(r=0.5483, P=0.0000).
greater in the group with a FIB-4 index ≥3.25, which indicates advanced fibrosis, no significant difference was observed(P=0.05825).
Table 2 shows the changes in each parameter from baseline to follow-up 12. The ALT, AFP, and M2BPGi levels decreased significantly at follow-up 12 from baseline. There were changes in the reference values, but total bilirubin, serum albumin, WBC and Plt levels increased significantly at follow-up 12 from baseline.
Similarly, there was a change in the reference value,
but prothrombin activity decreased significantly at fol- low-up 12 from baseline.
From these results, we added ΔALT, ΔAFP, and Δ M2BPGi as explanatory variables in the multiple regression analysis.
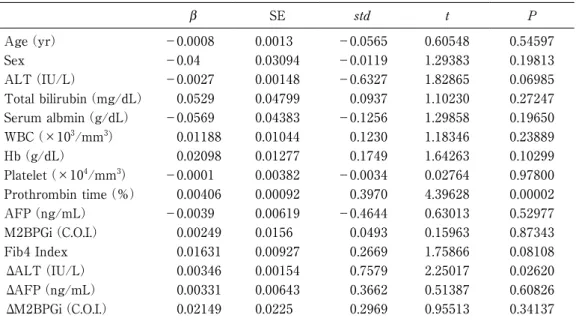
Table 3 shows the results of the multiple regression analysis for factors related to ΔVs. PT% and ΔALT from baseline were significantly related to ΔVs. The ALT at baseline and the FIB4-index at baseline tend- ed to affect ΔVs, but there were no significant rela- Table 2 Changes of each parameters in baseline and follow-up 12
Baseline Follow-up 12 p value
ALT(IU/L) 56.2±38.7 17.8±10.2 0.0000
GGT(IU/L) 43.8±34.7 22.8±14.5 0.0000
Total bilirubin(mg/dL) 0.83±0.29 0.93±0.35 0.0000 Serum albmin(g/dL) 4.18±0.37 4.35±0.30 0.0000
WBC(×103/mm3) 5.0±1.7 5.3±1.6 0.0044
Hb(g/dL) 13.7±1.4 13.6±1.8 0.3065
Platelet(×104/mm3) 16.1±5.5 17.8±6.0 0.0000 Prothrombin time(%) 98.3±16.2 94.6±16.4 0.0004
AFP(ng/mL) 9.7±19.7 3.6±2.7 0.0000
M2BPGi(C.O.I.) 3.0±3.3 2.5±1.5 0.0000
Vs(m/s) 1.57±0.25 1.42±0.22 0.0000
AFP:a-fetoprotein, ALT:alanine aminotransferase, Hb:hemoglobin, HCV:hepatitis C virus, IFN:interferon, M2BPGi:Mac-2 binding protein glycosylation isomer, Vs:velocity of shear wave, WBC:white blood cell.
Table 3 Multiple regression analysis with ΔVs as the dependent variable
b SE std t P
Age(yr) −0.0008 0.0013 −0.0565 0.60548 0.54597
Sex −0.04 0.03094 −0.0119 1.29383 0.19813
ALT(IU/L) −0.0027 0.00148 −0.6327 1.82865 0.06985
Total bilirubin(mg/dL) 0.0529 0.04799 0.0937 1.10230 0.27247 Serum albmin(g/dL) −0.0569 0.04383 −0.1256 1.29858 0.19650 WBC(×103/mm3) 0.01188 0.01044 0.1230 1.18346 0.23889
Hb(g/dL) 0.02098 0.01277 0.1749 1.64263 0.10299
Platelet(×104/mm3) −0.0001 0.00382 −0.0034 0.02764 0.97800 Prothrombin time(%) 0.00406 0.00092 0.3970 4.39628 0.00002
AFP(ng/mL) −0.0039 0.00619 −0.4644 0.63013 0.52977
M2BPGi(C.O.I.) 0.00249 0.0156 0.0493 0.15963 0.87343
Fib4 Index 0.01631 0.00927 0.2669 1.75866 0.08108
ΔALT(IU/L) 0.00346 0.00154 0.7579 2.25017 0.02620
ΔAFP(ng/mL) 0.00331 0.00643 0.3662 0.51387 0.60826
ΔM2BPGi(C.O.I.) 0.02149 0.0225 0.2969 0.95513 0.34137
AFP:a-fetoprotein, ALT:alanine aminotransferase, Hb:hemoglobin, HCV:hepatitis C virus, IFN:interferon, M2BPGi:Mac-2 binding protein glycosylation isomer, Vs:velocity of shear wave, WBC:white blood cell.
tions(P=0.07056, P=0.08108).
DISCUSSION
Significant advances have been made in the treat- ment of hepatitis C with the advent of DAAs. DAA therapy has milder side effects compared to IFN ther- apy, and there is a high rate of SVR at 12 weeks9〜13). In the present study, SVR was achieved in all 149 patients by 12-week DAA treatment.
It has been previously reported that Vs as mea- sured by SWE is about 1.2 m/s in healthy livers5). In the present study, the mean Vs at baseline was 1.58
±0.92 m/s, but it decreased significantly to 1.46±
0.27 m/s during a short 12-week period of DAA ther- apy. Vs at follow-up 12 further decreased significantly to 1.42±0.28 m/s. Liver stiffness shown as Vs is influ- enced not only by the degree of liver stiffness, but also by necroinflammatory activity14,15). Elevated ALT levels in the present study, corresponding to the pres- ence of necroinflammatory activity, decreased signifi- cantly from baseline to EOT. Therefore, the reduction of ALT levels from baseline to EOT appeared strong- ly associated with the reduction of liver stiffness as shown by SWE.
Marcellin et al. who performed multiple liver biop- sies in patients with SVR after IFN therapy, reported histologic improvement in inflammation after treat- ment was completed, but they found no clear evi- dence of fibrosis improvement even after follow-up for 3 years or longer16). Therefore, improvement of hepatic fibrosis in the present patients after a short 12-week treatment period was not to be expected.
The improvement in Vs should be considered to reflect remission of inflammation, rather than improve- ment in fibrosis.
Previous studies showed that the FIB-4 index can be used to classify liver disease and monitor HCV- infected patients in longitudinal studies17,18).
Ogasawara et al. showed a positive correlation between baseline liver stiffness and the FIB-4 index, and more prominent improvement of liver stiffness by DAAs in patients with hepatic cirrhosis with a FIB-4 index ≥3.25 than in patients with chronic hepatitis with a FIB-4 index <3.257). In the present study, the positive correlation between baseline liver stiffness and the FIB-4 index was confirmed. Although ΔVs
tended to be greater in the group of patients with a baseline FIB-4 index ≥3.25 than in the group of patients with a baseline FIB-4 index <3.25, no signifi- cant difference was observed(P=0.05825).
M2BPGi is a new liver fibrosis marker that quanti- tatively measures changes in the carbohydrate struc- ture of Mac-2 binding protein19), and it is also consid- ered useful in predicting carcinogenesis in hepatitis C patients20〜22). In the present study, M2BPGi, which at baseline was 2.93±2.62 C.O.I., or about 3-times the upper normal limit, decreased significantly at EOT to 1.58±1.30 C.O.I. Therefore, it is assumed that elevat- ed M2BPGi, like Vs, is not only due to hepatic fibrosis, but also due to effects caused by inflammation23).
As factors contributing to the improvement of Vs, PT% and ΔALT were identified as significant in the present study. Pre-treatment ALT and the FIB-4 index were confirmed to greatly affect the improve- ment of Vs. Thus, the present study showed that DAAs improve liver stiffness in patients with advanced fibrosis whose liver was severely inflamed before treatment and whose protein-synthesizing capability is sufficiently maintained.
LIMITATIONS
This study was conducted at a single institution, and although this was a prospective study in which 206 patients were enrolled, data from a smaller num- ber, only 149 patients, could be used for evaluation.
Since no patients underwent liver biopsy in this study, the histopathological findings and Vs could not be compared.
CONCLUSIONS
Vs measured by SWE in hepatitis C patients improved with 12 weeks of DAA therapy. This improvement continued until follow-up 12(12 weeks after EOT). The significant factors that contribute to the improvement of Vs during DAA treatment are baseline PT% and ΔALT. The FIB-4 index also has a great effect on the improvement.
REFERENCES
1) Kuroda H, Kakisaka K, Tatemichi Y, et al:Non-inva- sive evaluation of liver fibrosis using acoustic radia- tion force impulse imaging in chronic hepatitis
patients with hepatitis C virus infection. Hepatogas- troenterology 57:1203-1207, 2010.
2) Tamano M, Kojima K, Akima T, et al:The useful- ness of measuring liver stiffness by transient elastog- raphy for assessing hepatic fibrosis in patients with various chronic liver diseases. Hepatogastroenterolo- gy 59:826-830, 2012.
3) Tamaki N, Kurosaki M, Matsuda S, et al:Prospec- tive comparison of real-time tissue elastography and serum fibrosis markers for the estimation of liver fibrosis in chronic hepatitis C patients. Hepatol Res 44:720-727, 2014.
4) Tada T, Kumada T, Toyoda H, et al:Utility of real- time shear wave elastography for assessing liver fibrosis in patients with chronic hepatitis C infection without cirrhosis:Comparison of liver fibrosis indi- ces. Hepatol Res 45:E122-E129, 2015.
5) Suda T, Okawa O, Masaoka R, et al:Shear wave elastography in hepatitis C patients before and after antiviral therapy. World J Hepatol 9:64-68, 2017.
6) Pons M, Santos B, Simon-Talero M, et al:Rapid liver and spleen stiffness improvement in compensat- ed advanced chronic liver disease patients treated with oral antivirals. Therap Adv Gastroenterol 10:
619-629, 2017.
7) Ogasawara N, Kobayashi M, Akuta N, et al:Serial changes in liver stiffness and controlled attenuation parameter following direct-acting antiviral therapy against hepatitis C virus genotype 1b. J Med Virol 90:313-319, 2018.
8) Tada T, Kumada T, Toyoda H, et al:Improvement of liver stiffness in patients with hepatitis C virus infection who received direct-acting antiviral therapy and achieved sustained virological response. J Gastro- enterol Hepatol 32:1982-1988, 2017.
9) Ramos H, Linares P, Badia E, et al:Interferon-free treatments in patients with hepatitis C genotype 1-4 infections in a real-world setting. World J Gastroin- test Pharmacol Ther 8:137-146, 2017.
10) Kanda T, Yasui S, Nakamura M, et al:Real-World Experiences with the Combination Treatment of Ledipasvir plus Sofosbuvir for 12 Weeks in HCV Genotype 1-Infected Japanese Patients:Achieve- ment of a Sustained Virological Response in Previous Users of Peginterferon plus Ribavirin with HCV NS3/4A Inhibitors. Int J Mol Sci 18:906, 2017
11) Flisiak R, Łucejko M, Mazur W, et al:Effectiveness and safety of ledipasvir/sofosbuvir+/-ribavirin in the treatment of HCV infection:The real-world HARVEST study. Adv Med Sci 62:387-392, 2017.
12) Virabhak S, Yasui K, Yamazaki K, et al:Cost-effec- tiveness of direct-acting antiviral regimen ombitas- vir/paritaprevir/ritonavir in treatment-naive and treatment-experienced patients infected with chronic hepatitis C virus genotype 1b in Japan. J Med Econ 19:1144-1156, 2016.
13) Kumada H, Chayama K, Rodrigues L, et al:Random- ized phase 3 trial of ombitasvir/paritaprevir/ritonavir for hepatitis C virus genotype 1b-infected Japanese patients with or without cirrhosis. Hepatology 62:
1037-1046, 2015.
14) Arena U, Vizzutti F, Corti G, et al:Acute viral hepa- titis increases liver stiffness values measured by tran- sient elastography. Hepatology 47:380-384, 2008.
15) Coco B, Oliveri F, Maina AM, et al:Transient elas- tography:a new surrogate marker of liver fibrosis influenced by major changes of transaminases. J Viral Hepat 14:360-369, 2007.
16) Marcellin P, Boyer N, Gervais A, et al:Long-term histologic improvement and loss of detectable intra- hepatic HCV RNA in patients with chronic hepatitis C and sustained response to interferon-alpha thera- py. Ann Intern Med 127:875-881, 1997.
17) Vallet-Pichard A, Mallet V, Nalpas B, et al:FIB-4:
an inexpensive and accurate marker of fibrosis in HCV infection. comparison with liver biopsy and fibrotest. Hepatology 46:32-36, 2007.
18) Sterling RK, Lissen E, Clumeck N, et al:Develop- ment of a simple noninvasive index to predict signifi- cant fibrosis in patients with HIV/HCV coinfection.
Hepatology 43:1317-1325, 2006.
19) Kuno A, Ikehara Y, Tanaka Y, et al:A serum
“sweet-doughnut” protein facilitates fibrosis evalua- tion and therapy assessment in patients with viral hepatitis. Sci Rep 3:1065, 2013.
20) Ito K, Murotani K, Nakade Y, et al:Serum Wisteria floribunda agglutinin-positive Mac-2-binding protein levels and liver fibrosis:A meta-analysis. J Gastro- enterol Hepatol 32:1922-1930, 2017.
21) Sasaki R, Yamasaki K, Abiru S, et al:Serum Wiste- ria Floribunda Agglutinin-Positive Mac-2 Binding Protein Values Predict the Development of Hepato-
cellular Carcinoma among Patients with Chronic Hep- atitis C after Sustained Virological Response. PLoS One 10:e0129053, 2015.
22) Yamasaki K, Tateyama M, Abiru S, et al:Elevated serum levels of Wisteria floribunda agglutinin-posi- tive human Mac-2 binding protein predict the devel-
opment of hepatocellular carcinoma in hepatitis C patients. Hepatology 60:1563-1570, 2014.
23) Morio K, Imamura M, Daijo K, et al:Wisteria flori- bunda agglutinin positive Mac-2-binding protein level increases in patients with acute liver injury. J Gastroenterol 52:1252-1257, 2017.