Introduction
Hip dysplasia causes hip osteoarthritis1)and accounts for more than 70%of hip osteoarthritis cases in Japan2). The small area of acetabular coverage and joint instabil- ity increase mechanical stress on cartilage, which causes cartilage degeneration and wear and results in osteoarthritis3). Harris reported that the symptoms of cartilage degeneration with hip dysplasia occur early in life and that almost 50%of patients with hip dysplasia
in the series had their first reconstructive procedure be- fore 60 years of age4).
The diagnosis and severity of hip dysplasia have tradi- tionally been based on radiographic evaluation. One of the most commonly used measurements is the lateral centeredge angle (LCEA)5)6). This measurement indi- cates the morphological characteristics of hip dysplasia but does not indicate the condition of the articular car- tilage. Jointpreserving surgical techniques, such as pelvic osteotomies, are useful for correcting the mechan- ics and slowing the progression of osteoarthritis in pa-
Radial T2 Mapping Magnetic Resonance Imaging Evaluation of Acetabular Cartilage for Hip Dysplasia
Yuki KAMACHI, Koichi KINOSHITA, Tetsuya SAKAMOTO, Taiki MATSUNAGA, Takuaki YAMAMOTO
Department of Orthopaedic Surgery, Faculty of Medicine, Fukuoka University
Abstract
Background:T2 mapping is a qualitative magnetic resonance imaging technique used to evaluate carti- lage degeneration before cartilage morphology changes occur. Hip dysplasia causes osteoarthritis of the hip. Cartilage lesions are primarily found at the peripheral acetabulum because of the narrow coverage of the acetabulum. We used radial T2 mapping to identify the area of peripheral acetabular cartilage de- generation in symptomatic dysplastic hips and analyzed the correlation between the severity of hip dyspla- sia and the degree of cartilage degeneration.
Methods:This study was a retrospective review of 48 hips in 45 patients with symptomatic hip dysplasia who had undergone radial T2 mapping from 2014 to 2016. The T2 values of the peripheral acetabulum were measured in seven radial planes acquired using a 3.0T magnetic resonance scanner. The severity of hip dysplasia was assessed using the lateral centeredge angle (LCEA) measured on radiographs.
The T2 values of each radial plane were compared, and the correlation coefficients between the LCEA and T2 values were calculated for each radial plane.
Results:The T2 values of the peripheral acetabulum were significantly greater in the superoanterior to posterosuperior radial planes than in the anterior and posterior radial planes (P<0.01). The LCEA corre- lated moderately with the global T2 value (r=-0.425, P=0.003), the T2 value in the superoanterior ra- dial plane (r=-0.419, P=0.003), and the T2 value in the superior radial plane (r=-0.438, P=0.002). Conclusion:The T2 values increased in the superoanterior to posterosuperior radial planes in the periph- eral acetabulum of symptomatic dysplastic hips. The severity of hip dysplasia correlated with the degree of cartilage degeneration, especially in the superoanterior and superior radial planes.
Key words : Hip dysplasia, Radial magnetic resonance imaging, T2 mapping, Cartilage degeneration
Correspondence to:Koichi KINOSHITA, Department of Orthopaedic Surgery, Faculty of Medicine, Fukuoka University, 7451 Nanakuma, Jonanku, Fukuoka 8140180, Japan
Tel:+81928011011 Fax:+81928649055 Email:kinopfukuoka@yahoo.co.jp
tients with hip dysplasia7)8). In these procedures, the level of preoperative articular cartilage degeneration af- fects the postoperative results9). Therefore, the early detection of articular cartilage degeneration is important for patients with hip dysplasia.
Magnetic resonance imaging (MRI)is a useful and noninvasive method of evaluating the articular carti- lage. Although conventional MRI is useful for detect- ing the morphological changes in articular cartilage, the diagnostic ability of conventional MRI to detect carti- lage degeneration without morphological changes is limited. T2 mapping is a qualitative MRI technique that evaluates changes in the cartilage matrix, such as hydration and collagen fiber orientation, which occur before morphological cartilage changes10)11). Previous studies have reported that cartilage T2 values are higher in patients with osteoarthritis than in those without os- teoarthritis and correlate with the severity of osteoarthri- tis12)13).
Several studies have used T2 mapping to qualitatively evaluate cartilage in dysplastic hips14)15). However, these studies only evaluated single coronal or sagittal images.
Conventional imaging planes are particularly suscepti- ble to partial volume averaging effects because the cross section is oblique to the spherical hip joint, which re- sults in the poor depiction of the cartilage16). In con- trast, radial MRI provides a crosssection of the articu- lar cartilage and enables the evaluation of the general and subdivided articular cartilage regions. However, no study has conducted a qualitative evaluation of ace- tabular cartilage and the relationship between the sever- ity of hip dysplasia and the degree of cartilage degenera- tion detected by radial T2 mapping.
The present study clarified the area of peripheral acetabular cartilage degeneration in symptomatic dys- plastic hips and the correlation between the severity of hip dysplasia and the degree of cartilage degenera- tion detected by radial T2 mapping.
Subjects and Methods
This study was approved by our institutional review board(approval number:2017M077).
1. Patients
Data from 74 hips in 67 consecutive patients with symptomatic hip dysplasia, who had undergone radial T2 mapping from March 2014 to September 2016 were
reviewed retrospectively. Of these 74 hips, we ex- cluded 12 hips with a Tönnis grade17)of 2 on antero- posterior radiographs and 14 hips that could not be evaluated because of an inappropriate imaging method or artifacts. The final study cohort included 48 hips in 45 patients.
2. Clinical and radiographic evaluations
Demographic data included the patient age, sex, and body mass index. Clinical evaluations were performed using the Harris hip score18). Radiographic evaluations included the Tönnis grade and LCEA on anteroposterior radiographs. The Tönnis grade is used to classify the severity of osteoarthritis as grade 0 (no signs of osteoar- thritis), grade 1 (slight narrowing of the joint space, slight lipping at the joint margin, and slight sclerosis of the femoral head or acetabulum), grade 2 (small cysts in the femoral head or acetabulum, moderate narrowing of the joint space, and moderate loss of the sphericity of the femoral head), and grade 3 (large cysts, severe nar- rowing or obliteration of the joint space, severe deform- ity of the femoral head, and avascular necrosis). The LCEA was used to represent the severity of hip dys- plasia. The LCEA is formed by a line vertical to the horizontal pelvic axis and a line connecting the center of the femoral head with the lateral edge of the acetabu- lum (Fig. 1). An LCEA of 25° is normal, and that of <20° is hip dysplasia. An LCEA of 2024° is con- sidered to indicate borderline dysplasia6).
Fig. 1:The lateral centeredge angle(LCEA)representing the severity of hip dysplasia. The LCEA is formed by a line vertical to the horizontal pelvic axis and a line con- necting the center of the femoral head with the lateral edge of the acetabulum.
3. MRI protocol
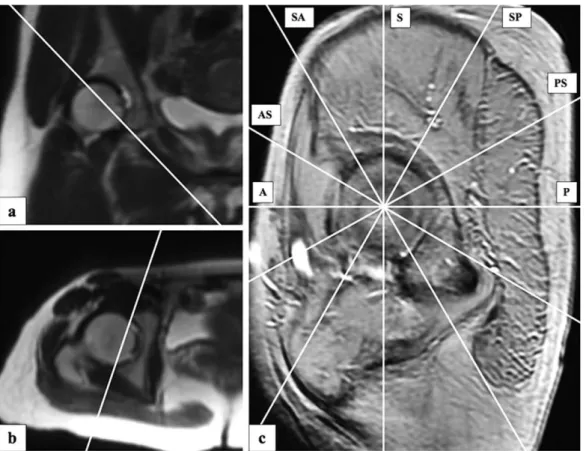
All MRI scans were performed using a 3.0T Discov- ery MR750w (GE Healthcare, Chicago, IL, USA) with a phased array coil. During MRI, all patients were placed in the supine position with the hip fixed in a neu- tral position to minimize movement artifacts. We ob- tained threeplane localizer images and established a reference parasagittal slice tangential to the acetabular rim in the coronal and axial slices. Seven radial planes were constructed at 30° intervals around the center of the femoral head the basis of the superior plane parallel to the magnetic resonance scanner table (Fig. 2). T2 mappings were obtained from twodimensional multi- ple spinecho images with the following scanning pa- rameters using eight echoes:TR, 800 ms;TE, 7.5/ 15.0/22.5/30.0/37.5/45.0/52.5/60.0 ms;FOV, 180× 180 mm;matrix, 288×256;thickness, 5 mm;scan ti- me, 6.51 min. T2 mapping preset images were con- structed using the ReadyView software program(GE Healthcare).
4. Region of interest(ROI)setting and T2 value measurement
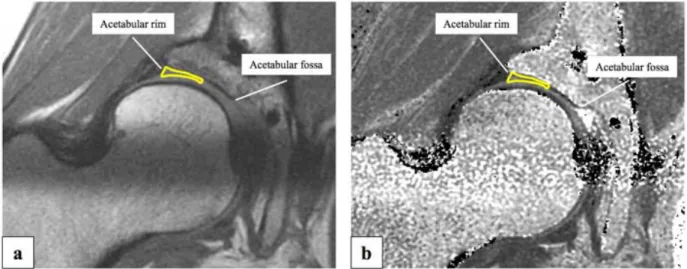
All magnetic resonance images were transferred to Rapideye(Canon Medical Systems, Tochigi, Japan)for ROI setting and T2 value measurement. The seven ra- dial plane images obtained by radial T2 mapping were defined as anterior, anterosuperior, superoanterior, supe- rior, superoposterior, posterosuperior, and posterior im- ages(Fig. 2). Acetabular cartilage was defined as the region between the acetabular rim and acetabular fossa.
The acetabular cartilage was divided by bisectors, and the peripheral zone was set as the ROI(Fig. 3). The ROIs were set manually on each radial plane image.
We took care not to include the joint fluid with a high T2 value and the subchondral plate with a low T2 value on the second echo image. The T2 value of the ace- tabular cartilage was measured on the preset image with reference to the second echo image. The T2 values of all ROIs were measured by one orthopedic surgeon three times on different days. The average of the three
Fig. 2:Procedure for the construction of radial planes. First, the plane across the acetabular opening was selected in coronal (a)and axial (b) slices. Subsequently, the reference parasagittal plane image tangential to the acetabular rim was constructed (c). Seven radial planes were constructed at 30° in- tervals around the center of the femoral head. The superior radial plane was parallel to the magnetic resonance scanner table. A=anterior, AS=anterosuperior, SA=superoanterior, S=superior, SP=
superoposterior, PS=posterosuperior, P=posterior.
measurements was used as the T2 value. The global T2 value was calculated as the average of the T2 values in each radial plane image.
5. Statistical analyses
Tukey’s honestly significant difference test was used to compare the T2 values of ROIs in each radial plane image. Pearson’s correlation coefficient was used to calculate the correlation between the LCEA and T2 values. The intraobserver reliability of the T2 value measurement was evaluated by an intraclass correlation analysis. A statistical analysis was performed using the SPSS software program, version 25(IBM Inc., Ar- monk, NY, USA). Statistical significance was defined as P<0.05.
Results
Demographic data and radiographic and clinical evalu- ations for the 48 hips in 45 patients are shown in Table 1.
The cohort included 3 hips in male patients and 45 hips in female patients. The mean patient age was 33.9± 12.7 years old(range, 1360 years old), the mean body mass index was 22.7±3.9 kg/m2(range, 17.736.8 kg/ m2), the mean Harris hip score was 75.8±9.3 points
(range, 5793 points), and the mean LCEA was 14.0± 5.8° (range, -2.9 to 23.2°). The Tönnis grade was 0 in 23 hips and 1 in 25 hips.
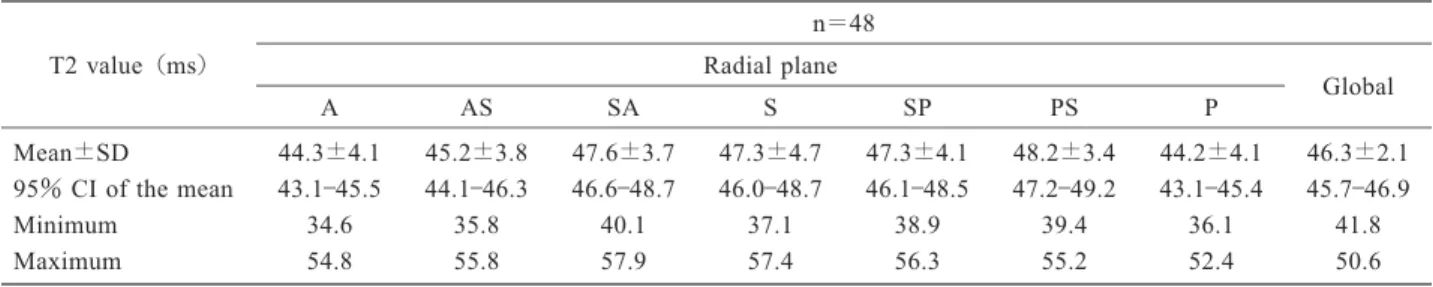
The T2 value in each radial plane image and global T2 value are shown in Table 2. The T2 values in the su-
peroanterior, superior, superoposterior, and posterosupe- rior radial planes were significantly greater than those in the anterior radial plane(P=0.001, P=0.005, P= 0.006, and P<0.001, respectively)and posterior radial plane(P=0.001, P=0.004, P=0.005, and P<0.001, respectively). The T2 value in the posterosuperior ra- dial plane was significantly greater than that in the an- terosuperior radial plane (P=0.005)(Fig. 4).
The correlation coefficients between the LCEA and T2 values are shown in Table 3 and Fig. 5. There was moderate correlation between the LCEA and global T2 value (r=-0.425, P=0.003). Moderate correlation was also detected between the LCEA and T2 values in the superoanterior radial plane (r=-0.419, P=0.003)and superior radial plane (r=-0.438, P=0.002)(Fig. 6).
There was a high level of intraobserver reliability for the T2 value of each radial plane image(intraclass cor- relation range, 0.7480.956).
Fig. 3:T2 mapping image on the second echo(a)and T2 mapping preset image(b). The acetabular cartilage was defined as the region between the acetabular rim and acetabular fossa. The acetabular cartilage was bisected and the peripheral zone was set as the region of interest. The T2 value was measured on the preset image with reference to the second echo image.
Table 1 Demographic data and radiographic and clinical evaluations of the study cohort
n=48 3:45 Sex, male:female(no. of hips)
33.9±12.7(1360) Age*(years old)
22.7±3.9(17.736.8) Body mass index*(kg/m2)
14.0±5.8(-2.9 to 23.2) Lateral centeredge angle*(°)
23, 25 Tönnis grade 0, 1(no. of hips)
75.8±9.3(5793) Harris hip score*(points)
* Data are presented as mean±standard deviation(range).
Discussion
T2 mapping is a qualitative MRI technique for evalu- ating cartilage matrix changes, such as hydration and collagen fiber orientation, that result in increased T2 values in patients with cartilage degeneration19). First, we investigated the area of peripheral acetabular carti- lage degeneration in hip dysplasia by comparing the T2 value in each radial plane image. Ross et al.20)reported that cartilage lesions in hip dysplasia primarily occur at the anterior and superolateral peripheral acetabulum.
Therefore, we only evaluated the peripheral acetabular area. Second, we evaluated the association between the severity of hip dysplasia and the degree of cartilage degeneration using the correlation coefficient between the LCEA and T2 value in each radial plane image.
Our results showed that the T2 values in the superoan- terior to posterosuperior radial planes were greater than the global T2 values. Although no studies have investi- Table 2 T2 values in each radial plane image and the global T2 values
n=48 T2 value(ms)
Global Radial plane
P PS
SP S
SA AS
A
46.3±2.1 44.2±4.1
48.2±3.4 47.3±4.1
47.3±4.7 47.6±3.7
45.2±3.8 44.3±4.1
Mean±SD
45.746.9 43.145.4
47.249.2 46.148.5
46.048.7 46.648.7
44.146.3 43.145.5
95%CI of the mean
41.8 36.1
39.4 38.9
37.1 40.1
35.8 34.6
Minimum
50.6 52.4
55.2 56.3
57.4 57.9
55.8 54.8
Maximum
SDstandard deviation, CI confidence interval, Aanterior, ASanterosuperior, SA superoanterior, S superior, SPsuperoposterior, PSposterosuperior, Pposterior
Fig. 4:Distribution of the mean T2 values in each radial plane.
The horizontal line indicates the global T2 value. Aster- isks indicate significant differences between radial planes
(P<0.05). A=anterior, AS=anterosuperior, SA=su- peroanterior, S=superior, SP=superoposterior, PS=pos- terosuperior, P=posterior.
Table 3 Correlation coefficients between the LCEA and the T2 value
Pvalue Correlation coefficient, r
0.339
-0.141 A
0.611
-0.075 AS
0.003*
-0.419 SA
0.002*
-0.438 S
0.112
-0.232 SP
0.566
-0.085 PS
0.273
-0.161 P
0.003*
-0.425 Global
LCEAlateral centeredge angle, Aanterior, ASanterosuperior, SA superoanterior, S superior, SP superoposterior, PSpostero- superior, Pposterior
*P<0.05
Fig. 5:Correlation coefficients between the lateral center edge angle and T2 value in each radial plane. Cross- hatched areas indicate significant correlations. A=
anterior, AS=anterosuperior, SA=superoanterior, S=
superior, SP=superoposterior, PS=posterosuperior, P
=posterior.
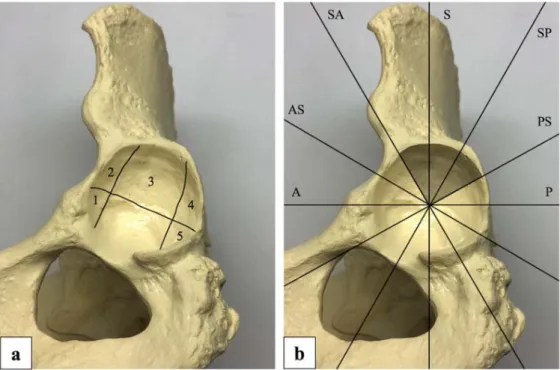
gated the area of the acetabular cartilage degeneration using T2 mapping, several studies have reported the ar- throscopic evaluation of articular cartilage for hip dys- plasia. Fujii et al.21)reported that 61.1% of patients with hip dysplasia had acetabular cartilage lesions in the anterosuperior region. Ross et al.20)reported that 67.1%of patients with hip dysplasia had acetabular car- tilage lesions in the anterior and/or superolateral re- gions of the peripheral acetabulum. The area of car- tilage lesions in these arthroscopic studies corresponded to the superoanterior to superoposterior radial planes in our study. We predicted that the T2 values would in- crease from the superoanterior to superoposterior radial planes, which correspond to the areas that typically con- tain cartilage lesions. However, we found that the T2 value was also increased in the posterosuperior radial plane. Ho et al.22)reported the geographical distribu- tion of T2 values for asymptomatic hips without hip dysplasia. The present study used the geographical zone method of Ilizaliturri et al.23), which is commonly used in hip arthroscopy. Zone 2 corresponds to the an- terosuperior and superoanterior radial planes, zone 3 corresponds to the superior and superoposterior radial planes, and zone 4 corresponds to the posterosuperior and posterior radial planes assessed in our study (Fig. 7).
The T2 values were increased in zone 4 (posterosupe- rior and posterior radial planes)compared with zone 2
(anterosuperior and superoanterior radial planes)and zone 3 (superior and superoanterior radial planes). The reason for the high T2 value in the posterosuperior ra- dial plane in the present study may have been that this area already had a high T2 value22).
In the present study, there was a moderate correlation between the LCEA and T2 values in the superoanterior and superior radial planes (r=-0.419 and -0.438, re- spectively). These results suggest that more severe hip dysplasia, as indicated by a smaller LCEA, results in worse cartilage degeneration in the superoanterior and superior radial planes. Chung et al.24)reported that an LCEA of <20° is a risk factor for osteoarthritis, and a small LCEA worsens the prognosis of acetabular dysplasia. Chegini et al.25)used a finite element analy- sis to show that a small LCEA increases the contact pressure on the zone with little cartilage coverage in hip dysplasia during walking. The results of these studies support the correlation between the LCEA and T2 val- ues detected in the present study. Conventional image planes are susceptible to the partial volume averaging ef- fect, thus requiring articular cartilage to be evaluated only using midcoronal images16). In the present study
Fig. 6:A 52yearold female patient with right hip pain. Anteroposterior radiograph of the right hip (a). The lateral centeredge angle was 11°. Radial T2 mapping in the superoanterior radial plane (b)
and superior radial plane (c). Yellow frames indicate the regions of interest. A high T2 value was calculated(50.1 and 49.9 ms).
using radial planes, the partial volume averaging effect was suppressed in radial planes other than superior ra- dial plane, so we were able to indicate the correlation between the LCEA and T2 values in the superoanterior radial plane as well as the superior radial plane.
Our study had several limitations. First, the ROI set- ting and T2 value measurement were performed manu- ally. We took care not to include the joint fluid with a high T2 value and the subchondral plate with a low T2 value, which may have affected the T2 value in each ra- dial plane. Second, the T2 values of symptomatic dys- plastic hips were not compared with those of asymp- tomatic dysplastic hips. Conducting a comparison with the T2 values of asymptomatic dysplastic hips may pro- vide accurate information on the area of acetabular carti- lage degeneration.
In the present study, the T2 values were increased in the superoanterior to posterosuperior areas of the periph- eral acetabulum in symptomatic dysplastic hips. The severity of hip dysplasia was shown to be correlated with the degree of cartilage degeneration, especially in the superoanterior and superior radial planes. Our re- sults suggest that patients with hip dysplasia with smaller the LCEA on radiographs may have a more ad- vanced degree of cartilage degeneration, which may sup-
port the recommendation of jointpreserving surgery for hip dysplasia.
Acknowledgments
We thank Kelly Zammit, BVSc, and Mitchell Arico from Edanz Group (https:/ /enauthorservices.edanzgroup.com /ac), for editing a draft of this manuscript.
Conflicts of interest The authors declare no conflicts of interest.
References
1)Aronson J:Osteoarthritis of the young adult hip: etiology and treatment. Instr Course Lect 35:119 128, 1986.
2)Nakamura S, Ninomiya S, Nakamura T:Primary osteoarthritis of the hip joint in Japan. Clin Or- thop Relat Res 241:190196, 1989.
3)Michaeli DA, Murphy SB, Hipp JA:Comparison of predicted and measured contact pressures in nor- mal and dysplastic hips. Med Eng Phys 19:180 186, 1997.
Fig. 7:Bone model of the left hip showing the geographical zone method of Ilizaliturri et al.23)(a)and radial plane method used in our study(b). Tinted areas indicate high T2 values in our study. A=anteri- or, AS=anterosuperior, SA=superoanterior, S=superior, SP=superoposterior, PS=posterosuperior, P=posterior.
4)Harris WH:Etiology of osteoarthritis of the hip.
Clin Orthop Relat Res 213:2033, 1986.
5)Wiberg G:The anatomy and roentgenographic ap- pearance of a normal hip joint. Acta Chir Scand 83(Suppl 58):738, 1939.
6)Beltran LS, Rosenberg ZS, Mayo JD, De Tuesta MD, Martin O, Neto LP, Bencardino JT:Imaging evaluation of developmental hip dysplasia in the young adult. AJR Am J Roentgenol 200:1077 1088, 2013.
7)Trousdale RT, Ekkernkamp A, Ganz R, Wallrichs SL:Periacetabular and intertrochanteric osteotomy for the treatment of osteoarthrosis in dysplastic hips. J Bone Joint Surg Am 77:7385, 1995.
8)Trumble SJ, Mayo KA, Mast JW:The periacetabular osteotomy. Minimum 2 year followup in more than 100 hips. Clin Orthop Relat Res 363:5463, 1999.
9)Yasunaga Y, Ikuta Y, Kanazawa T, Takahashi K, Hi- satome T:The state of the articular cartilage at the time of surgery as an indication for rotational ace- tabular osteotomy. J Bone Joint Surg Br 83:1001 1004, 2001.
10)Nieminen MT, Rieppo J, Töyräs J, Hakumäki JM, Silvennoinen J, Hyttinen MM, Helminen HJ, Jurve- lin JS:T2 relaxation reveals spatial collagen archi- tecture in articular cartilage:a comparative quan- titative MRI and polarized light microscopic study.
Magn Reson Med 46:487493, 2001.
11)Xia Y, Moody JB, Alhadlaq H:Orientational de- pendence of T2 relaxation in articular cartilage:A microscopic MRI(microMRI)study. Magn Reson Med 48:460469, 2002.
12) Dunn TC, Lu Y, Jin H, Ries MD, Majumdar S:T2 relaxation time of cartilage at MR imaging:com- parison with severity of knee osteoarthritis. Radi- ology 232:592598, 2004.
13)Blumenkrantz G, Lindsey CT, Dunn TC, Jin H, Ries MD, Link TM, Steinbach LS, Majumdar S:A pilot, twoyear longitudinal study of the interrela- tionship between trabecular bone and articular carti- lage in the osteoarthritic knee. Osteoarthr Cartil 12:9971005, 2004.
14)Nishii T, Tanaka H, Sugano N, Sakai T, Hanano- uchi T, Yoshikawa H:Evaluation of cartilage ma- trix disorders by T2 relaxation time in patients with hip dysplasia. Osteoarthritis Cartilage 16:227 233, 2008.
15)Nishii T, Shiomi T, Tanaka H, Yamazaki Y, Murase
K, Sugano N:Loaded cartilage T2 mapping in pa- tients with hip dysplasia. Radiology 256:955 965, 2010.
16)Petchprapa CN, Dunham KS, Lattanzi R, Recht MP:Demystifying radial imaging of the hip. Ra- diographics 33:E97E112, 2013.
17)Tönnis D, Heinecke A:Acetabular and femoral an- teversion:relationship with osteoarthritis of the hip J Bone Joint Surg Am 81:17471770, 1999.
18)Harris WH:Traumatic arthritis of the hip after dis- location and acetabular fractures:treatment by mold arthroplasty. An endresult study using a new method of result evaluation. J Bone Joint Surg Am 51:737755, 1969.
19)Link TM, Neumann J, Li X:Prestructural cartilage assessment using MRI. J Magn Reson Imaging 45:949965, 2017.
20)Ross JR, Zaltz I, Nepple JJ, Schoenecker PL, Clo- hisy JC:Arthroscopic disease classification and in- terventions as an adjunct in the treatment of acetabular dysplasia. Am J Sports Med 39 Suppl: 72S78S, 2011.
21)Fujii M, Nakashima Y, Jingushi S, Yamamoto T, Noguchi Y, Suenaga E, Iwamoto Y:Intraarticular findings in symptomatic developmental dysplasia of the hip. J Pediatr Orthop 29:913, 2009.
22)Ho CP, Surowiec RK, Ferro FP, Lucas EP, Saroki AJ, Dornan GJ, Fitzcharles EK, Anz AW, Smith WS, Wilson KJ, Philippon MJ:Subregional Ana- tomical Distribution of T2 Values of Articular Carti- lage in Asymptomatic Hips. Cartilage 5:154 164, 2014.
23)Ilizaliturri VM Jr, Byrd JW, Sampson TG, Guanche CA, Philippon MJ, Kelly BT, Dienst M, Mardones R, Shonnard P, Larson CM:A geographic zone method to describe intraarticular pathology in hip arthroscopy:cadaveric study and preliminary report.
Arthroscopy 24:534539, 2008.
24)Chung CY, Park MS, Lee KM, Lee SH, Kim TK, Park JH, Lee JJ:Hip osteoarthritis and risk factors in elderly Korean population. Osteoarthritis Carti- lage 18:312316, 2010.
25)Chegini S, Beck M, Ferguson SJ:The effects of impingement and dysplasia on stress distributions in the hip joint during sitting and walking:a finite element analysis. J Orthop Res 27:195201, 2009.
(令和 2.8.31受付,令和 2.10.5受理)
「The authors declare no conflict of interest.」