
Quantum Phase Transition of 3He in Aerogel at a Nonzero Pressure
著者 Matsumoto Koichi, Porto J.V., Pollack L., Smith E.N., Ho T.L., Parpia J.M.
journal or
publication title
Physical Review Letters
volume 79
number 2
page range 253‑256
year 1997‑01‑01
URL http://hdl.handle.net/2297/1684
Quantum Phase Transition of
3He in Aerogel at a Nonzero Pressure
K. Matsumoto,* J. V. Porto, L. Pollack, E. N. Smith, T. L. Ho,†and J. M. Parpia
Laboratory of Atomic & Solid State Physics and Materials Science Center, Cornell University, Ithaca, New York 14853 (Received 14 January 1997)
We present evidence for a nonzero pressure,T 0superfluid phase transition of3He in 98.2% open aerogel. Unlike bulk3He which is a superfluid atT 0at all pressures (densities) between zero and the melting pressure,3He in aerogel is not superfluid unless the3He density exceeds a critical valuerc. About 90% of the3He added aboverccontributes to the superfluid density. [S0031-9007(97)03585-0]
PACS numbers: 67.57. – z
The only known substance naturally free of impuri- ties is the low temperature liquid phase of 3He which al- lows the study of Fermi superfluids in their purest forms.
This self-purification of 3He has made it impossible to introduce disorder or impurities into the system. Ex- periments show that 3He superfluids in aerogel display behavior [1 –3] very different from earlier studies in con- fined geometries where diffuse surface scattering that sup- presses Tc dominates [4] and the size distribution smears out the sharp magnetic and mechanical responses of the bulk [5,6,7]. It was generally believed thatp-wave super- fluids are easily damaged by disorder [8], but the newest experiments [1–3] show that notwithstanding theTc sup- pression, superfluid coherence remains robust in aerogel.
However, the phase diagram is completely modified de- spite the small volume fraction occupied by the aerogel.
Aerogel is a tenuous random solid network of SiO2 particles sø25Å radiid with fractal correlations between 30 and 1000 Å [9]. Aerogels have very large surface areas and very low densities (22.9 m2ycm3and 39.4 gyl, respectively, for our samples), and very dilute aerogels occupy less than a few percent of the volume. Despite the tenuous fractal structure, the mean distance from a point in the open volume to a silica strand can be100Å. Since the silica diameter is smaller than the superfluid coherence length sj0 150 800 Åd, the aerogel will not behave like a surface. Instead it acts more like a collection of impurities, thus allowing the study of impurity effects on strongly interacting Fermi liquids. This “impurity”
view is supported by the fact that superfluid 3He in aerogel is coherent and homogeneous [2]. In many ways, the depairing effect of aerogel on the p-wave superfluid is similar to that of magnetic impurities on s-wave superconductors [10]. An aerogel concentration of,2%
strongly suppresses Tc [1,2]. The possibility that this strong suppression can result in aT 0phase transition and the very low temperature behavior of this system are the subject of this investigation.
To put our results which we present later in perspec- tive, we first summarize recent experimental findings: (i) The superfluid behaves as a homogeneous fluid with sharp magnetic [2,3,11] and mechanical [1,11] responses. (ii) In magnetic fields of the order of 1 kG, the superfluid phase
appears to be A-like [2]. Recent experiments [3] show that the superfluid behaves like theB-phase if the3He on the surface of the aerogel is replaced with4He. Experi- ments in Manchester [11] in much lower fields (50 G) show that the magnetic response of the3He isA-like be- low 7.5 bars and B-like at higher pressure, displaying a reversal of the relative stability with pressure of the bulk AandBphases. (iii) The temperature dependence [1,11]
of the superfluid density nearTcfrsyr ~s12TyTcd1.4g cannot be described by the mean-field behavior as in the bulk. (iv) Even though the superfluid appears to be A-like, the lack of dipole restoring torque [2] for large angle tipping pulses cannot be explained by any homo- geneousp-wave structure. (v) The transition temperature sTcd is suppressed quadratically in relatively small mag- netic fields [3].
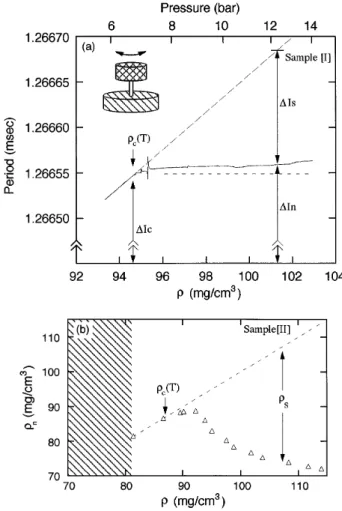
In this paper, we report yet another distinct feature of 3He in aerogel — a quantum (normal to superfluid) phase transition (QPT) at a density above the zero pressure sP 0d value. A quantum phase transition is a continuous phase transition at T 0 that reflects the alteration of the ground state of the system brought about by a change of the parameters [12,13] (in this case, the density, r) of the system. This behavior is in contrast to bulk 3He, which is a superfluid for all densities at T 0. In the new data (sample I) described in this Letter, we varied P at a fixed low temperature, T, so that a superfluid signal could be observed above PcsTd [or above a critical density rcsTd]. This allowed us to map out the low temperature portion of the phase diagram of 3He in aerogel. We compare this behavior to that of an earlier sample II which had an identical open volume (98.2%) but which may have had different correlations arising from differences in the growth pH [9,14]. We find that in sample I an extrapolation of the data shows that the system remains normal atT 0unless the 3He density exceeds a critical valuercsT 0d. For sample II, we were unable to observeTcfor pressures below 2.7 bar and temperatures below 0.5 mK. The extrapolation of the rcsT . 0.5mKd data for 3He in sample II does not extend down sufficiently in temperature to unambiguously resolve whether or not there is a superfluid at T 0 for all densities. The normal and superfluid densities
srnandrsd of these two samples behave completely differently as a function of density. In the following, we first describe the experiments leading to these results followed by a discussion of the implications of these data.
We use the period of a torsional oscillator (inset to Fig. 2 below) operated at its resonant frequency to measure the superfluid density. The oscillator head contains a sample of 98.2% open aerogel filled with liquid 3He. A small (5%) bulk superfluid sample is located immediately below the aerogel in this cell. All the normal fluid ( both bulk and in the aerogel) is coupled by viscosity to the oscillator, so the period shift,DP, belowTcis proportional to the sum of the superfluid densities in the aerogel and the bulk. In the earlier experiments at Cornell [1] on sample II and at Northwestern [2,3],Tc was observed by slowly warming at constant pressure. The transition temperature could not be observed below about 0.45 of Tc0 (the bulk Tc) because the period shift was too small at lower pressures and extinguished the Tc signature in an experimentally accessible temperature range. A similar effect was noted in the NMR measurement [2] below about 0.65 ofTc0.
The period signal seen while warming at a fixed pres- sure is shown in Fig. 1. TheTcfor both bulk3He and3He in aerogel can be clearly seen. The superfluid fraction, rsyr, shows many of the characteristics observed in our earlier study (see Fig. 1 of Ref. [1]), with a well defined Tc for the 3He. We observe resonances near Tc, which we associate with a slow mode (first observed for4He in aerogel [15]) similar to second sound and also seen in our earlier study. The presence of the bulk superfluid, while useful as a calibration of absolute temperature, makes it difficult to accurately determine the temperature depen- dence of the 3He superfluid density particularly at low pressures. The data clearly show that rsyr of 3He in aerogel diminishes at lower pressures and the presence of the bulk fluid is a detriment, since the additional period shift due to the signal from the aerogel becomes too small
FIG. 1. Three data sets of period vs temperature obtained at 20, 13.7, and 9 bars. Vertical arrows indicate the onset of the bulk superfluid transition,Tc0, and horizontal arrows show the onset ofTc of3He in aerogel. The superfluid signal at 9 bars is nearly undetectable.
to fixTc accurately. We had to modify our experimental approach in order to explore the low temperature part of the phase diagram.
To proceed with the experiment we employed a tech- nique used by Movshovich et al. [16] and varied the pres- sure at fixed temperature [17]. The superfluid density of the bulk3He changes smoothly and any sharp features of the measured period with pressure must be due to the3He in the aerogel. Below 0.3 ofTc0, the normal fraction of the bulk3He is nearly pressure independent and is of the order of 4% [18]. As the pressure is increased, the con- tribution of the bulk rn to the period change between 6 and 14 bars is ,5ns and can be neglected. In the dis- cussion that follows, we will designate the density of su- perfluid3He in aerogel asrs. The results of a pressure sweep at 0.295 mK for sample I is shown in Fig. 2(a).
FIG. 2. (a) A pressure sweep from 14 to 5.6 bars for sample I at T 0.295mK. The dashed line represents the period for rigid body rotation. At rcsTd, the measured period falls below the dashed line, signaling the onset of superfluidity. The measured periodDInis directly proportional to the normal fluid density, whereas DIs is directly proportional to the superfluid density. In this sample, DIn . DIc. In ( b) we show a composite obtained from constant pressure runs between 0 and 29 bar for sample II at 0.5 mK. In this sample,rn falls below rcas the density is increased. The shaded region corresponds to the unphysical region of density belowP 0.
254
This data can be contrasted with a composite [ Fig. 2( b)]
assembled from runs at constant pressure from sample II at a higher temperature of 0.5 mK. The dashed lines that pass through the low density data in Figs. 2(a) and 2( b) represent the expected behavior if all the3He in the aero- gel were participating in rigid body rotation (“rigid body period”). At a critical density,rc (arrow), the signals of both samples stop increasing linearly and fall below the dashed line, signaling a continuous transition into the su- perfluid phase. The measured period shift is directly pro- portional to rn, the density of the normal fluid in the aerogel. The superfluid density, rs, is directly propor- tional to the difference between the observed period and the rigid body period [indicated asDIS in Fig. 2(a) andrs in Fig. 2( b)].
By carrying out similar measurements at different tem- peratures below 0.93 mK, we obtain the low temperature portion of the phase boundary Pc PcsTd for sample I represented as circles in Fig. 3. For higher temperatures the period shift has some contribution due to the bulk normal fluid, but below Tc0 this is a smooth function of temperature and the determination ofTc in aerogel is un- ambiguous. Data from sample II (triangles in Fig. 3) are also shown for comparison. Extrapolation of the data show that the normal-superfluid phase boundary obtained with sample I intersects the pressure axis. Thus, a normal to su- perfluid transition atT 0at a nonzero pressure and the existence of a critical densityrcsT 0dfor the onset of superfluidity are features of the sample I. The correspond- ing phase boundaries in the temperature-density plane are shown in the inset to Fig. 3. In this view, the very rapid drop in Tc near rcsT 0d reflects the flattening of the PsTcdphase diagram. On the other hand, it is ambiguous
FIG. 3. The phase diagram for superfluid 3He in bulk (solid line), data from Ref. [1] sDd, and this experimentssd. Inset showsTc vs density (same symbols).
whether the phase boundary of sample II extrapolates to a T 0transition and arcsT 0d. In fact, the behavior of sample II appears to be closer to that of the bulk than to sample I. The absence ofT 0transition in sample II would imply that differences in the internal structures of these two identical density aerogels must result in the dif- ference between their phase diagrams. It is known [9,14]
that the microscopic correlations of aerogel structure can be very sensitive to the pHof the growth environment, and it is certainly plausible that the two aerogels differ in structure.
Another difference between samples I and II can be seen in Figs. 2(a) and 2( b). In sample I, for r . rc the period rapidly flattens and displays a small positive slope. This means that for sample I,rn is always above rc. Moreover, if we plot rs against r ( Fig. 4), we find that drsydr 0.9s,1d for a broad range of densities r . rc[19]. Consequently, about 90% of the3He atoms added contribute to thers in aerogel ( Fig. 5). At higher temperatures,rsysr 2 rcd decreases so that, likePcsTd in Fig. 3, drsydr 0.9 is the limiting behavior as T !0. In contrast, rn of sample II [ Fig. 2( b)] has a negative slope as density increases withrn falling below rc. When we plotrs vsr, we finddrsydr 1.6s.1d ( Fig. 4) so that a fraction of r , rc must contribute to rs as mass is added above rc. For sample I the superfluid fraction above the critical density, rsysr 2 rcd, is shown in Fig. 5. The result is obtained from the ratio of the inertia decoupled from the pendulum sDIsd to the inertia of the fluid added above the critical density sDIs 1 DIn 2 DIcd[see Fig. 2(a)], and we find that this fraction approaches a constant (0.90) as the density is increased for sample I.
We now turn to the behavior of the QPT for 3He in aerogel. The immediate questions relate to the size of the
FIG. 4. The superfluid density (in aerogel),rs, as a function of density r for samples I: T 0.295mK (continuous line);
and sample II:T 0.5mKsnd. Above the region of rounding visible in Fig. 2(a) nearrc, drsydr0.9for sample I. As r . rc,drsydr1.6for sample II. For reference we show a dashed line of slope 1.0 between the two data sets.
FIG. 5. rsof3He in aerogel normalized torabovercagainst the density atT 0.295, 0.58, and 0.85 mK for sample I. The coldest trace approaches the limitingT 0behavior.
quantum critical region and the nature of the normal state The steep behavior ofTcnearrcis the best indicator that thermal excitations play a diminishing role, which may im- ply a sizable quantum critical region. To explore this pos- sibility, we apply the standard phase fluctuation model for critical behavior [20], which finds Tc ~ sr 2 rcdzn and rs ~ sr 2 rcdsd1z22dn. Here d 3 is the dimension- ality, z is the dynamical critical exponent characterizing the asymmetry in space and time of the quantum critical phenomena, andnis the critical exponent representing the divergence of the correction length j as r approaches rc,j ~ sr 2 rcd2n. We find that sd1 z2 2dn 1.24 60.18 (for 0.01 , r 2 rc ,10fmgycm3g) and zn 0.42 60.04[21] (for allTcin Fig. 3), which yields z 0.560.1 and n 0.82 60.16 [22]. However, these fits are not ideal since the thermometry lacked resolution and the sound resonances prevent us from accurately finding the exponent. Thus it is not clear that the transition is truly dominated by quantum behavior or whether a mean-field description is more appropriate.
In conclusion, we have found that 3He in 98.2% open aerogel undergoes a quantum phase transition between a normal and superfluid state atrc greater than theP 0 value. The nature of the normal state of 3He in aerogel needs to be explored further to examine the possibility that the normal fluid for r , rc is significantly modified by the aerogel. The strong difference between the behavior of superfluid 3He in aerogels with identical density implies that the role of correlations in the aerogel structure needs to be investigated and understood.
The aerogel sample was grown by N. Mulders in M.
Chan’s group at Penn State. We thank Michael Ma for discussions. The NSF supported this work through DMR-9424137, and through the Cornell MSC under DMR-9121654 as well as the Dept. of Education under P200A10148. K. M. was supported by a grant from the
Ministry of Education, Science, Sports and Culture of Japan.
*On leave from Department of Applied Physics, Tokyo Institute of Technology, Tokyo 152, Japan.
†Permanent address: Department of Physics, The Ohio State University, Columbus, OH 43210.
[1] J. V. Porto III and J. M. Parpia, Phys. Rev. Lett. 74, 4667 (1995).
[2] D. T. Sprague et al., Phys. Rev. Lett. 75, 661 (1995).
[3] D. T. Sprague et al., Phys. Rev. Lett. 77, 4568 (1996).
[4] V. Ambegaokar, P. G. DeGennes, and D. Rainer, Phys.
Rev. A 9, 2676 (1974); L. H. Kjaldman, J. Kurkijarvi, and D. Rainer, J. Low Temp. Phys. 33, 577 (1978).
[5] M. R. Freeman and R. C. Richardson, Phys. Rev. B 41, 11 011 (1990).
[6] K. Ichikawa et al., Phys. Rev. Lett. 58, 1949 (1987).
[7] T. Hall et al., J. Low Temp. Phys. 89, 897 (1992).
[8] See the discussion in A. J. Leggett, J. Phys. ( Paris) 39, C6-1264 (1978).
[9] A. Hasmy et al., Phys. Rev. B 48, 9345 (1993). See also J. V. Porto III and J. M. Parpia, Czeck. J. Phys. 46, 6, 2981 (1996).
[10] A. A. Abrikosov and L. P. Gorkov, Zh. Eksp. Teor. Fiz.
12, 1781 (1960) [Sov. Phys. JETP 12, 1243 (1961)]. Also I. F. Foulkes and B. L. Gyorffy, Phys. Rev. B 15, 1395 (1977).
[11] J. Hook, Bull. Am. Phys. Soc. 42, 799 (1997).
[12] S. Chakravarty, B. I. Halperin, and D. R. Nelson, Phys.
Rev. B 39, 2344 (1989).
[13] For a pedagogical review on QPTs we refer to S. Sondhi et al., Rev. Mod. Phys. 69, 315 (1997).
[14] J. V. Porto III, Ph.D. thesis, Cornell University, 1997 (unpublished).
[15] J. McKenna, T. Slawecki, and J. D. Maynard, Phys. Rev.
Lett. 66, 1878 (1991); N. Mulders et al., Phys. Rev. Lett.
67, 695 (1991).
[16] R. Movshovich et al., Phys. Rev. B 44, 332 (1991).
[17] We ramped the pressure at different rates to look for thermal relaxation of the superfluid at the end of the ramp. At the rate used, no such heating signal was observed. Typically, the pressure was decreased slowly as this caused less heating. By comparing the temperature dependence of bulkrsat 5 bars [18], we are confident that the temperature in the cell is comparable to that read by the Pt NMR thermometer to 0.25 mK.
[18] J. M. Parpia et al., J. Low Temp. Phys. 61, 337 (1985).
[19] If we ignore the region of rounding visible in Fig. 2(a) just aboverc, the limiting value ofdrsydr 0.9asrs
goes to zero.
[20] M. P. A. Fisher et al., Phys. Rev. B 40, 546 (1989).
[21] The exponentznwould be 1 if the behavior were identical to that of magnetic scatterers in ans-wave superconductor (Ref. [10]).
[22] A. B. Harris, J. Phys. C 7, 1671 (1974). The value of n 0.82is consistent with the quantum Harris criterion.
256
![FIG. 3. The phase diagram for superfluid 3 He in bulk (solid line), data from Ref. [1] sDd, and this experiment ssd](https://thumb-ap.123doks.com/thumbv2/123deta/10143303.1977173/4.918.81.439.708.1018/fig-phase-diagram-superfluid-bulk-solid-line-experiment.webp)

