Acta med. Nagasaki. 13: 228-261
Effect of Lesion of the Lateral Geniculate Body on the EEGs and Photically Evoked Potentials in the Cerebral Visual, Somatosensory and Association
Areas of Unanesthetized Cat
Toru ISHINO
Second Department of Physiology
Nagasaki University School of Medicine, Nagasaki, Japan
Received for publication, March 8,1969
Visually evoked potentials and background EEGs in the cerebral visual, somatosensory, and association areas (lateral suprasylvian gyrus), as well as in the lateral geniculate body (GL) and mesencephalic reticular formation were studied before and after unilateral destruction of the GL of unanes- thetized cat. Autocorrelograms and power spectra of background EEGs in various areas mainly showed activities of less than 5 c/s. Unilateral GL destruction caused considerable depression of the ipsilateral EEG activities and mild depression in the contralateral EEGs in most regions except the somatosensory area, where some augmentation was observed. Unilateral putamen destruction resulted in augmented EEG activities in various areas.
GL activity seemed to augment EEG activities in the cerebral visual and association areas, while it seemed to depress the activity in the somato- sensory area.
Summation average of evoked potentials in the association area likewise manifested quite similar diphasic deflections within 130 msec after flashing light stimulus. The initial positive deflection P1 led bipolarily in the medial visual association area was found to be longer in duration than in the medial visual area. Peak latencies of the second positive-negative deflection
(P2N2) and third positive deflection P3 in the association area were about 10 msec longer than those in the visual area and this was proven to be statistically significant. Amplitudes of the initial and second diphasic deflections in the medial visual area were higher than those in the posterior visual and medial association areas, whereas amplitudes of the third and fourth deflections in the medial visual area were lower than those in the association area.
Almost complete destruction of the GL resulted in disappearance of the initial and succeeding diphasic deflections, and there remained a slow negative wave with a crest at about 70 msec after the flashing stimulus which presumably had been masked by the above deflections prior to GL
*石 野 徹
destruction. After partial destruction of the GL, the initial and succeeding deflections were sustained, but prolonged in their peak latencies and decr- eased in their amplitudes. It was suggested, therefore, that the association area (medial lateral suprasylvian gyrus) may have intimate interaction with the lateral geniculate body, and that the slow negative wave follow-
ing the initial positive deflection may have been brought out through the indirect nonspecific projection system.
INTRODUCTION
Many reports have been published on the visually evoked potential (VEP) of cat elicited by flashing light stimulus. 5,7,8, 12, 21, Such authors as BRAZIER (1957)3), HIROTA (1965)9), STEINBERG(1965)18', TAGAWA (1966) 19) , NORTON and JEWETT (1967)111, etc. have applied computer techniques to the analysis of various response components of the VEP in the visual area brought out during the period 200 msec to 750 msec after flashing light stimulus. It was demonstrated by BIGNALL et al. (1966)5' that the VEP is brought out not only in the primary visual area, but also in the secondary visual area (Area 18, OTUKA and HASSELER 1962)16' and in the lateral suprasylvian gyrus (association area), to which direct input from the lateral geniculate body (GL) has been reported by VASTOLA (1961)22', etc. Further, the VEP produced in the lateral suprasylvian gyrus has been found to remain intact even after destruction of the nonspecific portion in the thalamus (BIGNALL 19665').
In this paper, therefore, an analysis of the VEP in the above men- tioned association area was done in relation to that in the lateral gyrus (visual area) of unanesthetized, immobilized cat by the application of the summation average method using the computer, before and after destructian of the lateral geniculate body (GL). In addition, the influ- ences of GL destruction on EEG background activities were also ob- served in terms of autocorrelogram and power spectra.
METHODS
22 adult cats weighting 2.3-4 Kg were used. After tracheal canula-
tion under ether anesthesia, the animal was mounted on JOHNSON'S
type stereotaxic instrument. Holes of about 1 mm diameter were made
on the scalp. Following this surgical procedure, gallamine triiodoethy-
late (Flaxedil) was administrated intraperitoneally, 20 mg/Kg body
weight, to immobilize the cat and artificial respiration with oxygen
mixed air was performed at a rate of 24 per minute. Silver-ball tipped
electrodes, 0.5mm in diameter, were placed as surface electrodes on
the dura in the bottom of the holes. Four, three and one surface
electrodes were placed in the lateral gyrus (L1 , L2 , L3 , and L4) lateral
suprasilvian gyrus (SS, SS 3 and SS ,,) and posterior sigmoid gyrus
(PS), respectively. The approximate stereotaxic coordinates of these surface electrodes were PS (A: 22.0, L: 6.0), L4 (A: 16.0, L: 2.0), L3 (A: 6.0, L: 2.0), L2 (A: -2.0, L: 2.0), L, (A: -6.0, L: 4.0), SS3 (A: 6.0, L:9.0), SS, (A: 16.0, L: 9.0) and SS, (A: -2.0, L:
9.0), respectively. Bipolar depth electrodes of stainless steel, insulated except at their tips, were inserted 2-3 . mm apart aimed at the lateral geniculate body (GL) (A: 6.0, L : 10.0, H : + 3.0) . GL was destroyed by delivery of a current of 5 - 6 mA through the depth electrodes for 5-6 minutes in most instances, and a current of over 10 mA for more than 10 minutes in some instances. In control experiments, depth elec- trodes were inserted into the putamen (A: 12.0, L: 10.5, H : -1.0) of two cats to destroy the putamen using the same current as that for GL destruction. Electroencephalographic potentials in various areas on the cortical surface and in the lateral geniculate body were led mono- polarily from the surface silver-ball tipped electrodes and one of the depth electrodes, respectively. The reference silver electrode was in- serted into the neck muscle. The location of the tips of the depth elec- trodes and the region destroyed were checked histologically by KLUVER- BARRERA'S staining method"' after sacrificing the animal at the end of the experiment. Flashing light was delivered through the photic stimulator (PS 101, San' ei-Sokki Co.) at 1.6 or 2.0 sec intervals to both eyes, which had been dilated by 0.5% atropin sulphate. The flashing light from the strobo flash bulb (FT-100, Mazda) was of about 6000°K bluish, white daylight, 1 Whatt/sec and about 100 i-isec duration. The bulb was placed 50 cm from the eyes. A frosted
glass plate and an iris of 100 mm diameter were placed in front of the bulb to diffuse the light and to fix its intensity. For greaterr diffu- sion, a white cotton curtain was hung between the iris and the eyes.
If the intensity of the diffused flashing light passing through the iris of 5 mm diameter is taken as 0 on a logarithmic scale, then the relative intensity of the flashing light through the iris of 100 mm diam-
eter was 2.6 as measured by photovalve and CRO (see SATO and Ki- TAJIMA 1965x'') . Masspotentials in various sites and the stimulus signal were recorded onto 1/4 inch magnetic tape by the PWM and FM me- thods, respectively, through 8-channel polygraph (RM-150 Nihon Kohden Co.) and 8-channel Data Recorder (SPRA-48, Shiroyama Tsushin or SDR-41 Nihon Kohden). EEG records were monitored by inkrecords of the polygraph and two four-beam CROs (VC6-Nihon Kohden Co.), while the stimulus signal was monitored by one beam synchroscope (SS-5022, Iwasaki Tsushin, Co.). The averaged visual evoked potentials (VEP) by summation technique were obtained by feeding the play back currents from the magnetic record into the Digital Computer for Data Processing (ATAC-401 or ATAC-501- 20, Nihon Kohden Co.).
Autocorrelograms and power spectra of EEGs were computed by
HITAC 5020 (Computer Center, Tokyo University) or FACOM 270-20 (Shionogi Computer Center, Osaka) on 600 discrete data obtained at every 1/60 sec (=16.7msec) from an EEG record of 10 sec length.
Autocorrelograms of EEGs were also obtained by A T AC-501-20.
RESULTS
It was confirmed by histological examination that the GL had been almost completely damaged in two cats. In twelve cats it was partially destroyed, of which five had partial destruction of the optic radiation (OR) and/or optic tract (OT), while the other seven cats had destruc- tion of suprasylvian gyrus around the depth electrode. In six cats, the GL was intact with damage of the optic radiation only or of the OR and suprasylvian gyrus. In two cats, putamen destruction was performed as the control experiments.
1. Influences of GL lesion on background EEG activity.
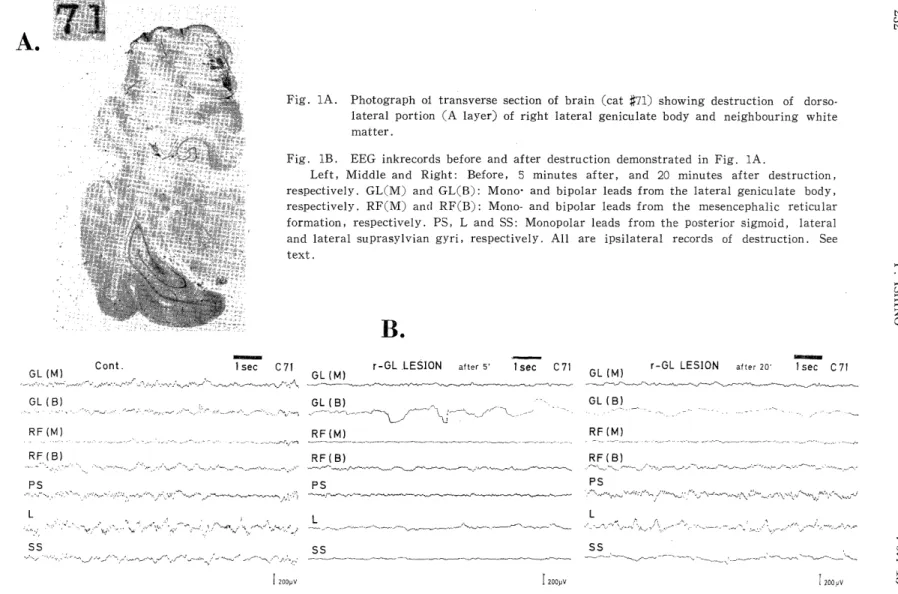
Fig. 1A shows an example of a histological section of brain (cat#71) showing destruction of the dorsolateral site (A layer) of the GL and white matter of the cerebrum. EEG ink records, before and after the destruction, in the posterior sigmoid (PS), lateral (L) and lateral su- prasylvian gyri (SS), lateral geniculate body (mono-(GL(M)) and bipo- lar leads (RF(B)) are depicted in Fig. 1B. Five minutes after destru- ction of the right GL, rhythmic activities which had been seen in all of the above EEGs were depressed, and bipolar records of GL showed irregular, slow fluctuations. The changes in EEGs which were still unstable five minutes after destruction gradually became stable with elapse of time, and after twenty minutes they seemed to have become sufficiently stable.
Twenty minutes after destruction, EEG activities, e. g. 11-12 c/s activities, in the PS had recovered adequately, whereas those in other regions had not. Recovery of EEG activities in L and RF(B) was rela- tively good, while recovery in SS, RF(M), GL(M) and GL(B) was less than in other regions.
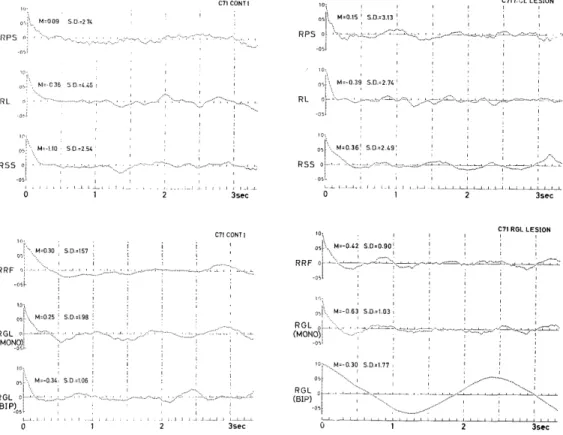
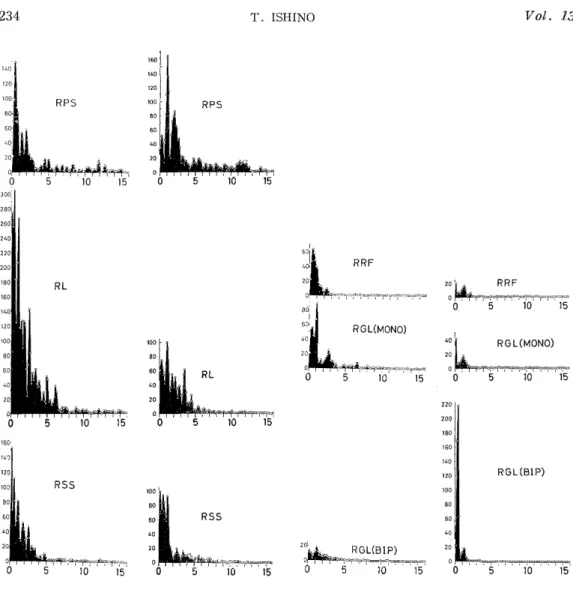
In the normalized autocorrelograms (Fig. 1C) of the above EEGs before and 20 minutes after destruction, changes due to destruction were rather obscure probably because the autocorrelograms had been normalized. However, the power spectra (Fig.1D) of these EEGs showed effects of the destruction. In the spectra of PS, not only 11-12 c/s activities, but also slow activities of 0.5-3 c/s were enhanced after destruction, whereas most activities in other regions, except the bipolar lead in GL, were depressed by destruction, though 6 c/s activities in SS were augmented slightly.
Fig. 2A shows an example of almost complete destruction of only GL.
In the control EEGs before destruction (Fig.2B, left), spindle-like fast
Fig. 1A. Photograph of transverse section of brain (cat X71) showing destruction of dorso- lateral portion (A layer) of right lateral geniculate body and neighbouring white
matter.
Fig. lB. EEG inkrecords before and after destruction demonstrated in Fig. 1A.
Left, Middle and Right: Before, 5 minutes after, and 20 minutes after destruction,
respectively. GL(M) and GL(B): Mono- and bipolar leads from the lateral geniculate body,
respectively. RF(M) and RF(B): Mono- and bipolar leads from the mesencephalic reticular
formation, respectively. PS, L and SS: Monopolar leads from the posterior sigmoid, lateral
and lateral suprasylvian gyri, respectively. All are ipsilateral records of destruction. See
text.
Fig. 1C. Autocorrelograms of EEGs before (left) and 20 minutes after destruction (right).
600 discrete data were sampled at 1/60 sec intervals from the EEG record shown in Fig.1B over a 10 sec length, and its autocorrelogram was computed by general
purpose digital computer (HITAC 5020 or FACOM 270-20). Mean and S.D.: Mean and standard deviation of the discrete time series of EEG.
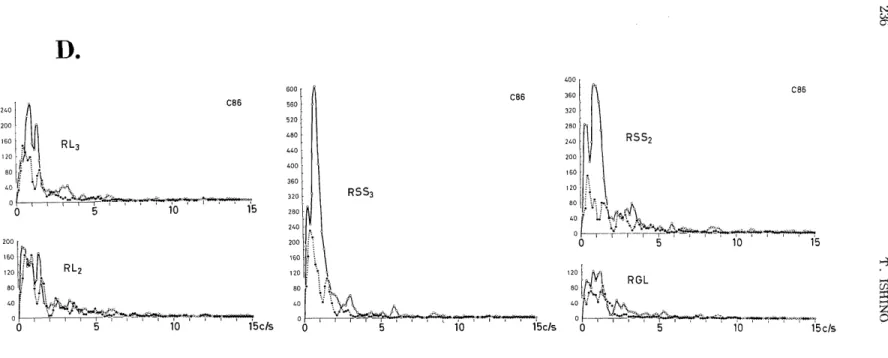
oscillations of about 24 c/s and about 12 c/s were superimposed on slow waves of about 1-1.5 c/s which suggested a stage of spindle sleep. After destruction of GL, this spindle wave of about 24 c/s was depressed (Fig. 2B, right). Relatively regular oscillations seen in the normalized autocorrelograms of EEGs before destruction changed to irregular oscillations after destruction (Fig. 2Q. In addition, the power spectra (Fig .2D) depicted depression of almost all slow activities of
less than 6 c/s in all regions including the L3 , L2 , SS3, SS2 and GL.
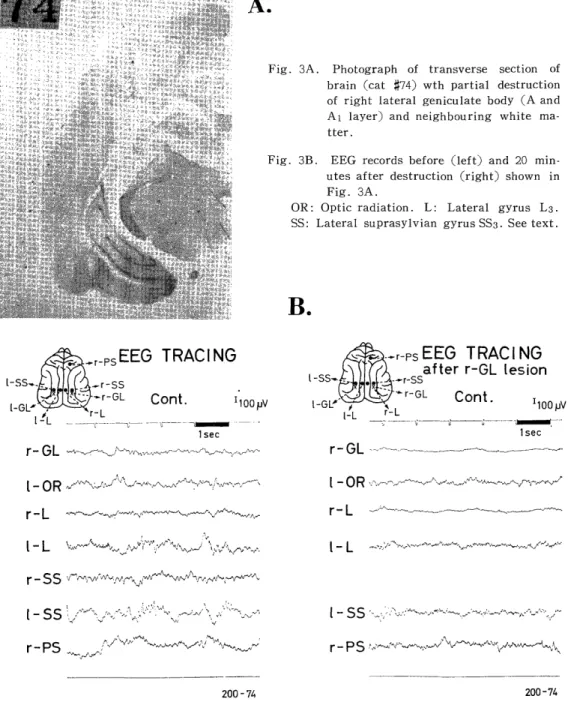
Even partial destruction of GL, such as demonstrated in Fig. 3A
which is an example of dorsolateral lesion corresponding to the A and
Al layers, was found to produce depression of the 8-12 c/s oscillation
and disappearance of the slow wave of 0.5 c/s in the lateral (1-L) and
association areas (1-SS) (Fig. 3B) of the contralateral side of GL de-
straction. On the side of the GL destruction, all activities in the lateral
gyrus (r-L) were depressed, whereas in the posterior sigmoid gyrus
(r-PS) the slow wave of about 0.5 c/s was depressed, though the fast
Fig. 1D. Power spectra of EEGs obtained from the autocorrelograms (Fig. 1C) through general purpose digital computer.
Abscissa: Frequency (Hertz). Left and Right: Before and 20 minutes after the destruction of right GL. Abbreviation see Fig. 1B. R indicates right side.
activity of 16 c/s in this gyrus remained the same as in Fig. 1.
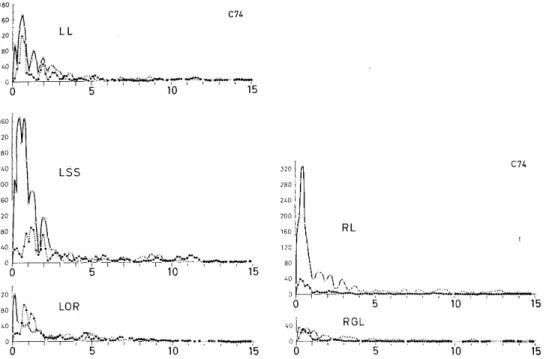
In the power spectra of EEGs (Fig. 3D), the slow activities of less than 5 c/s in the ipsilateral lateral gyrus (RL) and those of less than
about 3 c/s in the contralateral suprasylvian gyrus (LSS) were markedly depressed, whereas those in the lateral gyrus (LL) contralateral to the GL destruction were only slightly depressed, and activities of about 1 c/s were enhanced in the contralateral optic radiation (LOR). Depressive effects of destruction were also suggested on the normalized autocorre- lograms (Fig. 3C) and by the standard deviations (Fig. 3C and Table 1) of EEGs before and after destruction.
As demonstrated in Fig. 1,2 and 3, some EEG activities of less
than 5 c/s, such as 0. 5, 1, 1.5 c/s etc. in lateral (visual), suprasylvian
(association) gyri were depressed not only on the same side but also
AUIDCORRELOGRAMS
Fig. 2A. Photograph of transverse section of brain with almost complete destruction of lateral geniculate (cat #86).
Fig. 2B. EEG records before (left) and twenty minutes after (right) destruction of right lateral geniculate body.
L4, L3 and L2: lateral gyrus. SS3 and SS2: lateral suprasylvian gyrus. See Fig. 6.
Fig. 2C. Auto correlogran3 of ET-3 rec)rd; before (left) ail 2) mla-,ttes after destruction of the right lateral geniculate body (RGL).
Fig. 2D. Power spectra of the autocorrelograms in Fig. 2C.
White circles and bold line: Before destruction of right lateral genicalate body. Black circles and dotted line: 20 minu-
tes after destruction. Explanation, see text.
Fig. 3A. Photograph of transverse section of brain (cat #74) wth partial destruction
of right lateral geniculate body (A and
Al layer) and neighbouring white ma-
tter.
Fig. 3B. EEG records before (left) and 20 min- utes after destruction (right) shown in
Fig. 3A.
OR: Optic radiation. L : Lateral gyrus L3.
SS: Lateral suprasylvian gyrus SS3. See text.
on the opposite side of the destruction of GL and/or the cerebral white matter, whereas EEG activities in the posterior sigmoid (somatosen- sory) gyrus (PS) were not supressed but enhanced.
The three examples demonstrated thus far manifested mainly depre-
ssion of a variety of EEG activities caused by destruction of unilateral
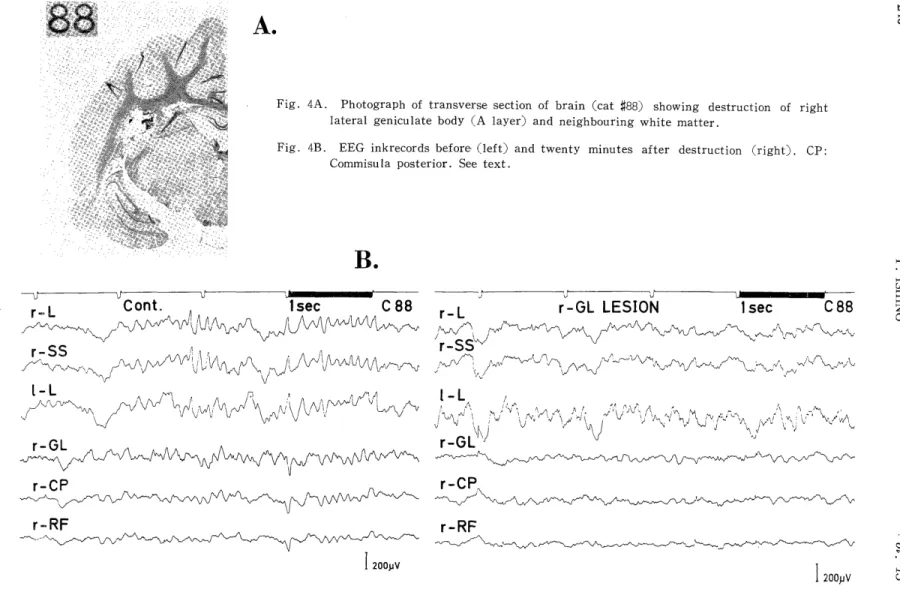
GL. The example illustrated in Fig.4, on the contrary, showed some
augmentations by destruction of the dorsolateral (A layer) portion of
Fig. 3C. Autocorrelograms of EEGs before (left) and twenty minutes after GL de- struction (right).
Fig. 3D. Power spectra of the autocorrelograms in Fig. 3C. See text.
RPS RL RSS RRF RGL(M)
C -71 Before 2.74 4.46 2.54 1.57 1.98
After 3.13* 2.74 2.49 0.910 1.03
RL RSS LL LSS LOR RGL
C - 74 Before 3.20 3.83 3.54 4.34 2.74 1.85
After 1.60 - 2.22 2.59 2.21 1.07
RL RSS LL RRF RGL RCP
C -88 Before 3.42 3.85 5.09 1.73 2.94 2.23
After 3.20 3.54 5.75* 1.56 1.79 1.91
RL3 RL2 RSS3 RSS2 RGL
C -86 Before 3.47 3.52 4.68 4.53 2.82
After 2.63 3.13 2.94 2.84 2.12
Table 1. Standard deviations of background EEGs in various regions before and after destruction of a lateral geniculate body.
600 ordinates of an EEG were sampled at 1/60 sec intervals over a length of 10 sec, by which an autocorrelogram was computed, so that
square of the standard deviation is the ordinate of the autocorrelogram
at the time origin. All differences in standard deviations before and after the destruction were statistically significant (F-test, P=0.01). It was
suggested, therefore, that most EEGs had been depressed by destruction,
whereas that in the posterior sigmoid gyrus (PS) was augmented.
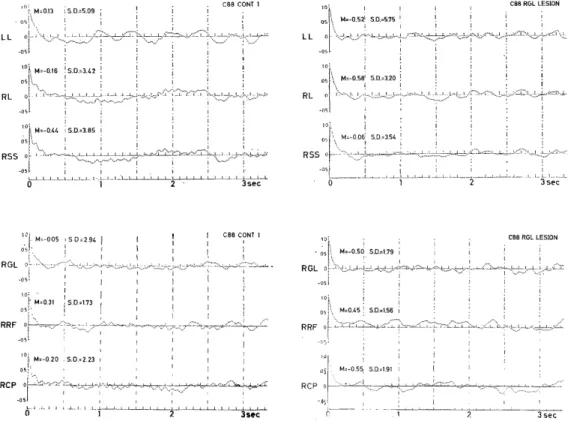
the unilateral GL and partial destruction of the cerebral white matter (Fig. 4A) around the depth electrode. In this instance, in spite of considerable depression of almost all activities of various frequencies in the subcortical regions (r-GL, r-CP, and r-RF in Fig. 4B, C and D), some accelerative changes were verified in the cortical EEG activities, such as the 3.5-4.5 c/s activities in RL, LL and RSS, the approximately 1 c/s activity in RL and RSS, and the 6-9 c/s activities in LL (Fig. 4D). However, considerable depression was seen in the 0.5 c/s activities in the three cerebral regions (RL, LL and RSS) and in the approximately 10 c/s activities in the lateral (RL) and suprasylvian gyri (RSS) on the side of destruction.
The above findings show that destruction of a lateral geniculate body (GL) mainly causes depression of EEG activities in the lateral, suprasylvian gyri and some subcortica l sites.
To determine whether these changes are specific to GL destruction
or not, destruction of another structure by the same condition as used
in GL destruction was performed in two cats. Fig. 5A shows the results
caused by putamen (A:12.0, L:10.5, H: -1.0) destruction. In this inst-
ance, no depressive activities were observed in the EEG ink records in
various cortical and subcortical sites after this procedure, as depicted
Fig. 4A. Photograph of transverse section of brain (cat X88) showing destruction of right lateral geniculate body (A layer) and neighbouring white matter .
Fig. 4B. EEG inkrecords before (left) and twenty minutes after destruction (right) . CP:
Commisu la posterior. See text.
Fig. 4C. Autocorrelograms of EEGs before (left) and after destruction (right). LL and RL: Left and right lateral gyri, respectively. See text.
Fig. 4D. Power spectra of EEG. Abbreviation, see Fig. 4B.
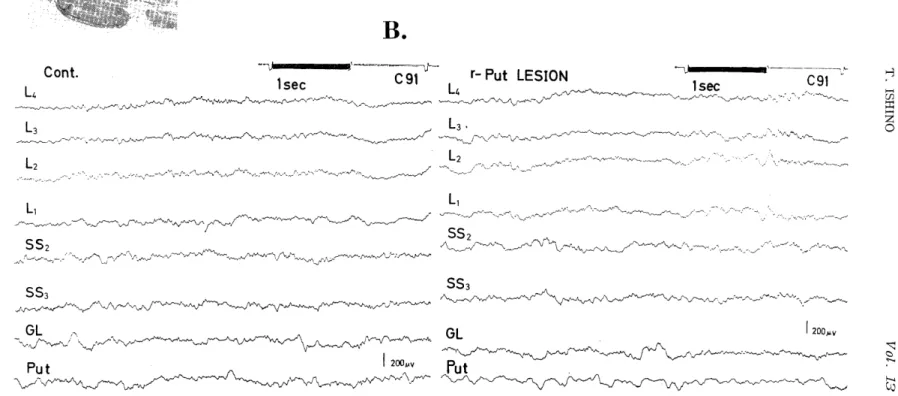
Fig. 5A. Photograph of transverse section of the brain (cat $$ 91) showing right putamen destruction.
Fig. 5B. EEG inkrecords before (left) and twenty minutes,' after destruction (right). Put:
Putamen. See text.
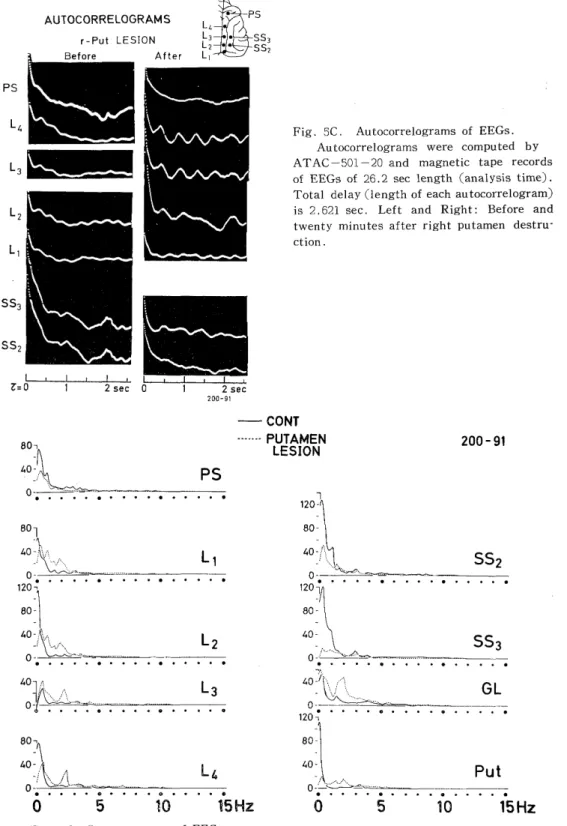
Fig. 5C. Autocorrelograms of EEGs.
Autocorrelograms were computed by ATAC-501-20 and magnetic tape records
of EEGs of 26.2 sec length (analysis time).
Total delay (length of each autocorrelogram) is 2.621 sec. Left and Right: Before and twenty minutes after right putamen destru- ction.
Fig. 5D. Power spectra of EEGs.
Each autocorrelogram obtained by ATAC-501-20 was printed out in a _digita'.
time series of 256 data through the Digital Printer (ATAC 120 and ATAC 125) al
every 10.2 msec.
in Fig. 5B, but rather there was enhancement of some activities.
It was observed that oscillations of about 2 c/s in the autocorrelo- grams of EEGs led from various regions in the lateral gyrus (L2,L3,L4 ) (Fig.5C) had been augmented after destruction. In addition, the fre- quency spectra (Fig. 5D) of the EEGs, which had been obtained by the FACOM computer from the digital time series of the computed au- tocorrelogram (Fig. 5C) by ATAC-501-20 through the Digital Recorder (ATAC 120 and ATAC 125), showed that not only the peaks of about 2 c/s activities, but also peaks of slower frequencies of about lc/s,etc. in the lateral gyrus, lateral geniculate body and putamen were enhanced after putamen destruction. On the contrary, peaks in the postsigmoid (PS) and lateral suprasylvian gyri (SS2, SS3) were depressed after destruction. Almost all of these findings were not only different from those observed by destruction of the lateral geniculate body, but even contradictory.
II. Influences of GL lesion on the averaged evoked potentials.
1). Averaged VEP in the visual and association areas.
By referring to the cortical surface extent of anatomical areas (OTSUKA and HASSLER 196211)), electrodes at L1 , L2 and L3 in the lateral gyrus were located in the primary visual area 17, and electrodes at L4 were in the anterior lateral gyrus, while those at SS4,SS3 ,SS2 in the lateral suprasylvian gyrus were in the association area (Fig.6).
Averaged VEPs to flashing light stimuli obtained by summation technique at L1 ,L2,L3,SS2 and SS3 manifested an initial positive-negative diphasic deflection followed by some positive-negative potentials, whereas VEPs led from the electrodes at L4 and SS, did not demonstrate this initial deflection, as illustrated in, Fig. 6.
The onset latency of the initial positive response brought out
in the lateral suprasylvian gyrus (association area) SS3 was the
same at that obtained in the primary visual area L3 , which was 32
Fig. 6. Visually evoked potentials in the cerebral cortex.
Left: Cerebral primary (17) and secondary (18, 19) visual areas (Top) and locations of monopolar leads (Bottom) in the postsigmoid (PS), lateral (L4, L3, L2 and Li), and lateral suprasylvian gyri (SS4, SS3, SS2), respectively.
Right: Visually evoked potentials (VEPs) elicited by a contra-lateral monocular flash stimulus (Top) and binocular flash stimulus (Bottom).
Fig. 7. Visually evoked potentials in the lateral (L3) and lateral suprasylvian gyri (SS3) led mono- and bipolarily.
Bipolar electrodes were placed 3 mm apart. Difference in the initial positive deflection between the lateral (L3) and suprasylvian gyri (SS3) were more prominent in bipolar records than those in monopolar records.
msec in the instance shown in Fig. 7. However, in comparison with
those led by bipolar leads, the peak latency and duration of the former
response were noted to be longer than those of the later, being 35
msec and 30 msec, respectively.
Each of the initial and late positive-negative deflections obtained by summation of thirty responses through the computer (ATAC-501-20)
from VEPs due to unilateral stimulus were labelled P1 ,N1 ,P2 ,N2 ,P3 , N,,--* in the order of appearance after the method of HIROTA ('1965)".
It was found that the initial and fifth surface positive deflections, P1 and P,, correspond to wave 1 and 8, while the first and fourth negative deflections, N1 and N,, coincide with waves a and g described by STEINBERG (1965)18). Moreover, P,, N1, N4 correspond to waves 1°, 1, ... , 7 of NORTON and JEWETT (1967) 14) . The onset latency of the P1 deflections are illustrated in Table 2.
(2) Peak latency (cosec)
On-L Pi Ni P2 N2 P3 N3 P4 N4 P5 N5 P6 N6
C-71 20 30 40 55 60 - - 95 110 120 130 160 185
C-74 20 32 45 - 55 60 78 92 104 115 125 145 -
C-75 20 30 40 50 60 65 78 95 108 115 125 160 -
C-78 18 25 38 50 60 75 86 92 110 125 140 160 190
C-80 20 34 45 50 55 68 85 90 95 110 115 - -
L3 C-82 20 35 45 50 60 - - - - - - - -
C-83 20 32 50 55 65 75 80 95 105 120 130 140 150
C-86 20 35 50 57 70 75 85 100 117 125 145 157 165
C-87 20 30 42 47 57 68 75 90 105 - - - -
C-88 20 38 55 58 - - 80 92 100 120 130 - -
C-91 20 30 52 65 68 72 80 85 90 105 120 - -
AVE I 19.8 31.9 45.6 53.7 61.0 69.8 80.7 92.6 104.4 117.2 128.8 153.7 172.5
( ±)A0.05 0.3 2.1 3.4 6.6 3.7 4.7 3.0 2.9 5.7 5.2 7.2 8.7 30.1
C-79 20 35 50 - - 75 90 - 100 - - - -
C-80 20 35 50 - 55 75 80 90 100 - - - -
C-81 15 30 40 55 75 - - 80 110 125 - - -
L2 C-84 20 35 45 55 70 - - 95 105 - - - -
C-86 20 30 50 55 70 75 85 100 115 125 135 - -
C-91 20 30 50 65 70 80 90 95 100 110 125 - -
AVE 19.2 32.5 47,5 57.5 68.0 76.2 86.2 92.0 105.0 120.0 130.0
(± )Ao.05 2.2 2.8 4.4 14.6 9.4 4.1 8.9 9.4 6.7 21.9
C-79 20 35 50 63 68 75 - - - - - -
C-81 20 30 43 55 65 68 75 85 100 - - - -
C-93 20 33 50 53 70 - - 88 - - - - -
Li C-84 15 28 53 - - - - - - - - - -
C-85 23 32 45 57 68 - - - - - - - -
C-87 15 28 40 45 50 63 70 83 95 - - - -
C-91 20 32 52 - - - - 84 90 95 100 - -
AVE 19.0 31.1 47.6 54.6 65.2 68.7 72.5 85.0 95.0
(±)Ao.05 2.8 5.9 4.6 7.8 7.2 12.6 3.51 3.5 12.5
On-L P1 N1 P2 N2 P3 N3 P4 N4 P5 N5 P6 N6
C-71 15 35 45 - - 75 - - 105 - - - -
C-76 20 32 50 65 80 90 100 - - - - - -
C-73 20 40 - - 80 - - - - - - - -
C-78 20 32 45 65 100 - - - - - -
SS3 C-79 20 35 55 - - 75 - -- 108 - - - -
C-86 15 35 50 60 70 76 85 100 120 125 145 - -
C-88 20 35 62 65 75 80 100 - - 125 140 - -
C-91 2'0 30 45 60 70 82 90 105 117 - - - -
AVE 18.8 34.2 50.2 63.0 75.0 79.6 95.0 112.5 125.0 142.5
( ± )A0 .05 2.0 2.5 6.0 3.3 6.2 5.8 6.3 10.2
C-80 20 35 45 - - 75 80 90 100 - - - -
C-81 20 30 40 50 55 60 80 95 110 - - - -
SS2 C-83 20 35 50 55 70 - - 95 100 115 135 - -
C-84 20 30 45 55 70 - - 95 105 - - - -
C-86 20 35 55 60 75 80 85 105 120 130 150 - -
AVE 20.0 33.0 47.0 55.0 67.5 71.7 81.7 96.0 107.0 122.5 142.5
( ±) Ao.05 3.3 7.2 6.4 14.0 26.2 7.3 6.8 10.4
(2) Peak to peak amplitude (ILV)
P1 P1 N1 P2 P2N2 P3 P3N3 P4 P4N4 P5 P5N5 P6 P6N6
C-71 300 212 100 112 62 - 50 50 75 25 200 100
C-74 68 156 - 43 31 37 63 25 25 6 94 -
C-L5 83 133 78 50 11 11 100 61 38 16 38 -
C-78 80 115 45 10 45 10 35 35 50 35 10 45
C-80 55 45 10 10 15 30 15 15 20 5 - -
L3 C-82 17 83 5 22 - 22 - - - - - -
C-83 56 175 25 50 12 10 43 50 31 50 18 18
C-86 62 112 25 56 25 12 118 75 37 50 37 25
C-87 56 81 12 50 43 - 25 18 - - - -
C-88 50 125 - - - 87 21 18 75 31 - -
C-91 44 133 50 6 17 15 15 16 16 22 - -
AVE 79.2 124.5 39.0 40.9 29.0 26.0 48.5 36.3 40.7 26.7 66.1 47.0
(~ )A0 .0 5 46.5 28.6 25.2 25.9 13.7 19.2 26.9 15.9 16.9 13.7 71.2 60.4
C-79 6 50 18 12 12 - - - - - - -
C-81 70 115 40 40 20 30 15 40 - - - -
C-83 25 62 6 18 - - 18 - - - - -
L 1 C-84 36 50 - - - - - - - - - -
C-85 21 50 14 14 - - - - - - - -
C-87 68 75 6 38 55 25 13 13 - - -
C-91 93 137 - - - - 25 43 13 20 - -
AVE 45.5 77.0 16.8 24.4 29.0 27.5 17.7 32.0
Table 2. Onset and peak latencies and peak to peak amplitudes of each response component in the visually evoked potential elicited by contrala- teral flash in the lateral (L3, L2, Li) and lateral suprasylvian gyri (SS3, SS2)
(1) Onset and peak latencies, (msec) On-L: Onset latency.
AVE: Average
L0-05: Fiducial interval under 0.95.
(2) Peak to peak amplitude (,uV)
Within 150 msec after flashing light stimulus, five diphasic defle- ctions time-locked to the stimulus were observed. In the VEP led from the caudal portion of the lateral gyrus (L,) of seven cats, res- ponse P2 and later responses seemed to be smaller in size (Table 2) than those led from the anterior and midlateral gyrus, L3 and L2.
Hardly any of the cats produced P5 and N5. On the other hand, VEPs in the lateral suprasylvian gyrus SS, and SS2 , association area, mani- fested five diphasic deflections.
Peak-to-peak amplitudes, which were classified into five groups, and the onset and peak latencies of every deflection of VEP in each animal area are depicted in Fig-8. It was shown that each response component of the VEP in L, is smaller in amplitude than those in other regions (visual area L,, L2 and association areas SS3, SS2) . P, and N, were stable in their peak latencies with individual variation of 10-15 msec, and the peak-to-peak amplitudes P, N, were highest foll- owed by the amplitude of the initial positive deflection P1. Individual
variations of the peak latencies of P2 and those of later response com- ponents were large, being more than 20 msec, which suggests that they are less rigidly time locked to the flash stimulus.
Though there were differences between animals, the peak-to-peak
Fig. 8. Peak latencies and amplitudes of each response component in the visually evoked potential of lateral gyrus and lateral suprasylyian gyrus.
Black and white circles: negative and positive deflections, respectively. Ampli- tude of each component is classified into five classes: over 100, 75-100, 50-75, 25-50, and below 25pV, respectively. The higher the potential, the larger is the circle.
amplitudes of all response components and the average schematic wave form in the mid-lateral gyrusL3, posterior lateral gyrus L1 , and lateral suprasylvian gyrus, SS,, are illustrated in Fig. 9, wherein the averages for L1 , L3 and SS3 were obtained, respectively, from seven, eleven and eight cats. Comparison of the representaive wave form of VEP obtained from SS3 with that from L3 shown in Table 2 and Fig.9, verified that the mean peak latencies of all deflections observed in SS,, such as P1 , N1 , P2 , N2 , P3 , N3 , P4 and N4 , were longer than the corres- ponding ones in L3. However, statistically significant differences were found only in the peak latencies of P2,N2 and N3 deflections.
One reason may have been the small number of VEP sampled to obtain the average because of which the fiducial intervals of the latencies were too broad to verify significant differences. Average amplitudes of deflections of the initial positive k-,, P1 N1 and P2 in SS3 seemed to be considerably lower than those in L,, whereas those of P,, P3N3 ,P4 and P4 N4 , etc. in SS3 were considerably higher than those in L3 , al- though not sigificant statistically.
In Fig. 10, the configurations of VEPs until 1000 msec after the
Fig. 9. Peak-to-peak amplitudes of response components and average wave forms of visually evoked potentials in the lateral and lateral suprasylvian gyri.
Top: Peak-to-peak amplitude. Dotted (left), shaded (middle) and clear (right) bars correspond to components L3, L1 and SS3, respectively.
Bottom: Average wave form. Bold line; L3. Broken line; L1. Dotted line; SS3.
Vertical and horizontal lines indicate variation in peak-to-peak amplitudes and peak latencies, respectively, at fiducial interval of 0.95. See text.
flash stimulus are depicted for six cats. All deflections within 130 msec
after the stimulus were similar in latencies among the animals. There-
after, slow positive (Fig. 10, C71, 74 and 75) and negative waves with
peak latencies of about 150 and 200 msec were raised in some animals
(Fig. 10, C74 and 75). This later diphasic wave was followed by some
slow waves, which varied between animals. Although considerable
variation was observed in the time configuration of VEPs, they were
classified in into the following four types (Fig. 11). Type I: the initial
and next diphasic deflections, PIN, and P2N2, are considerably high,
while the following diphasic deflections P3N3, P4 N4 , etc. are not so
high. Type II: the initial diphasic deflection P1N1 is followed by a
prominent slow negative swell of about 70 msec duration, onto which
P2N2, P3N3 are superimposed, and the succeeding positive trough P4
shows a considerably marked swing so that N3P4 is prominent. Type
III: the primary positive response P1 is relatively low, and N,, P2N2 ,
P3N3 , etc. are superimposed on a slow negative wave of about 150
Fig. 11. Types of wave forms in VEP of 200 msec
obtained from the primary visual area (L3)
Fig 10. VEPs over a length of 1000 msec after contralateral monocular flash stimulus obtained
from the primary visual area (L3).
Each VEP was obtained by thirty times
summation. Bottom: Superimposition of six VEPs depicted in the above.
msec duration. Type IV: all diphasic deflections P1 N1 , P2 N2 , P3 N3 , etc. are superimposed on a slow positive downward wave.
2). Effects of GL destruction on VEP.
In case of almost destruction of GL (Fig. 2A), not only was the
inital positive-negative response P1 N1 in the lateral and lateral supra-
sylvian gyri (L3 and SS2 in Fig. 12) wiped out, but the later diphasic
responses P2N2, •••, P5N5 were also almost completely deteriorated after
destruction. In place of these missing responses, a slow negative
response of 70 msec peak latency appeared lasting for 120 cosec. In contrast to this, when, in stead of complete GL destruction, only par- tial damage had been inflicted upon the dorsolateral portion of GL (Fig. 4A), no change was observed in the initial positive response P1 , but almost all of the later responses were depressed in the VEP eli-
.