Introduction
Liver cancer causes 115,300 cancer deaths annually in developed countries[1], and ranks as the 5
thleading cause of cancer death in Japan. In 2016, 42,800 new cases of liver cancer were diagnosed, and 26,000 patients died from this disease in 2018 in Japan[2].
There are three main types of liver cancer: hepatocellular carcinoma (HCC), bile duct carcinoma, and mixed-type HCC. HCC accounts for the majority of primary liver cancer cases (70-90%).
The prognosis of HCC remains poor, with 5-year survival
rates ranging between 12 and 23%[3], and life expectancy is difficult to predict because of various factors, such as alpha- fetoprotein (AFP) levels, prothrombin induced by vitamin K absence-II (PIVKA-II) levels, portal vein thrombosis, the tumor stage, and the high recurrence of tumors. Approximately 75% of patients with HCC have AFP levels higher than 10 µg/L[4]. Previous studies identified serum AFP as an important indicator of postoperative HCC recurrence and metastasis[5], and high serum AFP levels have been associated with larger tumors, bilobar involvement, massive or diffuse-type tumors, and portal vein thrombus[6]. PIVKA-II is another serum marker used in the surveillance of at-risk patients and the
MS#AMN 07267
Association of FDG PET/CT-derived parameters with tumor markers and survival rate in Hepatocellular carcinoma
Altay M
yssAyev1; Ayan M
yssAyev2; Reiko I
deguchI3; Takashi K
udo31 Department of Radioisotope Medicine, Nagasaki University, Graduate School of Biomedical Sciences, Nagasaki, Japan
2 Department of Innovative Education, Semey Medical University, Semey, Republic of Kazakhstan
3 Department of Radioisotope Medicine, Nagasaki University Graduate School of Biomedical Sciences, Nagasaki, Japan
Background. Hepatocellular carcinoma (HCC) is one of the leading causes of cancer-related deaths worldwide. The progno- sis of patients with HCC is generally poor, and life expectancy is difficult to predict because of various factors. The purpose of the present study was to investigate the relationships between FDG PET parameters and other parameters that may influence the prognosis of patients with HCC.
Materials and methods. We conducted a retrospective study on 26 patients who underwent dual-time-point FDG PET imag- ing before treatment between June 2010 and April 2016 at Nagasaki University Hospital. The SUVmax, SUVpeak, TLG, and MTV of tumors and the SUVmean of the liver were assessed on PET images using Metavol software. All statistical analyses were performed using JMP Pro11 software. P-values of <0.05 were considered to be significant.
Results. Log AFP and log PIVKA II showed strong relationships between many FDG parameters. Several types of therapy performed before the introduction of FDG PET showed some relationships but few for FDG parameters. Relationships be- tween AFP, PIVKA II, and therapy were only found between log AFP and the number of transarterial chemoembolizations. The results of the event-free survival analysis showed that patients with larger tumors on PET images had a poorer prognosis.
Conclusion. Relationships were observed between FDG PET parameters and AFP and PIVKA II levels, which affect patient prognoses. Based on the present results and previous findings, the combination of FDG parameters with serum AFP and PIVKA II levels may be useful for predicting the outcomes of patients with HCC.
ACTA MEDICA NAGASAKIENSIA 64: 81−90, 2021 Key words: PET; FDG; hepatocellular carcinoma; AFP; PIVKA-II; FDG PET/CT
Address correspondence:
Takashi Kudo E-mail: [email protected]Received October 5, 2020; Accepted November 2, 2020
diagnosis of HCC, including the early stages[7–9]. According to the recommendations of the Clinical Practice Guidelines, the combination of AFP and PIVKA-II is currently used in Japan to diagnose HCC.
The prognosis of patients with HCC is generally poor and life expectancy is difficult to predict. Therefore, the accurate imaging of HCC is important. Only patients with small tumors and no extrahepatic metastases are potentially curable.
Widely accepted imaging modalities to stage HCC are computed tomography (CT) and contrast-enhanced magnetic resonance imaging (MRI). However, CT and MRI have limited abilities to detect distant metastasis. Previous studies reported the role of
18F-fluorodeoxyglucose positron emission tomography/computed tomography (
18F-FDG-PET/CT) in the detection of gastrointestinal malignancies, such as gastric cancer, pancreatic cancer, and liver cancer[10–12]. Further- more,
18F-FDG-PET/CT is a useful diagnostic tool for evalu- ating extrahepatic metastasis[13]. However, the sensitivity of
18
F-FDG PET for detecting intrahepatic HCC is low[14,15].
The usefulness of dual-time-point
18F-FDG PET/CT for differentiating between benign and malignant lesions has been demonstrated[16–19], and dual-time PET/CT was recently shown to be advantageous for the diagnosis of HCC[20].
FDG PET/CT-derived parameters, such as standardized uptake values (SUV), metabolic tumor volume (MTV), and total lesion glycolysis (TLG), were recently proposed as prognostic factors for various tumors[21–23].
The purpose of the present study was to investigate rela- tionships between FDG PET parameters and other parameters that may influence the prognosis of patients with HCC.
Materials and methods Patients
We conducted a retrospective study on 26 patients with HCC who underwent dual-time-point FDG PET imaging before treatment between June 2010 and April 2016 at Naga- saki University Hospital. There were 26 patients (20 males and 6 females) with a mean age of 71.5 years. Twelve (46.2%) patients had HCV infection, 7 (26.9%) HBV infection, and 7 (26.9%) alcoholic liver disease.
Prior to FDG PET, nine patients had history of surgical resection (34.6%), 5 (19.2%) transarterial embolization (TAE), 5 (19.2%) transarterial chemoembolization (TACE), 4 (15.3%) radiofrequency ablation (RFA), 1 (3.8%) transcatheter arterial infusion (TAI), and 1 (3.8%) percutaneous ethanol injection (PEI). Eight patients did not receive any treatment before FDG PET/CT imaging, while some patients received several
different types of therapy, such as RFA twice and TACE once.
All patients who had biopsy-proven HCC and underwent dual-time-point FDG PET examinations 1 hour (early) and 2 hours (delayed) after the injection at our hospital were included in the present study. This study was approved by the Ethics committee of Nagasaki University Hospital (approved number: 17012308).
PET/CT protocol
18
F-FDG PET was performed using a PET scanner (Siemens mCT, Germany). All patients were instructed to refrain from consuming food and sweet drinks at least 5 hours before the scan. Early PET/CT imaging was performed 1 hour after the intravenous injection of approximately 200~300 MBq of FDG. Patients were scanned from the middle of the thigh to the top of the skull. Delayed scanning was conducted approximately 2 hours after the
18F-FDG injection and images were acquired from the upper abdominal cavity only.
Images were reconstructed using the ordered subset expectation maximization algorithm and the following parameters: 200×200 matrix, field of view: 815 mm, two iterations, 24 subsets, and a 6-mm Gaussian filter.
FDG-PET parameters
Some PET-related parameters are indicative of tumor
activity. PET images are generally converted to standardized
uptake values (SUV). SUV are calculated as the tissue activity
concentration (Bq/ml) multiplied by body weight (g) divided
by the injected dose (Bq); therefore, they account for inter-
individual differences in body mass and the injected tracer
dose. Numerous parameters may be calculated based on
SUV. The SUVmax of a tumor is defined as the maximum
uptake value among all voxels. The SUVpeak of a tumor is
defined as the average SUV for a 1-cm
3spherical volume
around the SUVmax and aims to minimize fluctuations in
measured activity caused by poor signal/noise ratios, which
may affect SUVmax. The mean SUV (SUVmean) of the liver
(as a normal organ) is used to calculate the tumor background
ratio (TBR), which is defined as the ratio of the SUVmax of
a lesion to the SUVmean of the liver (background). Further-
more, a number of volumetric parameters may be obtained
from FDG PET images. For example, the metabolic tumor
volume (MTV; cm
3) is defined as the volume of a tumor that
exhibits FDG uptake. In contrast to SUVmax, which represents
the maximum single-voxel FDG uptake value of a tumor,
MTV quantifies the overall tumor burden. In addition, total
lesion glycolysis (TLG; g) may be calculated using the
following formula: the SUVmean of a tumor × MTV.
HCC parameters
HCC parameters were extracted from the disease history of each patient. AFP and PIVKA-II levels were measured 1 month before imaging, the duration of the follow-up, the type of therapy (such as transarterial embolization (TAE), transarterial chemoembolization (TACE), radiofrequency ablation (RFA), and surgery), and the number of therapies received before FDG PET/CT imaging were recorded.
Image analysis
All FDG PET images were extracted from the electronic archival system at Nagasaki University Hospital and were visually inspected. In each case, a semi-quantitative evaluation was performed after the visual qualitative identification of the primary lesion. The SUVmax, SUVpeak, TLG, and MTV of the tumor and the SUVmean of the liver were evaluated on PET images using Metavol software[24].
To assess SUVmax, the spherical volume of interest (VOI), which included the entire lesion in the axial, sagittal, and coronal planes, was examined. CT images were used to ensure that the
18F-FDG uptake of normal organs, such as the bowel and stomach, was not included in VOI. The following PET-related parameters were measured: the SUVmax of the tumor, which was defined as SUV for the point that exhibited the greatest tracer uptake (the hottest voxel); the SUVpeak of the tumor, defined as the average SUV within a 1-cm
3spherical volume around SUVmax; the SUVmean of the liver (as a normal organ); MTV, defined as the volume of the tumor that exhibited FDG uptake; and TBR, defined as the ratio of the SUVmax of the tumor to the SUVmean of the liver (background). Tumors were delineated to assess tumor volumes. To achieve this, tumor images were segmented using the fixed-threshold method, and an SUVmax threshold value of ≥2.5, as recommended in many previous studies due to its simplicity and objectivity, was used to identify tumors[25–28].
TLG was calculated as follows: the SUVmean of a tumor × MTV.
We also determined visibility of tumor on FDG PET and measured its size. Visibility of FDG PET was reviewed by two observers (MY and TK) separately and determined as
"with uptake" when FDG uptake was visible on PET only display of FDG PET/CT images. Tumor size on PET image and on CT image was measured on PET only display and CT only display of FDG PET/CT data, and longest axis length was determined as tumor size. When contrast-enhanced CT within one month was available, that image was also used as a reference for the CT size measurement. In case of discrepancy, the reviewers reached a consensus with discussion.
Statistical analysis
All statistical analyses were performed using JMP Pro11 software. All quantitative data are presented as median values with ranges, unless otherwise noted. Log transformation was used on AFP and PIVKA-II levels to account for the large range of values among the groups for both markers. Wilcoxon test was employed to compare continuous variables, and ANOVA test was performed to compare categorical variables.
A Kaplan-Meier survival analysis was performed to calculate the Event-free survival (EFS). P-values of <0.05 were considered to be significant.
Outcome definitions. Event-free survival was defined as the period from the date of the initiation of chemotherapy until evidence of an EFS event (progressive disease, death, or diagnosis of a second tumor) or last contact, whichever occurred first.
Results
Patient characteristics
The subjectsʼ characteristics are listed in Table 1.
The measured MTV was 0.0 cm3 in 16 patients because the tumor SUV max was less than the threshold value of
≥2.5.
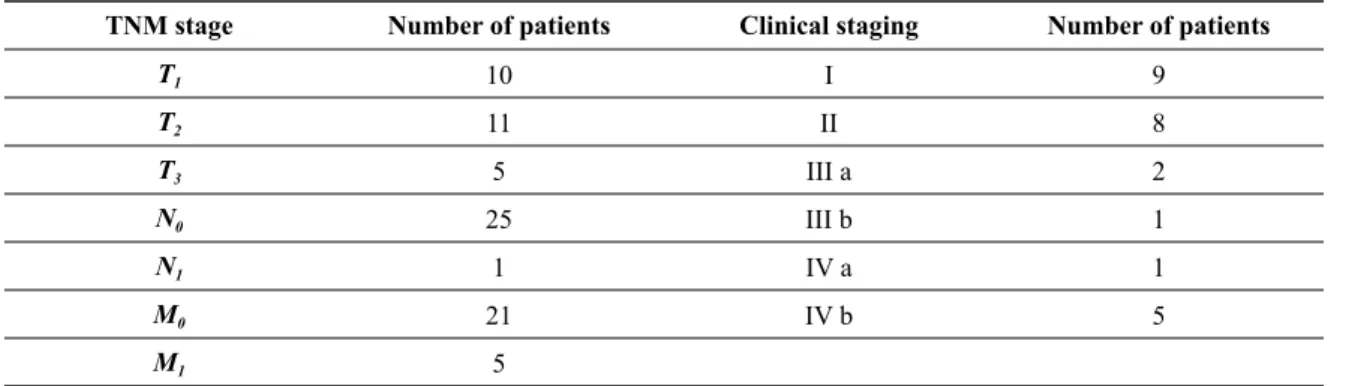
The distribution of TNM staging is presented in Table 2.
The results of statistical analyses of the relationships between FDG PET/CT parameters and HCC parameters are listed in Tables 3-6.
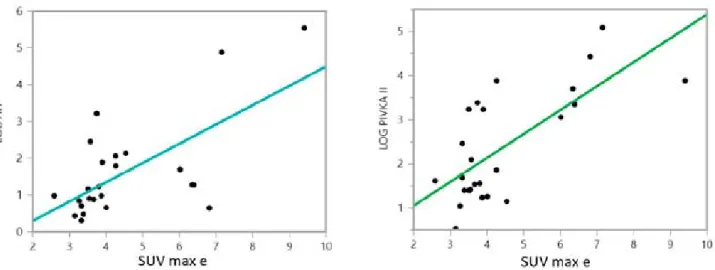
Relationship between SUV max-early and log AFP and log PIVKA-II presented on Figure 1.
Table 3 summarizes relationship between FDG PET/CT parameters and AFP, PIVKA II. Log AFP and log PIVKA II showed strong relationships between most of FDG parameters:
SUV max (P=0.0004 and P=0.0001, respectively), SUV peak (P=0.0189 and P=0.0179, respectively) and TBR (P=0.0002 and P=0.0002, respectively).
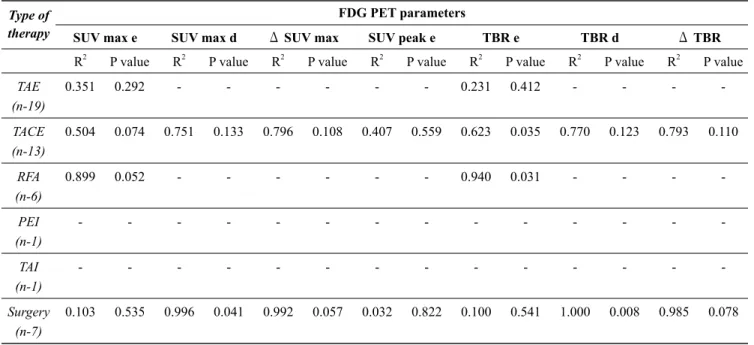
Table 4 and 5 summarizes relationship between number of the several types of therapies performed prior to FDG PET and FDG PET/CT parameters, AFP, PIVKA II. Numbers of several types of therapy performed before the introduction of FDG PET showed some relationships but few of FDG parameters: TBR e and TACE (P=0.031), RFA (P=0.031), ΔTBR and surgery (P=0.078). Relationships between AFP, PIVKA II, and number of therapies were only found between log AFP and the number of TACE (P=0.0125).
Table 6 summarizes relationship between total number of therapies and parameters of FDG PET/CT, AFP, PIVKA II.
Significant correlation was only found betweenΔTLG and
number of therapies (P=0.0207).
In the event-free survival analysis, patients were separated into those with and without PET uptake based on a visual inspection. Patients were also divided (into two even num- ber groups) according to tumor sizes on PET images (small
tumor size; large tumor size) and CT images (small tumor size; large tumor size).
The results of the event-free survival analysis revealed that patients with larger tumors on PET images had a poorer prognosis (Figure 2).
Table 1. Patient characteristics.
Parameters
Age (mean, range) Total (n=26)
71.5 (53-88)
Gender (M:F) 20:6
SUVmax-early (median, range) 5.27 (2.58-25.65) SUVmax-delay (median, range) 5.21 (2.41-33.22) SUVpeak-early (median, range) 6.63 (2.7-23.3) SUVpeak-delay (median, range) 6.48 (2.35-29.58)
TBR-early (median, range) 2.02 (1.04-8.53)
TBR-delay (median, range) 2.22 (1.15-12.76)
MTV-early (cm3) (median, range) 103.44 (1.84-750.78) MTV-delay (cm3) (median, range) 25.42 (0.19-115.85)
TLG-early (g) (median, range) 448.69 (4.93-2927.31) TLG-delay (g) (median, range) 163.1 (0.53-1086.78) Follow-up (months) (mean, range) 33.3 (1-144) Alpha-fetoprotein (ug/L) (median, range) 17509.59 (2-346217)
PIVKA-II (ug/L) (median, range) 6884.05 (3.4-122044)
*SUV, standardized uptake value; SUVmax, maximum uptake value among all voxels; SUVpeak, average SUV for a 1-cm3 spherical volume around the SUVmax; TBR, tumor background ratio; MTV, metabolic tumor volume; TLG, total lesion glycolysis.
Table 2. Distribution of TNM and clinical staging.
TNM stage Number of patients Clinical staging Number of patients
T1 10 I 9
T2 11 II 8
T3 5 III a 2
N0 25 III b 1
N1 1 IV a 1
M0 21 IV b 5
M1 5
Table 3. Relationships between FDG PET parameters and HCC parameters (p-value).
FDG PET parameters Hepatocellular carcinoma parameters
Log AFP Log PIVKA-II
R2 P value R2 P value
SUV max e 0.4323 0.0004 0.5082 0.0001
SUV max d 0.3880 0.0033 0.4346 0.0016
ΔSUV max 0.3682 0.0046 0.0490 0.3482
SUV peak e 0.5684 0.0189 0.5749 0.0179
SUV peak d 0.5902 0.0156 0.8531 0.0004
ΔSUV peak 0.9478 0.0051 0.3724 0.2744
TBR e 0.4591 0.0002 0.4565 0.0002
TBR d 0.3395 0.0070 0.4258 0.0018
ΔTBR 0.3562 0.0055 0.1639 0.0766
*SUV, standardized uptake value; SUVmax, maximum uptake value among all voxels; SUVpeak, average SUV for a 1-cm3 spherical volume around the SUVmax; TBR, tumor background ratio.
Table 4. Relationships between FDG PET parameters and the number of several types of therapies performed prior to FDG PET (p-value).
(Correlation between SUVpeak d and ΔSUV peak are not available due to limited case numbers.) Type of
therapy
FDG PET parameters
SUV max e SUV max d ΔSUV max SUV peak e TBR e TBR d ΔTBR
R2 P value R2 P value R2 P value R2 P value R2 P value R2 P value R2 P value TAE
(n-19)
0.351 0.292 - - - 0.231 0.412 - - - -
TACE (n-13)
0.504 0.074 0.751 0.133 0.796 0.108 0.407 0.559 0.623 0.035 0.770 0.123 0.793 0.110
RFA (n-6)
0.899 0.052 - - - 0.940 0.031 - - - -
PEI (n-1)
- - - -
TAI (n-1)
- - - -
Surgery (n-7)
0.103 0.535 0.996 0.041 0.992 0.057 0.032 0.822 0.100 0.541 1.000 0.008 0.985 0.078
*SUV, standardized uptake value; SUVmax, maximum uptake value among all voxels; SUVpeak, average SUV for a 1-cm3 spherical volume around the SUVmax; TBR, tumor background ratio; TAE, transarterial embolization; TACE, transarterial chemoembolization; RFA, radiofrequency ablation; PEI, percutaneous ethanol injection; TAI, transcatheter arterial infusion.
Figure 1
Table 5. Relationships between hepatocellular carcinoma parameters and the number of several types of therapies performed prior to FDG PET (p-value).
Type of therapy Hepatocellular carcinoma parameters
Log AFP Log PIVKA II
R2 P value R2 P value
TAE (n-19) 0.0350 0.7632 0.0967 0.6104
TACE (n-13) 0.7435 0.0125 0.3776 0.1420
RFA (n-6) 0.3797 0.3838 0.7376 0.1411
PEI (n-1) - -
TAI (n-1) - -
Surgery (n-7) 0.2412 0.3225 0.4971 0.1176
*TAE, transarterial embolization; TACE, transarterial chemoembolization; RFA, radiofrequency ablation; PEI, percutaneous ethanol injection; TAI, transcatheter arterial infusion.
Figure 1. Relationship between FDG uptake and AFP, PIVKA-II.
*SUV, standardized uptake value; SUVmax early, maximum uptake value among all voxels in early image.
Figure 2. Outcomes of hepatocellular carcinoma cases: event-free survival and distribution by HCC parameters (a – grouped by PET uptake; b– grouped by size on PET images; c – grouped by size on CT images).
Figure 2
Table 6. Relationships between FDG PET parameters/hepatocellular carcinoma parameters and treatments number (sum all types of therapies) before FDG PET (p-value).
FDG PET parameters/
HCC parameters
Treatment Number of therapy
R2 P value
SUV max e 0.0322 0.4009
SUV max d 0.0473 0.3708
ΔSUV max 0.1137 0.1579
SUV peak e 0.0709 0.4884
SUV peak d 0.0135 0.7653
ΔSUV peak 0.6208 0.1134
TBR e 0.0424 0.3342
TBR d 0.0527 0.3441
ΔTBR 0.0938 0.2022
TLG e 0.1339 0.3327
TLG d 0.0292 0.6599
ΔTLG 0.8701 0.0207
MTV e 0.1281 0.3442
MTV d 0.0555 0.5415
Log AFP 0.1212 0.0954
Log PIVKA-II 0.0059 0.7202
*SUV, standardized uptake value; SUVmax, maximum uptake value among all voxels; SUVpeak, average SUV for a 1-cm3 spherical volume around the SUVmax; TBR, tumor background ratio;
MTV, metabolic tumor volume; TLG, total lesion glycolysis.
Discussion
The present results showed that high FDG uptake correlated with the tumor burden, such as high AFP and PIVKA-II levels.
Previous studies reported that high serum AFP and PIVKA- II levels correlated with the poor prognosis (larger tumor size, more aggressive tumor characteristics, metastasis, and recurrence) of patients with HCC[5–7,29,30].
AFP is a major plasma protein produced by the yolk sac and fetal liver during fetal development. It is regarded as a fetal analog of serum albumin. Serum AFP levels are very low in adults. AFP is currently used as a tumor marker for the diagnosis of HCC. However, it may be high in some non- cancerous liver diseases and low in some patients with HCC[31,32]. Serum AFP levels are not only of diagnostic value, but also prognostic value in patients with HCC.
PIVKA-II is another serum marker that is used in the sur- veillance of at-risk patients and the diagnosis of HCC,
including the early stages[7–9]. PIVKA-II levels in the blood are elevated in patients with HCC. Previous studies demon- strated that it is more sensitive than AFP for differentiating HCC at all stages from cirrhosis or chronic hepatitis[7,29,30].
In the present study, PIVKA-II levels were associated with tumor sizes on PET and CT images. Since the event-free survival analysis showed that patients with larger tumors on PET images had a poorer prognosis, the present results appear to support previous findings. The sensitivity of the combined measurement of PIVKA-II and AFP levels ranged between 47.5 and 94%, with a specificity of between 53.3 and 98.5%
in the early diagnosis of HCC, and these values were superior to those for either marker alone[33].
FDG PET is a nuclear imaging technique that detects
proliferating tumors based on their increased uptake and
metabolism of glucose. Tumor cells generally exhibit strong
glycolytic activity. Since
18F-FDG is a radiolabeled analog
of glucose,
18F-FDG PET reveals tumors by highlighting
areas of elevated glycolytic activity in vivo, which allows for the 3D visualization of glucose metabolism.
18F-FDG PET has the advantage of providing scans of the whole body in one session, which allows for initial staging and reveals any distant metastasis or nodal involvement. Furthermore,
18
F-FDG PET detects tumors earlier than conventional imaging techniques and may be used to evaluate tumor aggressiveness and predict prognosis. The uptake of FDG has been shown to correlate with tumor activity and growth. Therefore, high FDG uptake correlates with a poor prognosis. The present results are consistent with these findings.
Since there are many FDG/PET CT-derived parameters, there may be confusion among clinicians regarded the most appropriate parameters to use. Metabolic FDG PET/CT- derived parameters, such as SUV-based parameters and vol- umetric parameters, including MTV and TLG, have been proposed as prognostic factors for various tumors[12,21–23].
However, the use of volumetric parameters in the present study was limited because of the difficulties associated with defining the tumor margin in some HCC due to the low uptake of FDG.
Cho et al.[34] reported a strong correlation between the tumor and background ratio and factors associated with the biological behavior of HCC, which may be used as a predictive factor for overall survival. However, all patients in the present study had chronic hepatitis or alcoholic liver cirrhosis, both of which alter
18F-FDG uptake. Therefore, background liver uptake may also be affected, and increased uptake by liver tumors may be masked by background liver hepatitis or liver cirrhosis. In the present study, increased TBR correlated with a more aggressive tumor burden characterized by higher AFP and PIVKA-II levels.
Therapeutic interventions may also influence FDG PET parameters; however, only an equivocal relationship was noted in the present study.
Increased FDG uptake in HCC patients reflects the ag- gressive biological activity of tumors and is associated with poor survival. Therefore, patients with high FDG uptake may respond poorly to treatment[35,36]. In a previous study by Kim et al.[37], a patient group with high SUV showed a significantly stronger objective tumor response than a patient group with low SUV. Despite the strong tumor response, patients with high SUV had worse overall survival due to the
occurrence of distant metastasis. Strongly proliferating tumors are radiosensitive, and HCC with high FDG uptake are considered to respond better to radiotherapy than those with low uptake[37]. However, HCC with high FDG uptake also have a high risk of early recurrence and distant metastasis [38,39]. Therefore, viable tumor cells in residual lesions after radiotherapy may spread more rapidly and frequently to extrahepatic organs, resulting in worse overall survival[40].
Collectively, these findings indicate that HCC have different responses to treatment based on the degree of FDG uptake.
Multiple treatments, including radiotherapy, may be more effective for tumor control in patients with high FDG uptake, while HCC with low FDG uptake were affected less by the treatment modality. HCC with low and high FDG uptakes have different tumor characteristics, genetic dispositions, and recurrence rates; therefore, different treatment strategies may need to be employed based on the findings of FDG uptake in these patients.
The present study has several limitations. FDG PET/CT images and patient follow-up data were retrospectively ana- lyzed. Furthermore, the number of patients with HCC was small, which may have limited our conclusions. In addition, the number of HCC cases for each type of treatment modality was small, except for surgery, which showed a correlation.
Another limitation is that VOI were drawn and analyzed by two radiologists based on a consensus approach. We did not assess inter- or intraobserver variabilities in the placement of VOI or its effects on the results obtained. Moreover, MTV and TLG were calculated as the 2.5 SUVmax threshold value, which may potentially underestimate these parameters in some HCC patients. PET imaging with alternative radiotracers may be useful for HCC with low FDG uptake.
Conclusion
In the present study, relationships were observed between
FDG PET parameters and AFP and PIVKA II levels, which
affect the prognosis of patients with HCC. Based on the
present results and previous findings, FDG parameters in
combination with serum AFP and PIVKA II levels may be
useful for predicting the outcomes of patients with HCC.
References
1. Jemal A, Bray F, Center MM, Ferlay J, Ward E, Forman D. Global cancer statistics. CA Cancer J Clin. 2011;61: 69–90. doi:10.3322/
caac.20107
2. Statistics C. CANCER STATISTICS IN JAPAN 2019 [Internet]. Center for Cancer Control and Information Services. National Cancer Center [cited 2020 Apr 26]. Available from https://ganjoho.jp/en/professional/
statistics/brochure/2019_en.html. 2019. Available: https://ganjoho.jp/
en/professional/statistics/brochure/2019_en.html
3. Alterkruse SF, McGlynn KA DL et al. Hepatocellular carcinoma confirmation, treatment, and survival in surveillance, epidemiology, and end results registries. Hepatology. 2012;55: 476–482.
4. PJ J. Role of alpha-fetoprotein in the diagnosis and management of hepatocellular carcinoma. J Gastroenterol Hepatol. 1999;14: 32–36.
5. Chang SK, Hlaing WW, Yu RQ, Lee TW GI et al. Value of alpha- fetoprotein for screening of recurrence in hepatocellular carcinoma post resection. Singapore Med J. 2012;53: 32–35.
6. Tangkijvanich P, Anukulkarnkusol N, Suwangool P, Lertmaharit S HO et al. Clinical characteristics and prognosis of hepatocellular carcinoma:
analysis based on serum alpha-fetoprotein levels. J Clin Gastroenterol.
2000;31: 302–308.
7. Liebman HA, Furie BC, Tong MJ, Blanchard RA, Lo KJ et al. Des- gamma-carboxy (abnormal) prothrombin as a serum marker of hepatocellular carcinoma. N Engl J Med. 1984;310: 1427–1431.
8. Inagaki Y, Xu HL, Hasegawa K, Aoki T, Beck Y et al. Des-gamma- carboxyprothrombin in patients with hepatocellular carcinoma and liver cirrhosis. J Dig Dis. 2011;29: 339–364.
9. Albuquerque M, Paradis V, Voitot H, Bedossa P, Poté N, Belghiti J, et al.
Performance of PIVKA-II for early hepatocellular carcinoma diagnosis and prediction of microvascular invasion. J Hepatol. 2014;62: 848–854.
doi:10.1016/j.jhep.2014.11.005
10. Donswijk ML, Hess S MT et al. [18F]Fluorodeoxyglucose PET/combined tomography in gastrointestinal malignancies. PET Clin. 2014;9: 421–441.
11. Gauthe M, Richard-Molard M CW et al. Role of fluorine 18 fluorode- oxyglucose positron emission tomography/computed tomography in gastrointestinal cancers. Dig Liver Dis. 2015;47: 443–454.
12. Myssayev, Altay, Kudo, Takashi, Myssayev, Ayan, Uetani M, Tobinaga S, Sumida Y, Eguchi S, Ideguchi R, Adachi T. Usefulness of FDG PET/
CT derived parameters in prediction of histopathological finding during the surgery in patients with pancreatic adenocarcinoma. PLoS One.
2019;14: e0210178. doi:10.1371/journal.pone.0210178
13. Sugiyama M, Sakahara H TT et al. 18F-FDG PET in the detection of extrahepatic metastases from hepatocellular carcinoma. J Gastroenterol.
2004;39: 961–968.
14. Trojan J, Schroeder O RJ et al. Fluorine-18 FDG positron emission tomography for imaging of hepatocellular carcinoma. Am J Gastroenterol.
1999;94: 3314–3319.
15. Cho Y, Le DH, Lee YB et al. Does 18F-FDG positron emission tomography computed tomography have a role in initial staging of hepatocellular carcinoma? PLoS One. 2014;9: e105679.
16. Houshmand S, Salavati A SE et al. Dual-time point imaging and delayed-time-point Fluorodeoxyglucose PET/Computed tomography imaging in various clinical settings. PET Clin. 2016;11: 65–84.
17. Saleh FH, Mohamed SM, Nasr HA AM. Dual time point fluorodeoxyglucose positron emission tomography/computed tomography in differentiation between malignant and benign lesions in cancer patients. Does it always work? Indian J Nucl Med. 2015; 314–319.
18. Demura IT TT. 18F-FDG accumulation with PET for differentiation between benign and malignant lesions in the thorax. J Nucl Med.
2003;44: 540–548.
19. Matthies AA, Hickeson M CA. Dual time point 18F-FDG PET for evaluation of pulmonary nodules. J Nucl Med. 2002;43: 871–875.
20. Bing W, Yanzhao Z, Yigiu Z, Hui T HS. Does dual-time-point18F-FDG PET/CT scan ad in the diagnosis of hepatocellular carcinoma? Hell J
Nucl Med. 2017;20: 79–82.
21. Ryu IS, Kim JS, Roh J-L, Lee JH, Cho K-J, Choi S-H, et al. Prognostic Value of Preoperative Metabolic Tumor Volume and Total Lesion Glycolysis Measured by 18F-FDG PET/CT in Salivary Gland Carcinomas. J Nucl Med. 2013;54: 1032–1038. doi:10.2967/
jnumed.112.116053
22. Parlak C, Topkan E, Onal C, Reyhan M, Selek U. Prognostic value of gross tumor volume delineated by FDG-PET-CT based radiotherapy treatment planning in patients with locally advanced pancreatic cancer treated with chemoradiotherapy. Radiat Oncol. 2012;7: 37. doi:10.1186/1748- 717X-7-37
23. Fendler WP, Philippe Tiega DB, Ilhan H, Paprottka PM, Heinemann V, Jakobs TF, et al. Validation of Several SUV-Based Parameters Derived from 18F-FDG PET for Prediction of Survival After SIRT of Hepatic Metastases from Colorectal Cancer. J Nucl Med. 2013;54: 1202–1208.
doi:10.2967/jnumed.112.116426
24. Hirata K, Kobayashi K, Wong K-P, Manabe O, Surmak A, Tamaki N, et al. A Semi-Automated Technique Determining the Liver Standardized Uptake Value Reference for Tumor Delineation in FDG PET-CT. Chen K, editor. PLoS One. 2014;9: e105682. doi:10.1371/journal.pone.0105682 25. Konski A, Doss M, Milestone B, Haluszka O, Hanlon A, Freedman G,
et al. The integration of 18-fluoro-deoxy-glucose positron emission tomography and endoscopic ultrasound in the treatment-planning process for esophageal carcinoma. Int J Radiat Oncol. 2005;61: 1123–
1128. doi:10.1016/j.ijrobp.2004.07.717
26. Nestle U, Kremp S, Schaefer-Schuler A, Sebastian-Welsch C, Hellwig D, Rübe C, et al. Comparison of different methods for delineation of 18F-FDG PET-positive tissue for target volume definition in radiotherapy of patients with non-Small cell lung cancer. J Nucl Med. 2005;46:
1342–8.
27. Bruzzi JF, Swisher SG, Truong MT, Munden RF, Hofstetter WL, Macapinlac HA, et al. Detection of interval distant metastases. Cancer.
2007;109: 125–134. doi:10.1002/cncr.22397
28. Cerfolio RJ, Bryant AS, Ohja B, Bartolucci AA, Eloubeidi MA. The accuracy of endoscopic ultrasonography with fine-needle aspiration, integrated positron emission tomography with computed tomography, and computed tomography in restaging patients with esophageal cancer after neoadjuvant chemoradiotherapy. J Thorac Cardiovasc Surg.
2005;129: 1232–1241. doi:10.1016/j.jtcvs.2004.12.042
29. Saitta C, Raffa G, Alibrandi A, Brancatelli S, Lombardo D, Tripodi G, et al. PIVKA-II is a useful tool for diagnostic characterization of ultrasound-detected liver nodules in cirrhotic patients. Med (United States). 2017;96: 1–5. doi:10.1097/MD.0000000000007266
30. Seo SI, Kim HS, Kim WJ et al. Diagnostic value of PIVKA-II and alpha-fetoprotein in hepatitis B virus-associated hepatocellular carcinoma. World J Gastroenterol. 2015;21: 3928–3935.
31. Tateishi R, Yoshida H, Matsuyama Y, Mine N, Kondo Y OM. Diagnostic accuracy of tumor markers for hepatocellular carcinoma: a systematic review. Hepatol Int. 2008;2: 17–30.
32. Snowberger N, Chinnakotla S, Lepe RM, Peattie J GR. Alpha fetoprotein,ultrasound, computerized tomography and magnetic resonance imaging for detection of hepatocellular carcinoma in patients with advanced cirrhosis. Aliment Pharmacol Ther. 2007;26: 1187–1194.
33. Park SJ, Jang JY, Jeong SW, Cho YK, Lee SH, Kim SG, et al. Usefulness of AFP, AFP-L3, and PIVKA-II, and their combinations in diagnosing hepatocellular carcinoma. Med (United States). 2017;96. doi:10.1097/
MD.0000000000005811
34. Cho E, Jun CH, Kim BS, Son DJ, Choi WS et al. 18F-FDG PET CT as a prognostic factor in hepatocellular carcinoma. Turk J Gastroenterol.
2015;26: 344–350.
35. Song MJ, Bae SH, Lee SW, Song DS, Kim HY, Yoo IR, et al.
18F-Fluorodeoxyglucose PET/CT predicts tumour progression after transarterial chemoembolization in hepatocellular carcinoma. Eur J Nucl Med Mol Imaging. 2013;40: 865–873. doi:10.1007/s00259-013- 2366-2
36. Park S, Kim TS, Kang SH, Kim HB, Park JW, Kim S ki. 11C-acetate and 18F-fluorodeoxyglucose positron emission tomography/computed tomography dual imaging for the prediction of response and prognosis after transarterial chemoembolization. Med (United States). 2018;97.
doi:10.1097/MD.0000000000012311
37. Kim JW, Seong J, Yun M, Lee IJ, Yoon HI, Cho HJ, et al. Usefulness of positron emission tomography with fluorine-18- fluorodeoxyglucose in predicting treatment response in unresectable hepatocellular carcinoma patients treated with external beam radiotherapy. Int J Radiat Oncol Biol Phys. 2012;82: 1172–1178. doi:10.1016/j.ijrobp.2010.11.076 38. Hwang SH, Lee JW, Cho HJ, Kim KS, Choi GH, Yun M. Prognostic
Value of Metabolic Tumor Volume and Total Lesion Glycolysis on Preoperative 18F-FDG PET/CT in Patients with Very Early and Early Hepatocellular Carcinoma. Clin Nucl Med. 2017;42: 34–39. doi:10.1097/
RLU.0000000000001449
39. Lee JW, Hwang SH, Kim HJ, Kim D, Cho A, Yun M. Volumetric parameters on FDG PET can predict early intrahepatic recurrence-free survival in patients with hepatocellular carcinoma after curative surgical resection. Eur J Nucl Med Mol Imaging. 2017;44: 1984–1994.
doi:10.1007/s00259-017-3764-7
40. Jo IY, Son SH, Kim M, Sung SY, Won YK, Kang HJ, et al. Prognostic value of pretreatment 18F-FDG PET-CT in radiotherapy for patients with hepatocellular carcinoma. Radiat Oncol J. 2015;33: 179–187.
doi:10.3857/roj.2015.33.3.179