1
Errata to Doctoral Dissertation
Essays on Financial Development in China:
Political Connection, Fiscal Effect and Openness
By Ruidong Gao 4 June 2014
Page/line Original text Corrected text
42/4 DCA s t-statistics: -79.630, DCA s mean: 0.0555,
DCA s t-statistics: 4.677, DCA s mean: 0.056,
50/31
firms significantly have a negative impact on DCA other than operating performance.
firms significantly have a positive impact on DCA other than operating performance.
I
Contents
Abstract... 1
1. Introduction... 2
2. The role of financial and trade openness in local financial development in post- reform China: Evidence from panel data... 6
2.1 Introduction... 6
2.2 Theoretical framework... 8
2.3 Empirical tests... 11
2.3.1 The measure of local financial development... 11
2.3.2 Empirical model... 13
2.3.3 The results... 15
2.3.4 Robustness checks... 26
2.4 Conclusions... 26
3. Political connections, regulation changes and operating performance of Chinese IPOs... 28
3.1 Introduction... 28
3.2 Background information and hypothesis... 29
3.3 Methodology, sample selection process and data... 32
3.3.1 Variables of operating performance... 32
3.3.2 Variable of earnings management... 33
3.3.3 Variable of political connections... 33
3.3.4 Sample selection and data... 35
3.4 Empirical results... 37
3.4.1 Regression analyses... 39
3.4.2 Robustness checks... 43
3.5 Conclusion... 47
4. Does government expenditure affect Chinese long-term stock performance?... 48
4.1 Introduction... 48
4.2 Background information and hypothesis... 49
4.3 Methodology, sample selection process and data... 50
4.4 Empirical results... 54
II
4.5 Conclusion... 62
5. Using SOEs stock returns to identify Chinese government spending shocks... 64
5.1 Introduction... 64
5.2 From theoretical results to empirical evidence... 65
5.2.1 Theoretical review... 66
5.2.2 Overview of existing empirical studies... 70
5.3 Overview of the VAR model and identification methodology... 73
5.3.1 Fiscal policy in a VAR model and recursive identification approach... 73
5.3.2 Other identification approaches... 76
5.4. Responses to government spending shocks... 79
5.4.1 Variables and sample choice... 79
5.4.2 Data description... 79
5.4.3 Response to a government spending shock... 80
5.5 Using SOEs stock returns to identify fiscal shocks... 81
5.5.1 Enterprises constitute under the different political systems... 81
5.5.2 Sample selection... 85
5.5.3 The response to a shock to SOEs excess and abnormal return... 86
5.6 Conclusions... 89
6. Conclusion... 91
References... 93
Acknowledgements... 102
1
Abstract
The economic reforms and liberalization that started in 1978 transformed the Chinese economy from a centrally planned economy to a market-oriented one. Key aspects of the economic reform were the reduction of trade barriers, the adoption of foreign direct investment (FDI) and the establishment of stock exchanges. Economic reforms brought the rapid economic growth and the financial development, which also entailed the serious distortions in the capital allocation, the poor operating performance of post-initial public offering (IPO) firms, and the fast-growing government spending. This dissertation is devoted to statistically examining the role of financial and trade openness as factors behind the divergent pattern of the financial deepening process, the effect of regulation changes on operating performance of IPO firms and the response of Chinese economy to
2
1. Introduction
The rapid economic growth in China over the past thirty years is notable in light of the serious distortions in its capital allocation (Allen et al., 2005;H´ericourt and Poncet, 2009;
Ayyagari et al., 2010). T
private sector from obtaining formal bank credit (Huang, 2003). Thus, China becomes an important counterexample to the law and finance literature that focuses on formal institutions only, as the Chinese growth-led firms rely on alternative financing channels based on reputation and relationships rather than formal financing channels (Allen et al., 2005). At the same time, existing studies have not paid adequate attention to spatial disparity in the pace of the development of local financial sectors. This dissertation is an attempt to add new evidence for these views.
Chapter 2 in this dissertation is devoted to shedding light on financial and trade openness as factors behind the divergent pattern of the financial deepening process among the provinces of China. This would be helpful to determine the factors behind such spatial disparity in the accessibility to formal external finance.
As an important aspect of China's economic transition, a lot of Chinese SOEs have been undergoing partial privatization through initial public offerings (IPOs) with the government retaining a substantial portion of ownership in the newly listed firms.
However, Chen et al., 2006 and Fan et al., 2007 find these partially privatized SOEs generally perform worse after IPO and argues that politically connected IPO firms in China are less intended to maximize ecause of government intervention. Moreover, existing studies present that the poor post-IPO operating performance is caused by the opportunistic reporting practices and forecasting behaviors (Ritter, 1991; Teoh et al., 1998; Kao et al., 2009). A great number of studies show evidence that firms manipulate earnings in the process of going public (Aharony et al., 1993; Friedlan, 1994; Teoh et al., 1998; Teoh, Wong & Rao, 1998; DuCharme et al., 2001;Roosenboom et al., 2003;Darrough and Rangan, 2005). Chapter 3 is devoted to the investigation of the relationship between the regulatory incentives, and the opportunistic reporting practices and forecasting behaviors by the issuer during the IPO processing.
3
This would have an important implication for shedding light on poor post-IPO operating performance of Chinese politically connected IPO firms.
Existing studies illustrate ambiguous evidences about long-term stock performance of Chinese IPO firms (Liu et al., 2012a; Fan et al., 2007). Liu et al. (2012a) reveales that firms with political connections experience better long-term stock performance and argued that political connections can help firms to receive a preferential access to bank loans, which substantially mitigates financial constraints. However, Fan et al., (2007) argues that the property-right constraints faced by the firms, namely the non- transferability of state ownership and the privilege of the government to appoint CEOs, significantly impair firm performance as well as board professionalism and governance.
Moreover, Kornai (1986) argues that governments provide subsidies and financial supports to the firms with political connections. Those government subsidies and -term stock performance. Thus, there exists an empirical question how political connections affect the long-term stock performance of IPOs. Chapter 4 is devoted to examining whether the government expenditure potentially affects the long-term stock performance of IPOs, especially that of politically connected ones. This would be helpful to determine the factors influence the long-term stock performance of Chinese IPOs.
To date, a greater number of researchers have studied the effects of government spending shocks. However, we are still far from the consensus about its effectiveness.
The predictions differ by the choice among competing macroeconomic models and by the exchange rate regimes. All of the Neo-Classical and new open economy macroeconomics (NOEM) models predict a negative response of the private consumption against a positive government spending shocks (Monacelli and Perotti, 2010; Enders et al., 2011;
Cardi and Müller, 2011;Obstfeld and Rogoff, 1995;Darius, 2010). However, the existing empirical studies find only the opposite; a positive response of the private consumption (Monacelli and Perotti, 2010; Gernot J, 2008; Fisher and Peters, 2010; Roel and Giuliodori, 2011). The existing researches are also less concerned with the other areas and countries except for OECD countries. Chapter 5 is devoted to fill in this gap in the literature by proposing a new empirical identification strategy, which is suitable for the transition economy China.
4
The remaining part of this dissertation is organized as follows;
Chapter 2: The role of financial and trade openness in local financial development in post-reform China: Evidence from panel data
Chapter 2 explores whether financial and trade openness improves the distortions apparent in Chinese banking system. The adoption of FDI and the sum of imports and exports are used to be indicator of financial and trade openness. Controlling for other factors, we find that both trade openness and financial openness has a positive and significant effect to the total bank credit. We also find that FDI inflows have a positive and significant influence on the local financial development by improving the access of firms in the private sector to formal bank finance and by facilitating deposit mobilization in recipient provinces. These results suggest that it is important to ensure financial openness to improve the efficiency of capital allocation and, consequently, to address the widening regional disparities in China.
Chapter 3: Political connections, regulation changes and operating performance of Chinese IPOs
Chapter 3 examines whether the regulatory incentives induce the opportunistic reporting practices and forecasting behaviors by the issuer during the IPO processing, and poor post-IPO operating performance of Chinese companies. We find that IPO firms with political connections engage in earnings management by using 627 A-share IPOs in the years from 2000 to 2007. Our results also suggest that politically connected IPO firms experience a poor operating and financial performance than those without political connections after going public. Moreover, we find that the IPOs that went public during the book-building system experience a better post-IPO operating performance than those went public under the issuance-quota system and the restricted-channel system. This chapter is based on the paperLiu et al. (2012b).
Chapter 4: Does government expenditure affect Chinese long-term stock performance?
Previous studies illustrate ambiguous evidences about the influence of political connections on IPO processing. Some researchers argued that political connections are
5
likely to provide preferential benefits to IPO firms on IPO processing, such as higher offering price, lower underpricing, and preferential access to bank loans. In contrast, some other studies argued that the government intervention may reduce the efficiency of politically connected firms, and thus bring a worse post-IPO performance. Chapter 4 examines whether the government expenditure could potentially affect the long-term stock performance of IPOs to test the hypothesis that the government subsidies and contracts are given to politically connected firms prior to non-connected ones. We find that the government expenditure positively affects the long-term stock performance of politically connected firms by using 627 A-share IPOs in the years from 2000 to 2007.
This chapter is based on the paperLiu et al. (2012a).
Chapter 5: Using SOEs stock returns to identify Chinese government spending shocks
All of the Neo-Classical and NOEM models predict a negative response of the private consumption against a positive government spending shocks. However, the existing empirical studies find only the opposite; a positive response of the private consumption.
We attribute the inconsistency to the defect of the traditional recursive identification strategy, which lacks the ability to capture the unobservable information about the expected change in the government spending in a more precise and timely manner.
Chapter 5 proposes a new identification strategy, which makes use of the typical feature of a transition economy, i.e., the government preferential treatment for state-owned enterprises (SOEs). By applying our novel identification method, we find that the response of Chinese economy to fiscal stimulus under the crawling-peg exchange rate regime is consistent with the view of the Neo-Classical and NOEM models; namely the output increases, the private consumption decreases and the real exchange rate appreciates in response to a positive government spending shock.
Chapter 6: Conclusion
Chapter 6 summarizes the dissertation.
6
2. The role of financial and trade openness in local financial development in post-reform China: Evidence from panel data 2.1 Introduction
financial sector significantly promotes its economic growth (e.g., King and Levine,1993;
Rajan and Zingales,1998; Fisman and Love,2004). However, some countries are still suffering from serious underdevelopment of their financial sectors. Researchers are therefore trying to determine the factors that underlie financial development across countries (e.g., Rajan and Zingales,2003; Baltagi et al.,2009). This chapter moves forward this discussion by exploring the factors underlying the spatial disparity of the financial development at the local level within a single country by using the case of China1.
and fastest-growing economies, has attracted special attention in the literature. Its rapid growth over the past thirty years is notable in light of the serious distortions in its capital allocation (e.g., Allen et al., 2005; H´ericourt and Poncet, 2009;Ayyagari et al., 2010). The Chinese financial system is dominated by four large state-owned banks (i.e., the Bank of China, China Construction Bank, the Industrial and Commercial Bank of China, and the Agricultural Bank of China). Consequently, the distribution of the domestic capital is extremely skewed towards the state sector (state- owned and state-holding enterprises; SOEs), even though the private sector (all enterprises other than SOEs; non-SOEs) is the driving force for
During the period from 1998 to 2009, the private sector grew at 1077.4% in terms of industrial output, while the state sector only grew at 336.1%. Furthermore, the private sector, which employed 79.6% of all industrial workers as of 2009, is also a much more important source for employment opportunities than the state sector2.
The literature suggests that the weak legal protection of property rights and the
1Guiso et al. (2004), which explores the role of social capital in local financial development in Italy, is a pioneer work in this field.
2Authors' calculation based on data collected fromthe China Statistical Yearbook(various years).
7
the private sector from obtaining formal bank credit (e.g., Huang, 2003). Allen et al.
(2005) deem China an important counterexample to the law and finance literature that focuses on formal institutions only, as the Chinese growth-led firms rely on alternative financing channels based on reputation and relationships rather than formal financing channels.
An important drawback ofAllen et al. (2005)is that it has not paid adequate attention to spatial disparity in the pace of the development of local financial sectors. Ayyagari et al. (2010) find evidence that Chinese firms with formal bank finance have more rapid growth than similar firms without, and cast doubt on the dominant view that informal finance serves as a substitute for formal financing channels. Sun and Yamori (2009) the inland regions find it more difficult to access external finance than their counterparts in the coastal regions. However, it would be helpful to determine the factors behind such spatial disparity in the accessibility to formal external finance.
This chapter sheds light on financial and trade openness as factors behind the divergent pattern of the financial deepening process among the provinces of China. The indicator of financial openness is defined as the adoption of foreign direct investment (FDI), which is a typical means of the access to the international capital market for domestic firms, indicates the capital market openness in each province.3Trade openness is defined as total imports and exports as the share of the gross regional product (GRP, hereafter). In section 2, we propose the hypotheses that FDI inflows improve the access of the private sector to domestic bank finance and facilitate deposit mobilization in recipient provinces.
Hellmann et al. (1997, 2000)advocate the financial restraint hypothesis, which states that the government can facilitate financial development by creating rent opportunities for banks by restricting competition in the banking sector. Our hypotheses basically rely on the paradigm of financial restraint, but differ in an important respect. In our view, competition encouraged by foreign investors is a significant driving force for local banking development.
3See Buch el at. (2005), Chinn and Ito (2006) and Bekaert el al. (2011) for discussions and comparisons of various measures on financial openness. The employment of FDI as financial openness indicator bases upon data availability in Chinese province level.
8
The aim of this chapter is to test the hypotheses stated above. Unfortunately, there are
ownership forms consistently published by
this difficulty, we build a proxy for the ease with which firms in the private sector can obtain domestic bank credit using methodology developed by the existing literature, including Zhang et al. (2007) and Aziz and Duenwald (2002), and develop provincial- level panel data.
The rest of the chapter is organized as follows. Section 2 presents the hypothesis to be empirically tested. Section 3 describes our empirical strategy and reports the main results.
Section 4 conducts robustness checks. Section 5 concludes.
2.2 Theoretical framework
In this section, we present the theoretical hypothesis using the framework of financial restraint advocated byHellmann et al. (1997, 2000). In this paradigm, banks collect funds as a form of deposits from the household sector and provide them to the corporate sector, which consists of the state sector and the private sector. The Chinese government, like the government of any other developing country, intervenes in the bank loan market by directing banks to preferentially allocate loanable funds to the state sector and imposing deposit and lending rate ceilings.
Panel (a) of Figure 1 presents the situation in pre-reform China. The government sets a ceiling on the deposit rate of interest at DR1, which is lower than the Walrasian interest rate, R0. The amount of loanable funds that banks can collect from the household sector as a form of deposits is then Q1. Banks allocate loanable funds to the state and private sector under a ceiling of the lending rate, LR1( R0). In this scenario, banks extract rents from the household sector; these are defined as LR1 DR1 Q1.4
4The distribution of loanable funds is extremely skewed towards the state sector due to the lower risk of state sector.
9
The Chinese economic regulation and environment significant change due to economic and financial reforms were implemented during the 1990s until WTO entry in 2001, and since WTO entry. Tariffs, trade barriers and regulation largely reduce accompanied by economic reforms, which positively influence economic growth and cause an outward shift in the demand curve of domestic bank credit.5
As shown in panel (b) of Figure 1, a raise of domestic demand of finance can increase the wedge between deposit and lending rates from LR DR1 1 to LR2 DR1 , thereby increasing the rents obtained by banks.6At the same time, financial market liberalization resulted by financial reform increases competition between banks, then banks are given greater freedom to allocate assets and to determine interest rates.7A raise in competition between banks erodes bank profits and consequently lower bank franchise values. Then banks have more incentives for absorbing deposit and making higher risk loans (non- SOEs, namely private sector) (Hellmann et al., 2000). Therefore banks are newly mobilized by making more investments in infrastructure for deposit collection, which cause an outward shift in the supply curve of domestic deposit (see panel (c) of Figure 1).8At the same time, the loans are allocated to private sector that are less ordered in credit allocation in nature would increase. It is important to note that the paradigm of financial restraint premises that the amount of loanable funds (i.e., deposits) depends on the extent to which households can access infrastructure for deposit mobilization such as the branch network in local communities (Hellmann et al., 1997).
The above discussion is summarized in the following hypotheses.
5The raise in economic growth increases the demand of finance. There is still little robust evidence of the economic growth benefits of FDI inflow. (Alfaro et al., 2004, Kose et al., 2009)
6We assume domestic credit demand, directly created by the incorporation of FDI, offset a leakage of domestic demand to foreign investors caused by FDI inflows.
7From 2006 to 2012, the number of total legal entities of the Chinese banking institutions increased from 449 to 1820 (both of them exclude rural credit cooperatives). From 2003 to 2012, the number of foreign banks institutions in China increased from 192 to 412 and the total assets increased from 415.9 billion RMB to 2380.4 billion RMB (China banking regulatory commission annual report 2006-2012). The control over the cap of interest rates on loans offered by financial institutions to their clients in China experienced 110 percent of benchmark lending rates in 1996; 120 percent in 1998; 130 percent in 1999 and the cap is removed in 2004. The control over the floor of interest rates experienced the 90 percent of benchmark lending rates in 1996 80 percent in
8The deposit interest rate is consumed to be constant for simplicity.
10
Hypothesis 1: FDI inflows correct the distortion in the capital allocation in the recipient provinces by improving the access of firms in the private sector to formal bank finance.
Hypothesis 2: FDI inflows facilitate the deposit mobilization by banks in the recipient provinces.
An important policy implication suggested byHellmann et al. (1997, 2000) is that the government can facilitate financial development by restricting competition in the banking sector to create rent opportunities for banks. Our hypotheses basically rely on the paradigm of financial restraint, but differ in an important respect. In our view, competition encouraged by financial openness is a significant driving force for local banking development.
The hypotheses stated above are closely related to the private interest theory of financial development. Rajan and Zingales (2003) suggest that access of domestic firms
breeding competition in domestic markets. We expect that the absorption of FDI by Chinese firms, as indicator of financial openness, facilitates financial development even on a subnational level. Rajan and Zingales (2003) also suggest that trade openness may also facilitate financial development by weakening local
reallocation of capital to efficient but politically subordinated firms. To check the Rajan- Zingales hypothesis, we include trade openness, which is defined as total imports and exports as a share of GRP, in equation 2.
11
2.3 Empirical tests
2.3.1 The measure of local financial development
Our dataset covers 31 Chinese provinces (or province-level autonomous regions or direct controlled municipalities) on the mainland during the post-reform period 1998 2009. It is worth noting that the four large state-owned commercial banks had been officially instructed to lend to firms in the state sector under the national credit plan, but state-owned and non-state-owned banks were permitted asset and liability management
12
based on their profit incentives by the end of 1998 (Park and Sehrt, 2001;H´ericourt and Poncet, 2009;Wu, 2006).
To capture the degree of financial development for each province, we employ a proxy for the ease with which firms in the private sector can access formal bank finance. In perfect financial markets, any entrepreneur with a sound project should obtain funds regardless of their identity (Rajan and Zingales, 2003). In the case of a transition economy like China, however, the type of ownership of borrowers can be a potential obstacle in obtaining external finance because of political bias toward certain firms in allocating domestic capital. Therefore, we believe that an appropriate proxy for the ease with which firms in the private sector can access formal bank finance, as well as the degree of deposit mobilization, would also be the right measure of local banking development in China.
Unfortunately, however, there are no satisfactory data available on bank loans decomposed on the basis of the bo
circumvent this difficulty, we construct a proxy using the following procedures developed byZhang et al. (2007)andAziz and Duenwald (2002).
First, consider the following equation:
0 1 ,
, , i i t
i t i t
Loans to GRP ratio SOEs share in industrial output (1) where the dependent variable is total loans as a share of gross regional product (GRP) for province i at year t
province-specific effects. i t, is the disturbance term, which includes a first-order autoregressive process:
, , 1 ,
i t i t i t 1
The allocation of bank credit between the state sector and the private sector is expected to be highly correlated with their industrial output shares. Therefore, the values yielded by deducting 1 (SOEs share in industrial output)i t, from the total loans (as a share of
13
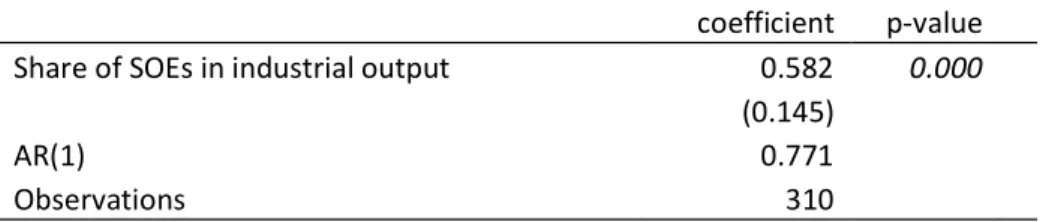
GRP) would be an appropriate proxy for the amount of bank credit allocated to firms in the private sector (as a share of GRP). Table 2.1 reports the estimation results.
Table 2.1 Panel regression for total bank loans with fixed effects: 1998 2008
coefficient p-value
Share of SOEs in industrial output 0.582 0.000
(0.145)
AR(1) 0.771
Observations 310
Notes:
1. The dependent variable is total bank loans as a share of GRP.
2. Figures in parentheses are standard errors.
Figure 2 presents the average amount of total loans (as a share of GRP) (above) and the (computed) amount of loans allocated to the private sector (as a share of GRP) (below) for the coastal and inland provinces during the period 1998 20099. Figure 2 indicates that the amount of total loans (as a share of GRP), which is extensively used as the banking development indicator in the existing literature, is likely to underestimate an increasing spatial disparity in the paces of local financial deepening between coastal and inland regions.
Finally, we determine to use two indicator of local financial development, one is the ratio of bank credit allocated to the private sector (as a share of GRP), another is the ratio of bank credit allocated to the private sector to total bank credit. We consider that the latter is more appropriate indicator since it represents the access of firms in the private sector to formal bank finance, although the former indicator is always used in the existing literature.
2.3.2 Empirical model
9Following Zhang et al. (2007) and others, the coastal region includes Beijing, Tianjin, Hebei, Liaoning, Shangdong, Shanghai, Jiangsu, Zhejiang, Fujian, Guangdong, Hainan, and Guangxi; the inland region includes Shanxi, Inner Mongolia, Jilin, Heilongjiang, Anhui, Jiangxi, Henan, Hubei, Hunan, Chongqing, Sichuan, Guizhou, Yunnan, Tibet, Shaanxi, Gansu, Qinghai, Ningxia, and Xinjiang.
14
Our empirical specification is aimed at explaining the pace of financial development and its variation across the provinces of China. To test the hypothesis stated in section 2, consider the following model as the benchmark:
, 0 1 , 1
ln(Banking development)i t (incoming FDI as a share of GRP)i t
2(inport and exports as a share of GRP)i t, 1
(Other conditioning variables), 1
k i t
k
,
i t i t (2)
Equation (2) postulates that the development of province i t the ease with which firms in the private sector can access formal bank finance and the degree of deposit mobilization is positively affected by FDI inflows (as a share of GRP) alongside a set of conditioning variables. To allow for the possibility of endogeneity, all variables in the right-hand side are lagged.
Dependent variables are the total bank credit as a share of GRP, and the logarithm of the amount of deposits per 10,000 members of the population, the (computed) amount of bank credit allocated to the private sector as a share of GRP and the (computed) amount of bank credit allocated to the private sector as a share of the total.
In the right-hand side, we include GRP per capita, which is used to capture the level of economic development, the quality of general infrastructure, and the size of local financial markets; the population density; and the degree of urbanization, which is measured by the urban population in proportion to the total population and the average disposable incomes of urban households per capita to the average net income of rural households per capita. Note that any time- and province-specific factors, such as geography, climate, ethno-linguistic characteristics, nationwide business fluctuations, and policy changes at the central government level, are all controlled for in the model. In addition, we consider the differences in the level of social capital across provinces. The literature on law and finance predicts that law enforcement plays a crucial role in a
contracts and succeeds by their implementation. On the other hand, the enforceability of
15
contracts may depend not only on law enforcement but also on the extent to which individuals can trust each other. A strand of the literature, which includes Guiso et al.
(2004), suggests that not only an efficient legal system but also generalized trust in society facilitates financial transactions at lower cost, thereby contributing to economic development. We employ a less-criticized measure for social capital: educational achievement measured by the literacy rate in the population of persons 15 years old and over. The summary statistics and correlation matrix of the dataset appear in Table 2.2 and 2.3.
2.3.3 The results
The results of the credit-demand, deposit-mobilization and credit-allocation regressions are reported in Tables 2.4, 2.5, 2.6 and 2.7, respectively.
In all columns of Table 2.4, the parameter of trade is positive and statistically significant, while the parameter of FDI inflows is negative and statistically insignificant.
The estimated coefficients suggest that trade openness positively affect economic growth and consequently increase the credit demand, not FDI openness. Table 2.5 reports the results of deposit mobilization regressions. In all columns, the parameters of FDI inflows are positive and statistically significant, but the statistically significant of parameters of trade openness depend on the selected control variables. This evidence is consistent with the hypothesis 2 stated in Section 2.
26
FDI inflows does not significantly cause the bank credit allocated to the private sector as a share of GRP as showing in Table 2.6, but it significantly cause the bank credit allocated to the private sector as a share of the total as showing in Table 2.7. The parameters of trade openness are positive and statistically significant in Table 2.6 and 2.7.
We find that whether the hypothesis 1 is supported relying on different measurement of local financial development. These results suggest that FDI inflows can improve access of firms in the private sector to formal bank finance, but trade openness can significantly increases the amount of increases bank credit allocated to the private sector.
2.3.4 Robustness checks
Lagged dependent variables are included in Arellano-Bond dynamic panel-data model for robustness checks. The results showed in Table 2.8 and 2.9 confirmed that the reason of a raise in domestic credit demand is trade openness other than FDI inflows, and FDI inflows facilitate deposit mobilization by banks in recipient provinces. The role of trade openness to local financial development is not apparent in Table 2.10 and 2.11. The evidence of positive effect of financial openness to local financial development are got in Table 2.11 although less significant than the results showed in Table 2.7. These evidences are consistent with two hypothesis stated in sector 2 and does not support Rajan-Zingales hypothesis.
2.4 Conclusions
The purpose of this chapter is to explore whether the adoption of foreign direct investment improves the distortions apparent in Chinese banking system. Controlling for other factors, we find that FDI inflows have a positive and significant influence on the local financial development by improving the access of firms in the private sector to formal bank finance and by facilitating deposit mobilization in recipient provinces. The empirical results suggest that it is important to ensure financial openness to improve the efficiency of capital allocation and, consequently, to address the widening regional disparities in China. Furthermore, trade openness positively affects economic growth and consequently increases the credit demand, but the role of trade openness to the local
27
financial development is not apparent. The evidence in the current chapter would have a significant implication for the debate about whether developing countries, including China, should further open their economies to the international capital market.
28
3. Political connections, regulation changes and operating performance of Chinese IPOs
103.1 Introduction
The development of Chinese stock market has accompanied the transition of economy from a planned economy to a market-oriented economy in China. As an important aspect, the Chinese government announced to transform the old state-owned enterprises (SOEs) into modern listed corporations in the early 1990s. Since then, a lot of Chinese SOEs have been undergoing partial privatization through initial public offerings (IPOs) with the government retaining a substantial portion of ownership in the newly listed firms. The special characteristics of Chinese share issue privatization (SIP) make the newly listed -IPO performance stands in sharp contrast against most studies on SIP worldwide, such as Russia, Eastern Europe or Latin America that experienced a similar move towards a market economy (Megginson and Netter, 2001).
Recently, many Chinese extant studies that investigate why partially privatized SOEs generally perform worse after IPO (Chen et al., 2006;Fan et al., 2007).Chen et al. (2006) find that the decline in performance is much less when private investors control the firm.
They argue that the state needs to reduce political influence on listed firms so that economic efficiency and financial performance can be improved. Fan et al. (2007) also show that politically connected IPO firms in China are less intended to maximize more associated with poor post-IPO performance. Previous studies suggest that government intervention may reduce the efficiency of politically connected firms.
Moreover, existing studies present that the poor post-IPO operating performance is induced by the opportunistic reporting practices and forecasting behaviors (Ritter, 1991;
Teoh et al., 1998; Kao et al., 2009). Indeed, these studies show evidence that firms
10This chapter is a revised version of the article, Liu, Jianlei, Konari Uchida, and Ruidong Gao. (2012).
"Earnings management of initial public offering firms: evidence from regulation changes in China."
Forthcoming, Accounting & Finance (DOI: 10.1111/acfi.12006). I thankfully acknowledge my coauthors and the publisher for kindly permitting to include this chapter in my dissertation.
29
manipulate earnings in the process of going public (Aharony et al., 1993;Friedlan, 1994;
Teoh et al., 1998;Teoh, Wong & Rao, 1998;DuCharme et al., 2001;Roosenboom et al., 2003; Darrough & Rangan, 2005). IPO, a
considered to be the first opportunity for founders to realize capital gains from their shares (Aharony et al., 1993; DuCharme et al., 2001;Brav & Gompers, 2003; Darrough
& Rangan, 2005). The Chinese government as the controller of SOEs has an incentive to make SOEs manipulate earnings to achieve a high offering price, which can inject equity Liu et al., 2012b).
This chapter examines whether the regulatory incentives induce the opportunistic reporting practices and forecasting behaviors by the issuer during the IPO processing, and poor post-IPO operating performance of Chinese companies. We adopt 627 A-share Chinese IPOs between the years of 2000 and 2007 as our sample. We find that IPO firms with political connections engage in earnings management. Our results also suggest that politically connected IPO firms experience a poor operating and financial performance than IPO firms without political connections after going public. Moreover, we find that IPO firms controlled by central government experience better operating performance than IPO firms controlled by local government. Finally, we also find that the IPOs that went public during the book-building system experience a better operating performance than IPOs that went public under the issuance-quota system and restricted-channel system.
The remainder of this chapter is organized as follows. Section 2 presents background information and hypothesis. Section 3 shows the methodology, the sample selection process. Section 4 presents empirical results. Finally, Section 5 is the brief summary of the chapter.
3.2 Background information and hypothesis
The economic reforms and liberalization that started in 1978 have transformed the Chinese economy from a centrally planned economy to a market-oriented one. A key
Stock Exchange (SHSE) in 1990, followed by the Shenzhen Stock Exchange (SZSE) in
30
1991. A critical purpose of the establishment of the stock market is to help privatize SOEs. A lot of Chinese SOEs have been undergoing partial privatization through IPOs.
IPO, as the good opportunity for founders and managers to realize capital gains from their shares, give the incentive for founders and managers of IPO firms to achieve a high offering price and thereby maximize their capital gains through manipulated earnings (Schipper, 1989;Aharony et al., 1993;Teoh et al., 1998;DuCharme et al., 2001). As the controller of SOEs, government officials have an incentive to make SOEs manipulate earnings for equity capital injection without public expenditures. The growth of SOEs through additional equity capital will contribute to economic growth and thereby benefit
as follows:
Hypothesis 1:IPO firms with political connections engage in earnings management.
The government only partially privatize SOEs for controlling SOEs and economic through SOEs. More than 50% shares of privatized SOEs are still held by central or local government. Moreover, the managers of many SOEs are appointed by the government or are typically former high-ranking government officials, which introduce the political influences on those companies. These situation lead to operating performance of politically connected firms is affected by government interference in the operation process.
Indeed, Chen et al. (2006) find that the decline in performance is much less when private investors control the firm. They argue that the state needs to reduce political influence on listed firms so that economic efficiency and financial performance can be improved. Fan et al. (2007) also show that politically connected IPO firms in China are
not conducive to maximizing -IPO
performance. Previous studies suggest that government intervention may reduce the efficiency of politically connected firms. Hence, our second hypothesis is as follows:
Hypothesis 2: IPO firms without political connections experience a better operating performance than IPO firms with political connections after going public.
31
The Chinese IPO market has experienced significant institutional changes during the past decade. Until 2004, local government officials exerted strong control over selections of companies to go public under the Issuance Quota System and Channel Restrictions System. These regulations were removed in 2005, when the book-building system was introduced.
It is likely that the governments are more inclined to choose firms with political connections to IPO than firms without political connections in regulative environments during 1993-2004. This is based on the purpose of the establishment of stock exchanges and along with unique IPO regulation environments. Governments could inject equity capital into SOEs without public expenditures by establishing the stock exchanges. The governments also could profit from the economic growth through the development of
Chinese government introduced the Issuance Quota System to select companies to go public. Under this system, the China Securities Regulatory Commission (CSRC) imposed the maximum number of shares that could be issued to local governments and rewarded local governments by allocating more stock issuance quotas if the listed companies recommended by the local government performed better during post-IPO periods. This provided local government officials with an opportunity to choose politically connected companies (e.g., SOEs).
It is also noteworthy to point out that the Chinese central government adopted the Channel Restrictions System between the years of 2001 and 2004. Under this system, a securities firm is rewarded by more stock issuance channels if it underwrites IPO firms that perform well during the post-IPO period. More importantly, most securities firms are SOEs and likely to underwrite politically connected firms, as local government officials do in the Issuance Quota System. However, the Chinese government adopted the book- building system in the IPO process in 2005, under which the selection mechanism on local governments and securities firms was removed. This caused that most of IPO firms
32
are political connected firms under a regulation environment (Liu et al., 2012a).11Along with assumption 1, those discussions give rise to the following hypothesis:
Hypothesis 3: IPO firms under book-building system experience better operating performance than IPO firms under regulation system.
In addition, many SOEs operate in protected industries and monopolize the production market.12Aharony et al. (2000) analyze the behavior of return on assets (ROA) for a sample of 83 Chinese IPOs completed between 1992 and 1995. They found that the post- IPO decline in ROA is statistically significant in unprotected (more competitive) industries, but not in protected industries. Comparing with SOEs controlled by local governments or other SOEs, SOEs controlled by central government have more monopoly power, which give rise to the following hypothesis:
Hypothesis 4: IPO firms controlled by the central government experience a better operating performance than IPO firms controlled by a local government.
3.3 Methodology, sample selection process and data
3.3.1 Variables of operating performance
This chapter examines whether the regulatory incentives induce the opportunistic reporting practices and forecasting behaviors by the issuer during the IPO processing, and poor post-IPO operating performance of Chinese companies. Following the previous studies (Megginson et al., 1994; Boubakri and Cosset, 1998; D'Souza and Megginson, 1999, andChen et al., 2006), we adopt the ROA; return on sales (ROS); return on equity (ROE); capital expenditure on sales (CE_S) and leverage as the proxy of operation and financial performance. Our chapter employs the difference between pre- and post- privatization as the measure of operating performance of the firms. We employ year 0 as the proxy of pre-privatization (the year of the privatization) and means of years t 1to
3
t periods as a proxy of post-privatization. Year t 1 is the first complete year after listing. See Table 3.1 for definitions of the variables.
11The percentage of SOEs in IPOs is 72.9% during 2000-2004, and the percentage is 36.5% during 2005- 2007.
12 Petrochemicals, energy, and raw materials are typical protected industries (Aharony et al., 2000).
33 3.3.2 Variable of earnings management
About the proxy of earnings management, we follow previous studies and adopt the modified Jones Model to compute an earnings management measure for our sample companies (Teoh et al., 1998;DuCharme et al., 2001).
Teoh et al. (1998) divide total accruals into current and long-term components and argue that managers are able to exert more discretion over current accruals. We calculate the current accruals (CA) as:
(1)
The current accruals can be further divided into nondiscretionary accruals, which are attributable to business conditions, rules and institutions (Roosenboom et al., 2003), and discretionary accruals (DCA). We adopt DCA as the key variable in this research. We use the cross-sectional modified Jones model to estimate the nondiscretionary current accruals. For each IPO company, we estimate the following equation by using data of all same industry firms excepting the IPO firm (estimation sample) at the IPO year.
(2) Subscriptsjand tdenote firm and year. The nondiscretionary current accruals of an IPO firmiis computed by:
(3)
where and are estimated coefficients for equation (2). in accounts receivables .The DCA of the IPO firmiis computed by:
(4) 3.3.3 Variable of political connections
In China, all SOEs that go public are partially privatized so that the state maintains control. The state still owns the majority of outstanding shares of SOEs after IPOs (Hovey and Naughton, 2007). Those facts suggest that all SOEs are politically connected. We also ca
connections. We defined a politically connected CEO as a CEO who worked as a
34
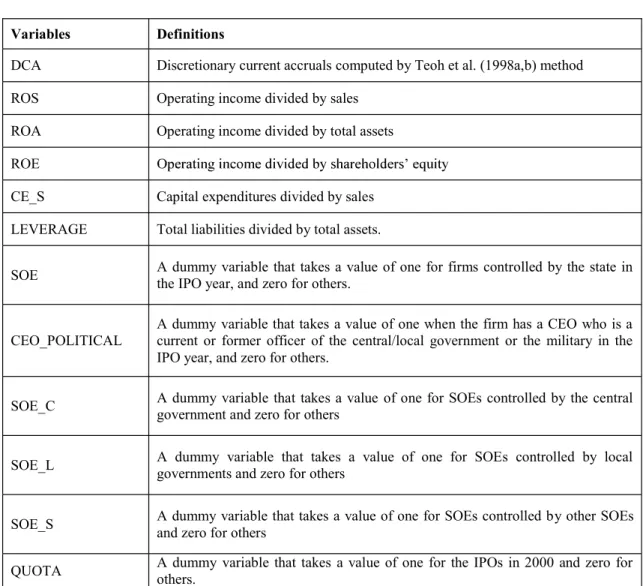
current or former government officer (e.g., city mayor, the military, or higher position) (Fan et al., 2007;Francis et al., 2009). In our sample, there are 391 SOEs and 66 firms have politically connected CEOs. Moreover, different levels of governments potentially have different effects on IPO firms earnings management. We also make three dummy variables to test this idea: one for SOEs controlled by the Chinese central government and zero for others (SOE_C); one for SOEs controlled by the local government (SOE_L) and zero for others; and one for SOEs controlled by other SOEs and zero for others (SOE_S).
Table 3.1 Definitions of variables
Variables Definitions
DCA Discretionary current accruals computed by Teoh et al. (1998a,b) method
ROS Operating income divided by sales
ROA Operating income divided by total assets ROE
CE_S Capital expenditures divided by sales LEVERAGE Total liabilities divided by total assets.
SOE A dummy variable that takes a value of one for firms controlled by the state in the IPO year, and zero for others.
CEO_POLITICAL
A dummy variable that takes a value of one when the firm has a CEO who is a current or former officer of the central/local government or the military in the IPO year, and zero for others.
SOE_C A dummy variable that takes a value of one for SOEs controlled by the central government and zero for others
SOE_L A dummy variable that takes a value of one for SOEs controlled by local governments and zero for others
SOE_S A dummy variable that takes a value of one for SOEs controlled by other SOEs and zero for others
QUOTA A dummy variable that takes a value of one for the IPOs in 2000 and zero for others.
35
CHANNEL A dummy variable that takes a value of one for the IPOs during the period of 2001 2004 and zero for others.
LNEQUITY Natural logarithm of shareholder equity.
Ch_MANAGEROW N
The percentage ownership by the manager and directors in the IPO year minus the percentage ownership by the manager and directors before the IPO year.
TOPONE The percentage ownership of the largest shareholder in the IPO year.
LNASSET Natural logarithm of total assets in the IPO year.
EX A dummy variable taking the value one if the company is listed on the Shanghai Securities Exchange.
3.3.4 Sample selection and data
We analyze Chinese A-share IPOs that went public on the SHSE and SZSE during the 2000 2007 periods. We obtained financial and dividend data, corporate ownership structure and stock price data were collected from the China Center for Economic Research Database (CCER Database). We hand-collect data from the pre-IPO years (corporate ownership structure data and financial data) and information on the political
years after the IPOs, which is why we end the sample period with the year 2007.
The sample period covers the periods during which the Issuance Quota System, Channel Restrictions System, and book-building system were executed. This enables us to investigate the impact of the exogenous institutional change. We do not include B- share IPOs, because there were only six B-share IPOs during the period. This number is significantly smaller in offering size than A-share IPOs13. We exclude data from financial companies, because of their different accounting statement formats and delist firms during the period. In addition, if the firm has issued B-shares or H-shares previously, it is not included in our sample. As a result of those procedures, our sample consists of 627 companies, of which 374 firms are listed on the SHSE and 253 firms on the SZSE.
13For B-share IPOs between the years of 2000 and 2007, the amount of new stock offerings ranged from 0 billion to 27.2 billion RMB, whereas that of A-share IPOs ranged from 56.7 to 4590.6 billion RMB (China Capital Markets Development Report issued by the CSRC in 2008).
36
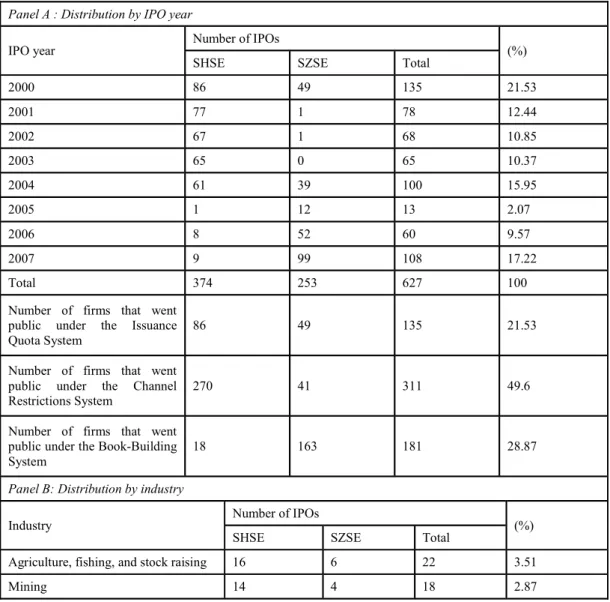
Panel A of Table 3.2 shows the distribution of our sample by calendar year. A total of 446 firms were selected under the Issuance Quota System and Channel Restrictions System to go public. During these 8 years, IPO markets are found to be more highly active in the years of 2000, 2004, and 2007. We find a small number of companies going public in 2005 and 2006, probably because in the Chinese stock market IPOs were suspended during the periods of September 9, 2004 to February 3, 2005 and May 25, 2005 to June 2, 2006. Panel B presents the industry distribution of our sample firms.
Manufacturing firms account for a substantial part of the sample companies.
Table 3.2 Sample distribution
Panel A : Distribution by IPO year
IPO year Number of IPOs
SHSE SZSE Total (%)
2000 86 49 135 21.53
2001 77 1 78 12.44
2002 67 1 68 10.85
2003 65 0 65 10.37
2004 61 39 100 15.95
2005 1 12 13 2.07
2006 8 52 60 9.57
2007 9 99 108 17.22
Total 374 253 627 100
Number of firms that went public under the Issuance
Quota System 86 49 135 21.53
Number of firms that went public under the Channel
Restrictions System 270 41 311 49.6
Number of firms that went public under the Book-Building
System 18 163 181 28.87
Panel B: Distribution by industry
Industry Number of IPOs
SHSE SZSE Total (%)
Agriculture, fishing, and stock raising 16 6 22 3.51
Mining 14 4 18 2.87
37
Manufacturing 222 191 413 65.87
Electricity, gas, and water 19 5 24 3.83
Construction 14 5 19 3.03
Transportation and warehousing 29 4 33 5.26
Information Technology 24 17 41 6.54
Wholesale and retail 14 6 20 3.19
Real estate 11 2 13 2.07
Social services 7 11 18 2.87
Media 2 1 3 0.48
Comprehensive 2 1 3 0.48
Total 374 253 627 100
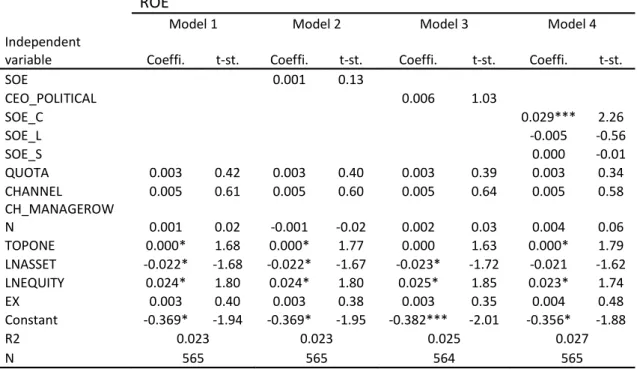
3.4 Empirical results
We conduct regression analyses that adopt the adopted the DCA, ROS, ROA, ROE, CE_S and LEVERAGE as dependents variable for the sake of examining whether the regulatory incentives induce the opportunistic reporting practices and forecasting behaviors by the issuer during the IPO processing, and poor post-IPO operating performance of Chinese companies after controlling for various factors. The key independent variables are indicator variables for SOEs (SOE; SOE_C; SOE_L; SOE_S), politically connected CEOs (CEO_POLITICAL) and the regulated period (QUOTA;
CHANNEL).
We also include several control variables. Many corporate governance studies have determined that there is a significant relationship between corporate ownership structure and firm performance (Xu and Wang, 1999;Qi et al., 2000;Wang, 2005;Gunasekarage, et al., 2007). It is a well-cited idea that managerial ownership mitigates agency costs through incentive effects at some ownership levels. In addition, IPO firms are typically accompanied by substantial reductions in managerial ownership, which potentially engender agency costs (Ritter, 1984). To test this idea, we include the change in percentage ownership by managers and directors before and after the IPO (Ch_MANAGEROWN).
Chinese SOEs have concentrated ownership structures, even after IPO, which potentially solve free-rider problems (Shleifer and Vishny, 1986). We adopt percentage
38
ownership by the largest shareholder (TOPONE) to address this issue. We use the natural logarithm of total assets (LNASSET) as a measure of firm size. We also adopt natural logarithm of shareholder equity (LNEQUITY) and stock exchange (EX) as control variables following previous studies (Chen et al., 2006).
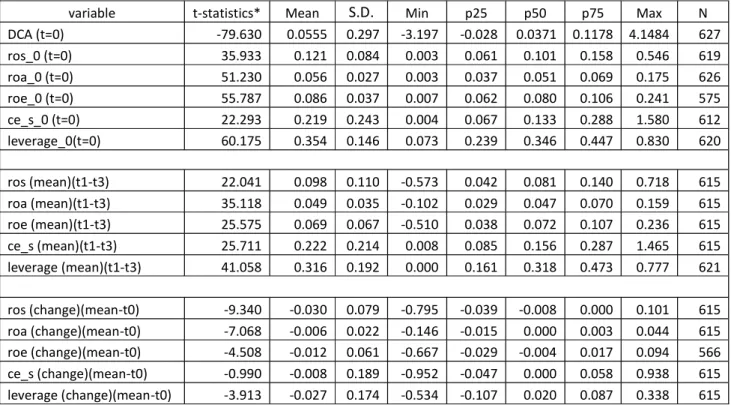
The descriptive statistics are presented in Table 3.3. It shows that ROS, ROA, ROE, CE_S decline after going public, which suggest that the operating performance of listed companies experience poor performance. These findings are consistent with the previous studies.
Table 3.3 Descriptive statistics
Panel A
variable t-statistics* Mean S.D. Min p25 p50 p75 Max N
DCA (t=0) -79.630 0.0555 0.297 -3.197 -0.028 0.0371 0.1178 4.1484 627
ros_0 (t=0) 35.933 0.121 0.084 0.003 0.061 0.101 0.158 0.546 619
roa_0 (t=0) 51.230 0.056 0.027 0.003 0.037 0.051 0.069 0.175 626
roe_0 (t=0) 55.787 0.086 0.037 0.007 0.062 0.080 0.106 0.241 575
ce_s_0 (t=0) 22.293 0.219 0.243 0.004 0.067 0.133 0.288 1.580 612
leverage_0(t=0) 60.175 0.354 0.146 0.073 0.239 0.346 0.447 0.830 620
ros (mean)(t1-t3) 22.041 0.098 0.110 -0.573 0.042 0.081 0.140 0.718 615 roa (mean)(t1-t3) 35.118 0.049 0.035 -0.102 0.029 0.047 0.070 0.159 615 roe (mean)(t1-t3) 25.575 0.069 0.067 -0.510 0.038 0.072 0.107 0.236 615 ce_s (mean)(t1-t3) 25.711 0.222 0.214 0.008 0.085 0.156 0.287 1.465 615 leverage (mean)(t1-t3) 41.058 0.316 0.192 0.000 0.161 0.318 0.473 0.777 621 ros (change)(mean-t0) -9.340 -0.030 0.079 -0.795 -0.039 -0.008 0.000 0.101 615 roa (change)(mean-t0) -7.068 -0.006 0.022 -0.146 -0.015 0.000 0.003 0.044 615 roe (change)(mean-t0) -4.508 -0.012 0.061 -0.667 -0.029 -0.004 0.017 0.094 566 ce_s (change)(mean-t0) -0.990 -0.008 0.189 -0.952 -0.047 0.000 0.058 0.938 615 leverage (change)(mean-t0) -3.913 -0.027 0.174 -0.534 -0.107 0.020 0.087 0.338 615
Note: (mean)(t1-t3) indicates the mean of t1 to t3; (change)(mean-t0) indicates the difference between mean value and t0.
Panel B
Variable Obs Mean S.D. Min Max
Ch_MANAGEROWN 627 -0.033 0.069 -0.317 0.000
TOPONE 626 44.352 16.067 0.050 85.000
LNASSET 627 6.974 0.931 5.495 12.794
LNEQUITY 581 20.271 0.779 18.878 25.814
39 3.4.1 Regression analyses
In each regression, we delete observations when the dependent variable takes a value greater (lower) than its 99th (1st) percentile to eliminate abnormal values. When the necessary independent variables are not available, the observation is also deleted from the analysis.
Table 3.4 investigates the relationship between political connections and earnings management during the IPO processing. Model (2) - (4) of Table 3.4 adopt SOE and CEO_POLITICAL for political connection measures. We find that SOE and CEO_POLITICAL have positive coefficients in models. Model (3) shows that CEO_POLITICAL has a significant impact on earnings management. These results are consistent with Hypothesis 1, suggesting that IPO firms with political connections engage in earnings management.
Table 3.4 Regression result of the DCA DCA
Model 1 Model 2 Model 3 Model 4
Independent
variable Coeffi. t-st. Coeffi. t-st. Coeffi. t-st. Coeffi. t-st.
SOE 0.008 0.19
CEO_POLITICAL 0.060* 1.78
SOE_C 0.038 0.69
SOE_L -0.029 -0.52
SOE_S 0.034 0.78
QUOTA -0.053 -0.97 -0.055 -1.06 -0.054 -1.00 -0.067 -1.17
CHANNEL 0.014 0.31 0.012 0.28 0.016 0.36 0.006 0.12
CH_MANAGEROWN -0.131 -0.79 -0.153 -0.76 -0.132 -0.80 -0.149 -0.75
TOPONE 0.000 0.65 0.000 0.54 0.000 0.67 0.000 0.36
LNASSET 0.076 1.52 0.076 1.52 0.077 1.55 0.079 1.58
LNEQUITY -0.086* -1.87 -0.086* -1.87 -0.086* -1.89 -0.091 -1.97
EX 0.014 0.34 0.013 0.30 0.009 0.22 0.019 0.42
Constant 1.247** 2.07 1.249** 2.07 1.245** 2.08 1.331* 2.19
R2 0.015 0.015 0.018 0.020
N 580 580 579 580
***: Significant at the 1% level; **: Significant at the 5% level; *: Significant at the 10% level
40
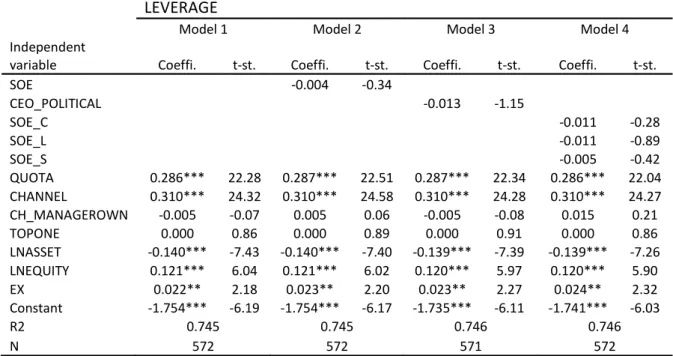
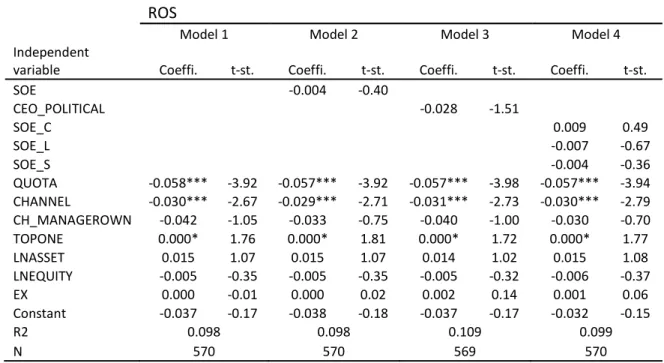
Regarding Hypothesis 2, we adopt regressions from Table 3.5 to Table 3.9. Table 3.5 shows that CEO_POLITICAL has a negative and significant coefficient on ROS in model (3), which indicates that IPO firms without political connections experience a better ROS than IPO firms with political connections. Table 3.6 and 3.9 show that there exists negative relationship between political connections and ROA (leverage). These results are consistent with previous studies (Chen et al., 2006).
Table 3.5 Regression result of the ROS ROS
Model 1 Model 2 Model 3 Model 4
Independent
variable Coeffi. t-st. Coeffi. t-st. Coeffi. t-st. Coeffi. t-st.
SOE -0.006 -0.64
CEO_POLITICAL -0.030* -1.67
SOE_C 0.007 0.39
SOE_L -0.010 -0.96
SOE_S -0.006 -0.56
QUOTA -0.059*** -4.15 -0.058*** -4.09 -0.058*** -4.21 -0.058*** -4.12 CHANNEL -0.029*** -2.57 -0.028*** -2.55 -0.030*** -2.64 -0.028*** -2.65 CH_MANAGEROW
N -0.047 -1.15 -0.032 -0.75 -0.047 -1.12 -0.029 -0.67
TOPONE 0.000* 1.83 0.000* 1.89 0.000* 1.79 0.000* 1.83
LNASSET 0.019 1.54 0.019 1.55 0.018 1.48 0.019 1.56
LNEQUITY -0.011 -0.83 -0.011 -0.83 -0.010 -0.78 -0.011 -0.85
EX -0.002 -0.16 -0.001 -0.11 0.000 0.03 -0.001 -0.05
Constant 0.074 0.39 0.072 0.380 0.067 0.35 0.079 0.41
R2 0.085 0.085 0.097 0.086
N 570 570 569 570
***: Significant at the 1% level; **: Significant at the 5% level; *: Significant at the 10% level
In order to examine our third hypothesis, we create two dummy variables: (a) one for the IPO firms in 2000, and zero for others (QUOTA); and (b) one for the IPO firms in 2001 2004, and zero for others (CHANNEL). Model (1) - (4) of Table 3.5 and Table 3.6 indicate that both the coefficients of QUOTA and CHANNEL are negative and significant. Those findings clearly support Hypothesis 3 that IPO firms under book- building system experience better operating performance than IPO firms under regulation system.