The difference of the influence between swimming and running
on hemodynamics and lipid metabolism
ENDO, Naoya
1 1
I. 1
II. 2
III. 3
IV. 4
V. 5
2 6
I. 6
II. 7
III. 9
3 1 11
I. 11
II. 12
III. 12
1) 12
2) 12
13 13
3) 14
4) 14
IV. 15
1) 15
2) 15
3) 15
V. 16
1) 16
2) 18
VI. 20
4 2 21
60
I. 21
II. 22
III. 22
1) 22
S 23
R 23
C 23
2) 23
HR 23
23 24
3) 24
IV. 25
1 25
2 25
3 25
4 26
5 26
V. 28
1 28
2 30
VI. 33
5 34
I. 34
II. 34
1 34
2 36
III. 37
6 39
39
40
References 42
1
I.
1996 12
3 3
( ) ( )
( )
21
2006 2013 1)
2) 3)
4)
(low-density lipoprotein cholesterol LDL-C)
(high-density lipoprotein cholesterol HDL-C) 5)
6) 7) ( )8)
5)9)10)
( )
11) 12)
13)
14) 15)
II.
23
16) 10 1 ( )
67.9% 58.3% (
) 30% (
)
65 65-74 45% 75
30%
1986 65-69 2.4% 2 70 1.2%
2 2011 65-69 4.1% 6 70 1.8% 6
1986 65-69 2.2% 70
0.6% 2011 65-69 5.6% 5 70 2.9% 5
2010 1 742 2
286 1 213 17) 60 25%
1 60 10-15%
65
III.
18) 19)20)
21) 22)
95% 65 75 3 1
1 23% 23)
2007
4700 2530
3790 1300 24) 50
70
30% 100% 25)
19
26)
IV.
( )
( )
V.
(maximal fat oxidation rate MFOR) (Fatmax)
( 1) 60
( 2)
2
I.
27)-30) 31)
27)32)33) 34)-36)
37)38)
(maximal fat oxidation rate MFOR) 39)-42) MFOR
(Fatmax) 43) Fatmax
(40-60%VO2max) 44)-46)
29)47)
Co-A 2
MFOR
48) Fatmax
40) 49)50) 40)-42)
40)41) 39)40)
51) 52) Fatmax
42)
Fatmax
MFOR Fatmax 53)
54) Fatmax
MFOR Fatmax MFOR Fatmax
MFOR Fatmax MFOR Fatmax
II.
55) 1964 Saltin
56) cardiac fatigue exercise-induced cardiac fatigue
57) M
1
4
(peak early left ventricle filling velocity E) (peak late left ventricle filling velocity A) (E/A)
(peak early myocardial tissue velocity e ) (peak late myocardial tissue velocity a ) (e /a )
e E (E/e )
58)
59)
60)
E/e 61)
62)
63) 64)
65)
66) 67)
68)69)
70)71)
70)
1
III.
2013 1) 30 60 3
30 10)
50 50 100 120 /
50 100/ 9) 1 30 3
180 5)
57)
67) 66)
30 E/A
72) 60 60 73)
BNP 74)
294 68)
60-1440
E/A 60
60
68)
3 1
I.
75)76)
18)
2013 1)
77)78) 79)
BMI80)
81)82)
83)
80)
MFOR Fatmax
MFOR Fatmax
21)22)
Fatmax
MFOR Fatmax
II.
1
MFOR Fatmax
III.
1)
20
30 8
(2010-247)
2)
VO2max
1
2
(BC621 )
(HEM-77A ) (STRESS TEST
SYSTEM ML 6500 ) (EUB7500 )
1
400m 10km
1
1 400m 10km 1
VO2max (MAT 2700 )
(Figure 1 1) 1
84) (Table 1 1) (
AE300S ) 30 (VO2)
(STRESS TEST SYSTEM
ML 6500 ) (heart rate: HR)
VO2max VO2 (respiratory
exchange ratio : RER) 1.1 HR (220- 85))
90 3 2 86)87)
VO2max (AQUAGYM TPS-5020 )
(Figure 1 2 1 3) 400m
0.05 m/sec
88)89)(Table 1 2) 1
45 (DC-5
) O2 CO2 ( AE300S
) (RCX5
) VO2max RER 1.1
HR (220- 85)) 90% 2
3)
VO2max (HRmax)
%VO2max (A) (B)
90) MFOR Fatmax MFOR %HRmax v-slope 91) (ventilatory threshold : VT)( (anaerobic threshold :
AT)) %VO2max
A (mg/min) = 1.67 ×VO2(l/min) 1.67 ×VCO2(l/m) B (mg/min) = 4.55 ×VCO2(l/min) 3.21 ×VO2(l/m)
4)
VO2max HRmax MFOR Fatmax %HRmax %VO2max
HR VT t
VO2max Pearson %VO2max
HR
VO2 HR
MFOR MFOR %VO2max MFOR %HRmax
SPSS Statistics ver.16 5%
IV.
1)
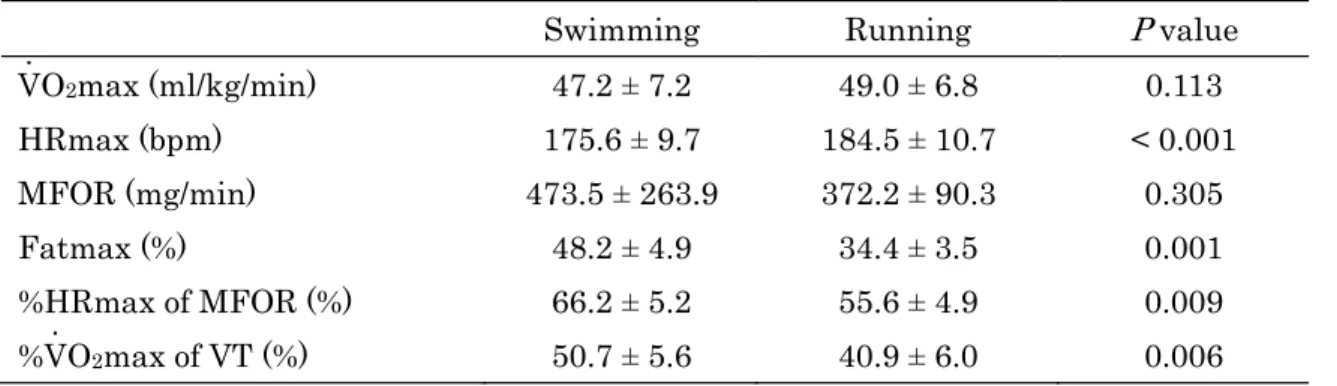
Table 1 3 8 6
1
1 1 2.4 ± 1.8
2.8 ± 2.7
2)
VO2max
( 26.8 ± 2.0 ) 49.2 ± 6.8 ml/kg/min ( 29.1 ± 0.6 ) 47.2 ± 7.2
ml/kg/min (Table 1 4)
VO2max (r = 0.918 = 0.001) HRmax
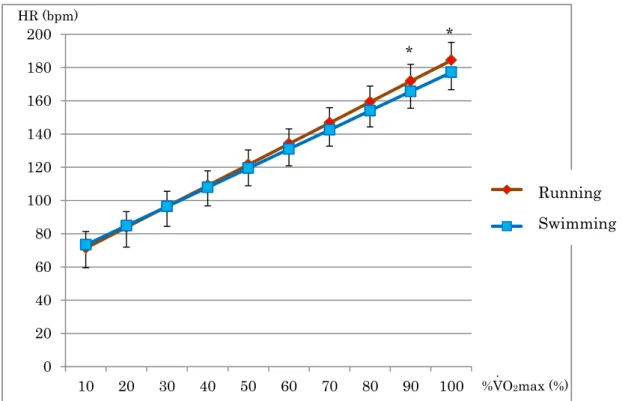
184.5 ± 10.7 bpm (beat per min : / ) 175.6 ± 9.7 bpm ( < 0.001) %VO2max HR
80%VO2max 90%VO2max HR
(Figure 1 4) VT 40.9 ± 6.0%VO2max 50.7 ±
5.6%VO2max ( = 0.006)
3)
MFOR 372.2 ± 90.3 mg/min 473.5 ± 263.9 mg/min
Fatmax 34.4 ± 3.5%VO2max
48.2 ± 4.9%VO2max ( <
0.001)(Table 1 4) MFOR %HRmax 55.6 ±
4.9%VO2max 66.2 ± 5.2%VO2max
( = 0.009) 5% %VO2max
15-30%VO2max
(15% < 0.001 20% < 0.001 25% < 0.001 30% = 0.015) 55%VO2max
( = 0.049) 50 60
65%VO2max
(50% = 0.055 60% = 0.078 65% = 0.060)(Figure 1 5)
V.
Fatmax %VO2max
1
VO2max MFOR Fatmax
MFOR
MFOR %HRmax Fatmax
5%VO2max 15 30%VO2max
55%VO2max 50
65%VO2max
54)92)
92)
Fatmax
VT(AT) 93) VT Fatmax
VT
94)
VT Fatmax
8 5
Fatmax VT
Fatmax 34.8 ± 3.2%VO2max
Fatmax 56-75%VO2max95)-97) Fatmax 47-53%VO2max95)98)99)
Ramp MFOR 38)84)93)100) MFOR
Fatmax 84)
Fatmax
101)
Fatmax95)98)99)
Fatmax95)-97) 3
Ramp
Fatmax 102) 1
88)89) 3 Fatmax
VO2
1 MFOR
Fatmax
2
VO2max 47 ml/kg/min 49 ml/kg/min
28.5 6.4
VO2max 52-55 ml/kg/min 40-42 ml/kg/min 103)
38-40 ml/kg/min 104) VO2max
10-20%
105)106)
VO2max
107) VO2max
108)-111)
112)
VO2max VO2max 110)113)
VO2max VO2max
VO2max
VT
30 1
45
HRmax HRmax VO2max
HRmax 114) HRmax
21)
22)
HRmax
30 1 45
(K4B2; Aquatraine; Cosmed)
HRmax VO2max 115)
HRmax HRmax
VI.
VO2max Fatmax
Fatmax
Fatmax Fatmax
57)
2
4 2
60
I.
75)
75)76)
18)
1
(50-65%VO2max)
55) 66)-69)
2 1
II.
2 60
III.
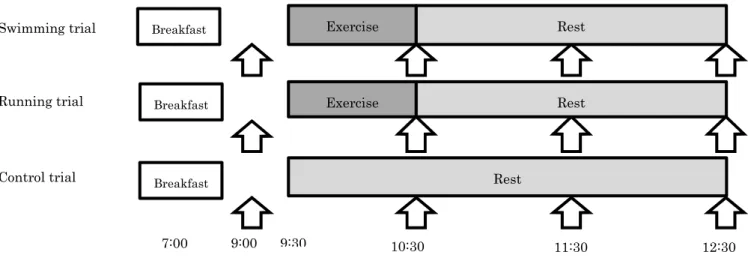
1) (Figure 2 1)
(S) (R) (C) 3
1
7
9 9 30
( ) S R
60 C 60
( ) 60 ( ) ( )
60 120 HR
S S 1 VO2max 65% (65%VO2max) 60
5 1 (DC-5
) ( AE300S
) O2 CO2 HR
(RCX5 )
R R 1 VO2max 65%
(65%VO2max) 60
( AE300S )
30 VO2
(STRESS TEST SYSTEM ML 6500 )
HR
C C 60 120
180
2)
HR
(BC621 )
HR (HEM-77A )
(EUB7500 )
M
(left ventricular end-diastolic dimension LVEDd) (left ventricular ejection fraction LVEF) 1 (stroke volume SV)
(cardiac output CO) 4 E
A (ratio of early to late peak left ventricle filling velocity E/A)
e a (ratio of early to late peak myocardial tissue velocity e E (ratio of peak early ventricle filling velocity to peak early myocardial tissue velocity E/e )
(EDTA-2Na)
( ) ( ) ( )
30
(2420 KUBOTA ) 3500 rpm 10
(-80 C) (hemoglobin Hb)
(hematocrit Ht) (adrenaline AD)
(noradrenaline NAD) (growth hormone GH)
(free fatty acid FFA) HDL-C(high-density lipoprotein cholesterol) LDL-C(low-density lipoprotein cholesterol) (triglyceride TG)
(brain natriuretic peptide BNP) T (cardiac
troponin T cTnT) (lactic acid LA) -
(SRL)
Hb Ht
116)
3)
±
VO2max (HRmax)
S R 2 t
%HRmax HR
3
Post hoc Bonferroni
SPSS Statistics ver.16 5%
IV.
1)
60
VO2 %VO2max S 32.4 ± 3.9 ml/min/kg 66.7 ± 6.7%VO2max R 32.9 ± 3.6 ml/min/kg 67.5 ± 5.7%VO2max
(Table 2 1) %HRmax
2)
S 272.4 ± 157.2mg/min R 130.8 ±
113.6mg/min S ( = 0.020) (Table 2 1)
3)
S R 60 HR
C (Table 2 2) S 60
R 120 C HR (
60 S-C = 0.012 60 R-C = 0.016 120
R-C = 0.009)
60 R C ( = 0.009)
S R 120
( = 0.003 60 < 0.001 120
< 0.001 < 0.001 60 = 0.002
120 < 0.001)
4)
CO S R C (S-C =
0.047 R-C = 0.001) R 60 ( =
0.049) SV LVEF LVEDd S R
(Table 2 3) E/A R C
( = 0.020) (Table 2 4) S E/A C 120
( = 0.023 60 = 0.010 120 = 0.008)
120 (
= 0.012 60 = 0.003 120 = 0.045) (Figure 2 2) e S
60 ( = 0.011) R
C ( = 0.016) S
C ( = 0.049)
60 ( = 0.024 60 =
0.013) E/e
5)
BNP
(Table 2 5 2 6) cTnT
S 120 C ( = 0.047)
(Figure 2 3) AD S C
( = 0.023) NAD S R C
(S-C = 0.002 R-C < 0.001)
(S = 0.012 R < 0.001)
GH S R C (S-C
= 0.019 R-C = 0.001) R
( = 0.005) S 60 C
( = 0.026) S C
( = 0.003) ( = 0.015)
120 ( = 0.038)
HDL-C ( 2 7) LDL-C
S 60 ( =
0.004) TG S R C
(S-C = 0.011 R-C = 0.027) S
( = 0.015) C 180 (60 120 )
( = 0.044) FFA S R
120 (S
= 0.005 S 60 = 0.004 S
120 < 0.001 R = 0.002 R 60 = 0.010
R 120 = 0.002) C 120
(60 + 60 ) 180 (60 + 120 ) (C 120
(60 + 60 ) = 0.007 C 180 (60 + 120 ) = 0.016) S
120 R
120 C
120 S R (
S-C = 0.006 60 S-C = 0.023 120
S-C = 0.001 R-C = 0.001 120
R-C = 0.040 120 S-R = 0.005) (Figure 2 4)
LA S R C
(S-C = 0.044 R-C = 0.012) (Table 2 8) R
120 C
( = 0.024 120 = 0.041) -
S R C
(S = 0.008 R
= 0.011 S-C = 0.018 R-C
= 0.042) R 120 C
( = 0.047)
V.
2 60
2
1
60 5
(Figure 2 5) 1
2 1
60
60
FFA
60 120
GH S C R
AD NAD S R
FFA
FFA /
4
75%VO2max 45 120
117) 120
FFA AD NAD
/
/ S R
S R FFA /
FFA 1
118)
FFA
75%VO2max
119)
65%VO2max
2
60
R S E/A
S R
S
cTnT S 120
21)
22)
NAD
71) 70)
NAD C
AD S C
(double product DP)120)
121 123)
DP
124)
125)
DP
30.0 1.1 26.1 2.2
30 26
126) 50%VO2max
30
1 45
%VO2max
BNP 127)
BNP BNP
cTnT
N BNP(N-terminal pro-brain natriuretic peptide NT-pro BNP)
I(cTnI) 128) NT-pro BNP
cTnI
BNP cTnT
BNP cTnT
cTnT (ACS) cTnT
ACS cTnT 2-3
12-24 2 4-7 2
129) cTn
130) cTn
3-4 24 131)
72 132) cTn
131)
cTn ACS 134) cTnT
131)
cTn ACS
cTn
133) cTn 134)
ACS cTn
135) 136)
137)
138) 139)
cTn cTn
VI.
2 60 2
60
5
I.
1
Fatmax
2 60
60
cTnT
II.
1)
140)
141) QOL 142)
19)
20)
71) 143)
144)
145)
(50-70 ) 146)
60-70%HRreserve 1 30 116-122
(60-75 )
147) 65-78%HRmax 1 30
3
81%HRmax 72%HRreserve 1 60
68) 60-1440
24 55)148)
24
2) ( ) 1
2 60
6
81)
60%HRmax
3 45 10 149)
150)151) 152)
III.
( 60
)
( 60
)
( )
(8 5 )
120
cTnT cTnT
6
4
References
1) :
2013.8.
2) Ohkawara K, Tanaka S, Miyachi M et al: A dose-response relation between aerobic exercise and visceral fat reduction: systematic review of clinical trials. Int J Obes (Lond) 2007, 31:1786-97.
3) Claude B, Steven NB and William H: Physical activity and health-2nd edition.
Human Kinetics 2012:215-28.
4) Grøntved A, Rimm EB, Willett WC et al: Prospective study of weight training and risk of type 2 diabetes mellitus in men. Arch Intern Med 2012, 172:1306-12.
5) 2012 .
6) Sattelmair J, Pertman J, Ding EL et al: Dose response between physical activity and risk of coronary heart disease: a meta-analysis. Circulation 2011, 124:789-95.
7) Diep L, Kwagyan J, Kurantsin-Mills J et al: Association of physical activity level and stroke outcomes in men and women: a meta-analysis. J Womens Health (Larchmt) 2010, 19:1815-22.
8) Inoue M, Yamamoto S, Kurahashi N et al: Daily total physical activity level and total cancer risk in men and women: results from a large-scale population-based cohort study in Japan. Japan Public Health Centerbased Prospective Study Group.
Am J Epidemiol 2008, 168:391-403.
9) 2012-2013.
10) 2009.
11) Rosenbaum S and Sherrington C: Is exercise effective in promoting mental well-being in older age? A systematic review. Br J Sports Med 2011, 45:1079-80.
12) Hagen KB, Dagfinrud H, Moe RH et al: Exercise therapy for bone and muscle health: an overview of systematic reviews. BMC Med. 2012, 10:167.
13) Martin SA, Pence BD and Woods JA: Exercise and respiratory tract viral infections.
Exerc Sport Sci Rev. 2009, 37:157-64.
14) Haskell WL, Lee IM, Pate RR et al: Physical activity and public health: updated recommendation for adults from the American College of Sports Medicine and the American Heart Association. Circulation. 2007, 116:1081-93.
15) Stuck AE, Walthert JM, Nikolaus T et al: Risk factors for functional status decline in community-living elderly people: a systematic literature review. Soc Sci Med.
1999, 48:445-69.
16) No.64 .
17) 2000-2010.
18) Tanaka H: Swimming Exercise. Impact of aquatic exercise on cardiovascular health. Sports Med 2009, 39:377-87.
19) Cider A, Schaufelberger M, Sunnerhagen KS et al: Hydrotherapy--a new approach to improve function in the older patient with chronic heart failure. Eur J Heart Fail 2003, 5:527-35.
20) Cider A, Svealv BG, Tang MS et al: Immersion in warm water induces improvement in cardiac function in patients with chronic heart failure. Eur J Heart Fail 2006, 8:308-13.
21) Svealv BG, Cider A, Tang MS et al: Benefit of warm immersion on biventricular function in patients with chronic heart failure. Cardiovasc Ultrasound 2009, 33:1-8.
22) Wolf D R, Hans-Joachim K, Ulrich B et al: The effect of graded immersion on heart volume, centralvenous pressure, pulmonary blood distribution, and heart rate in man. Pflugers Arch 1978, 374:115-8.
23) 25 2014.7.
24) Yoshimura N, Muraki S, Oka H et al: Prevalence of knee osteoarthritis, lumbar spondylosis, and osteoporosis in Japanese men and women: the research on osteoarthritis/osteoporosis against disability study. J Bone Miner Metab. 2009, 27:620-8.
25) Samuel PJ et al: Reeducation de la coxarthrose. Expansion Scientifique Francaise, Paris 1980:125-132.
26) : 2011,
28:643-9.
27) Bergman BC and Brooks GA: Respiratory gas-exchange ratios during graded exercise in fed and fasted trained and untrained men. J Appl Physiol 1999, 86:479-87.
28) Romijn JA, Coyle EF, Sidossis LS et al: Substrate metabolism during different exercise intensities in endurance-trained women. J Appl Physiol 2000, 88:1707-14.
29) Sidossis LS, Gastaldelli A, Klein S et al: Regulation of plasma fatty acid oxidation during lpw- and high- intensity exercise. Am J Physiol 1997, 272:E1065-70.
30) Martin III W, and Klein S: Use of endogenous carbohydrate and fat as fuels during exercise. Proc Nutr Soc 1998, 57:49-54.
31) Romijn JA, Coyle EF, Sidossis LS: Regulation of endogenous fat and carbohydrate metabolism in relation to exercise intensity and duration. Am J Physiol Endocrinol Metab 1993, 265:E380-91.
32) Coyle EF, Jeukendrup AE, Oseto MC et al: Low-fat diet alters intramuscular substrates and reduces lipolysis and fat oxidation during exercise. Am J Physiol Endocrinol Metab. 2001, 280:E391-8.
33) Horowitz JF, Mora-Rodriguez R, Byerley LO et al: Lipolytic suppression following carbohydrate ingestion limits fat oxidation during exercise. Am J Physiol Endocrinol Metab 1997, 273:E768-75.
34) Holloszy JO and Coyle EF: Adaptations of skeletal muscle to endurance exercise and their metabolic consequences. J Appl physiol 1984, 56:831-8.
35) Stisen AB, Stougaard O, Langfort J et al: Maximal fat oxidation rates in endurance trained and untrained. Eur J Appl Physiol. 2006, 98:497-506.
36) Jeukendrup AE, Mensink M, Saris WH et al: Exogenous glucose oxidation during exercise in endurance-trained and untrained subjects. J Appl Physiol. 1997,
82:835-40.
37) :
1994, 11:57-62.
38) :
1995, 12:839-42.
39) Deriaz O, Dumont M, Bergeron N et al Skeletal muscle low attenuation area and maximal fat oxidation rate during submaximal exercise in male obese individuals.
Int J Obes Relat Metab Disord 2001, 25:1579-84.
40) Venables MC, Achten J and Jeukendrup AE: Determinants of fat oxidation during exercise in healthy men and women a cross-sectional study. J Appl Physiol 2005, 98:160-7.
41) Nordby P, Saltin B and Helge JW: Whole-body fat oxidation determined by graded exercise and indirect calorimetry: a role for muscle oxidative capacity? Scand J Med Sci Sports 2006, 16:209-14.
42) Stisen AB, Stougaard O, Langfort J et al: Maximal fat oxidation rates in endurance trained and untrained women. Eur J Appl Physiol 2006, 98:497-506.
43) Achten , Gleeson M, Jeukendrup AE: Determination of the exercise intensity that elicits maximal fat oxidation. Med Sci Sports Exerc 2002, 34:92-7.
44) Maffeis C, Pellegrino M, Banzato C et al: Nutrient oxidation during moderately intense exercise in obese prepubertal boys. J Clin Endocrinol Metab. 2005, 90:231-6.
45) Schrauwen P, van Aggel-Leijssen DPC, Hul G et al: The effect of a 3-month low-intensity endurance training program on fat oxidation and Acetyl-CoA carboxylase-2 expression. Diabetes 2002, 51:2220-6.
46) Van Aggel-Leijssen DPC, Saris WHM, Wagenmakers AJM et al: Effect of exercise training at different intensities on fat metabolism of obese men. J Appl Physiol.
2002, 92:1300-9.
47) Coyle EF, Jeukendrup AE, Wagenmakers AJM et al: Fatty acid oxidation is directly
regulated by carbohydrate metabolism during exercise. Am J Physiol 1997, 273:E268-75.
48) :
2007, 15:236-42.
49) :
1996, 4:47-50.
50) Horowitz JF, Leone TC, Feng W et al: Effect of endurance training on lipid metabolism in women: a potential role for PPAR in the metabolic response to training. Am J Physiol Endocrinol Metab 2000, 279: E348-55.
51) Perez-Martin A, Dumortier M, Raynaud E et al: Balance of substrate oxidation during submaximal exercise in lean and obese people. Diabetes Metab 2001, 27:
466-74.
52) Ghanassia E, Brun JF, Fedou C et al: Substrate oxidation during exercise: type 2 diabetes is associated with a decrease in lipid oxidation and an earlier shift towards carbohydrate utilization. Diabetes Metab 2006, 32:604-10.
53) Cheneviere X, Malatesta D, Gojanovic B et al: Differences in whole-body fat oxidation kinetics between cycling and running. Eur J Appl Physiol 2010, 109:1037-45.
54) Knechtle B, Muller G, Willmann F et al: Fat oxidation in men and women endurance athletes in running and cycling. Int J Sports Med 2004, 25:38-44.
55) et al: Cardiac fatigue after prolonged exercise.
Circulation 1987, 76:1206-13.
56) Saltin B, Stenberg J: Circulatory response to prolonged severe exercise. J Appl Physiol 1964, 19:833-8.
57) Oxborough D, Birch K, Shave R et al: - --a review of the echocardiographic literature. Echocardiography 2010, 27:1130-40.
58) Shave R, George K, Whyte G et al: Post exercise changes in left ventricular function: the evidence so far. Med Sci Sports Exerc 2008, 10:1393-9.
59) Scott J, Warburton D: Mechanisms underpinning exerciseinduced changes in left ventricular function. Med Sci Sports Exerc 2008, 10:1400-7.
60) Dawson EA, Shave R, Whyte G et al: Preload maintenance and the left ventricular response to prolonged exercise in men. Exp Physiol 2007, 92:383-90.
61) Nagueh SF, Mikati I, Kopelen HA et al: Doppler estimation of left ventricular filling pressure in sinus tachycardia. A new application of tissue Doppler imaging.
Circulation 1998, 98:1644-50.
62) George K, Oxborough D, Forster J et al: Mitral annular myocardial velocity
assessment of segmental left ventricular diastolic function after prolonged exercise in humans. J Physiol 2005, 569:305-13.
63) McGavock JM, Warburton DE, Taylor D et al: The effects of prolonged strenuous exercise on left ventricular function: a brief review. Heart Lung 2002, 31:279-292.
64) Hees PS, Fleg JL, Dong SJ et al: MRI and echocardiographic assessment of the diastolic dysfunction of normal aging: altered LV pressure decline or load? Am J Physiol Heart Circ Physiol 2004, 286:H782-8.
65) Esch BT, Scott JM, Haykowsky MJ et al: Diastolic ventricular interactions in endurance-trained athletes during orthostatic stress. Am J Physiol Heart Circ Physiol 2007, 293:H409-15.
66) Leetmaa TH, Dam A, Glintborg D et al: Myocardial response to a triathlon in male athletes evaluated by Doppler tissue imaging and biochemical parameters. Scand J Med Sci Sports 2008, 18:698-705.
67) Oxborough D, Shave R, Middleton N et al: The impact of marathon running upon ventricular function as assessed by 2D, doppler, and Tissue-Doppler echocardiography. Echocardiography 2006, 23:635-41.
68) Middleton N, Shave R, George K et al: Left ventricular function immediately following prolonged exercise. Med Sci Sports Exerc 2006, 38:681-7.
69) Banks L, Sasson Z, Busato M et al: Impaired left and right ventricular function following prolonged exercise in young athletes: influence of exercise intensity and
responses to dobutamine stress. J Appl Physiol 2010, 108:112-9.
70) Svealv BG, Cider A, Tang MS et al: Benefit of warm water immersion on biventricular function in patients with chronic heart failure. Cardiovascular Ultrasound 2009, 7:1-8.
71) Gabrielsen A, Sorensen VB, Pump B et al: Cardiovascular and neuroendocrine responses to water immersion in compensated heart failure. Am J Physiol Heart Circ Physiol 2000, 279:1931-40.
72) Shave AB, Dawson E, Whyte G et al: The cardiospecificity of the third-generation cTnT assay after exercise-induced muscle damage. Med Sci Sports Exerc 2002, 34:651-4.
73) Ketelhut R, Losem CL, Messerli FH: Is a decrease in arterial pressure during long-term aerobic exercise caused by a fall in cardiac pump function? Am Heart J 1994, 127:567-71.
74) Krupicka J, Janota T, Kasalova Z et al: Effect of short-term maximal exercise on BNP plasma levels in healthy individuals. Physiol Res 2010, 59:625-8.
75) Fletcher GF, Balady GJ, Amsterdam EA et al: Exercise standards for testing and training; a statement for healthcare professionals from the American Heart Association. Circulation 2001, 104:1694-740.
76) Levy CM, Kolin E, Berson BL: Cross training: risk or benefit? An evaluation of injuries in four athlete populations. Sports Med Clin Forum 1986, 3:1-8.
77) Volaklis KA, Spassis AT, Tokmakidis SP: Land versus water exercise in patients with coronary artery disease: effects on body composition blood lipids, and physical fitness. Am Heart J 2007, 154:e1-6.
78) Greene NP, Lambert BS, Greene ES et al: Comparative efficacy of water and land treadmill training for overweight or obese adults. Med Sci Sports Exerc 2009, 41:1808-15.
79) Tanaka H, Clevenqer CM, Jones PP et al: Influence of body fatness on the coronary risk profile or physically active postmenopausal women. Metabolism 1998,
47:1112-20.
80) Pugh LG, Edholm OG: The physiology of channel swimmers. Lancet 1955, 269:761-8.
81) Gwinup G: Weight loss without dietary restriction: Efficacy of different forms of aerobic exercise Am J Sports Med 1987, 15:275-9.
82) Kasch FW: Physiological changes with swimming and running during two years of training. Scand J Sports Sci 1981, 3:23-6.
83) White LJ, Dressendorfer RH, Holland E et al: Increased caloric intake soon after exercise in cold water. Int J Sport Nutr Exerc Metab 2005, 15:38-47.
84) Takagi S, Konishi M, Midorikawa T et al: Influence of different exercise protocols on the exercise intensity that elicits maximal fat oxidation rate. Jpn J Clin Sports Med 2011, 19:272-9.
85) Fox SM, Haskell WL, Naughton JP: Physical activity and prevention of coronary heart-disease. Ann Clin Res 1971, 3:404-32.
86) Tanaka K, Takeshima N, Kato T et al: Critical determinants of endurance performance in middle-aged and elderly endurance runners with heterogeneous training habits. Eur J Appl Physiol 1990, 59:443-9.
87) Howley ET, Bassett DR, Welch HG: Criteria for maximal oxygen uptake: review and commentary. Med Sci Sport Exerc 1995, 27:1292-301.
88) Ogita F, Tabata I: Oxygen uptake during swimming in a hypobaric hypoxic environment. Eur J Appl Physiol 1992, 65:192-6.
89) Aspenes S, Kjendlie PL, Hoff J: Combined strength and endurance training in competitive swimmers. J Sports Sci Med 2009, 8:357-65.
90) Frayn KN: Calculation of substrate oxidation rates in vivo from gaseous exchange.
J Appl Physiol Respir Environ Exerc Physiol 1983, 2:628-34.
91) Beaver WL, Wasserman K and Whipp BJ: A new method for detecting anaerobic threshold by gas exchange. J Appl Physiol 1986, 60:2020-7.
92) Capostagno B and Bosch A: Higher fat oxidation in running than cycling at the same exercise intensities. Int J Sport Nutr Exerc Metab 2010, 20:44-55.
93)
1994, 11:937-42.
94) Pinna M, Milia R, Roberto S et al: Assessment of the specificity of cardiopulmonary response during tethered swimming using a new snorkel device. J Physiol Sci 2013, 63:7-16.
95) Stisen AB, Stougaard O, Langfort J et al: Maximal fat oxidation rates in endurance trained and untrained. Eur J Appl Physiol 2006, 98:497-506.
96) Astorino TA: Is the ventilatory threshold coincident with maximal fat oxidation during submaximal exercise in women? J Sports Med Phys Fitness 2000, 40:209-16.
97) Achten J and Jeukendrup AE: Relation between plasma lactate concentration and fat oxidation rates over a wide range of exercise intensities. Int J Sports Med 2004, 25:32-7.
98) :
2009, 8:47-54.
99) Venables MC, Achten J and Jeukendrup AE: Determinants of fat oxidation during exercise in healthy men and women: a croosection study. J Appl Physiol 2005, 98:160-7.
100) Konishi M, Takahashi M, Endo N et al: Effect of one night of sleep deprivation on maximal fat oxidation during graded exercise. J Phys Fitness Sports Med 2013, 2:121-6.
101) Ferrannini E: The theoretical bases of indirect calorimetry a review.
Metabolism 1988, 37:287-301.
102) Takagi S, Sakamoto S, Midorikawa T et al: Determination of the exercise intensity that elicits maximal fat oxidation in short-time testing. Journal of Sports Sciences 2014, 32:175-82.
103) :
2009, 58:5-6.
104) 2006
18 7 .
105) Dixon RW Jr, Faulkner JA: Cardiac outputs during maximum effort running and swimming. J Appl Physiol 1971, 30:653-6.
106) McArdle WD, Magel JR, Delio DJ: Specificity of run training on VO2max and heart rate changes during running and swimming. Med Sci Sports Exerc 1978, 10:16-20.
107) :
Ventilatory Threshold 1994, 1:99-106.
108) Holmer I, Lundin A, Erikson BO: Maximum oxygen uptake during swimming and running by elite swimmers. J Appl Physiol 1974, 36:711-4.
109) Holmer I: Oxygen uptake during swimming in man. J Appl Physiol 1972, 33:502-9.
110) Holmer I, Astrand PO: Swimming training and maximal oxygen uptake. J Appl Physiol 1972, 33:510-3.
111) Holmer I, Stein EM, Saltin B et al: Hemodynamic and respiratory responses compared in swimming and running. J Appl Physiol 1974, 37:49-54.
112) Tanaka H: Effects of cross-training: transfer of training effects on VO2max between cycling, running and swimming. Sports Med 1994, 18:330-9.
113) Eriksson BO, Holmer I and Lundin A: Physiological effects of training in elite swimmers. In: Eriksson BO, Furberg B, editors. Swimming medicine .
Baltimore(MD): University Park Press, 1978:177-87.
114) DiCarlo LJ, Sparling PB, Millard-Stafford ML et al: Peak heart rates during maximal running and swimming: implications for exercise prescription. Int J Sports Med 1991, 12:309-312.
115) Roels B, Schmitt L, Libicz S et al: Specificity of VO2max and the ventilatory
threshold in free swimming and cycle ergometry: comparison between triathletes and swimmers. Br J Sports Med 2005, 39:965-8.
116) Dill DB, Costill DL: Caculation of percentage changes in volumes of blood, plasma, and red cells in dehydration. J Appl Physiol 1974, 37:247-8.
117) Flynn MG, Costill DL, Kirwan JP et al: Fat storage in athletes: metabolic and hormonal responses to swimming and running. Int J Sports Med 1990, 11:433-40.
118) Lavoie JM, Taylor AW and Montpetit RR: Skeltal muscle fiber size adaptation to an eight-week swimming programme. Eur J Appl Physiol 1980, 44:161-5.
119) Lavoie JM: Blood metabolites during prolonged exercise in swimming and leg cycling. Eur J Appl Physiol 1982, 48:127-33.
120) Gobel FL, Norstrom LA, Nelson RR et al: The rate-pressure product as an index of myocardial oxygen consumption during exercise in patients with angina pectoris. Circulation 1978, 57:549-56.
121) : .
2010, 27:815-22.
122) Elsner R, Franklin DL, Van Citters RL et al: Cardiovascular defense against asphyxia. Sience. 1966, 153:941-9.
123) Olsen CR, Fanestil DD, Scholander PF: Some effects of breath holding and apneic underwater diving on cardiac rhythm in man. J Appl Physiol 1962, 17.461-6.
124) Asahina M, Asahina MK, Yamanaka Y et al: Cardiovascular response during aquatic exercise in patients with osteoarthritis. Am J Phys Med Rehabil 2010, 89:731-5.
125) :
2011, 14:33-7.
126) Migita T, Hotta N, Ogaki T et al: Hormonal and metabolic responses to moderate prolonged water walking comparative study to land walking. J Health Sci 1996, 18:51-6.
127) Shave R, George K, Gaze D: The influence of exercise upon cardiac biomarkers: a practical guide for clinicians and scientists. Curr Med Chem 2007, 14:1427-36.
128) Serrano-Ostariz E, Terreros-Blanco JL, Legaz-Arrese A et al: The impact of exercise duration and intensity on the release of cardiac biomarkers. Scand J Med Sci Sports 2011, 21:244-9.
129) Wu AH, Apple FS, Gibler WB et al: National academy of clinical biochemistry standards of laboratory practice: recommendations for the use of cardiac markers in coronary artery diseases. Clin Chem 1999, 45:1104-21.
130) Wu AH and Ford L: Release of cardiac troponin in acute coronary syndromes:
ischemia or necrosis? Clin Chim Acta 1999, 284:161 74.
131) Tian Y, Nie J, Huang C et al: The kinetics of highly sensitive cardiac troponin T release after prolonged treadmill exercise in adolescent and adult athletes. J Appl Physiol 2012, 113:418-25.
132) Scherr J, Braun S, Schuster T et al: 72-h kinetics of high-sensitive troponin T and inflammatory markers after marathon. Med Sci Sports Exerc 2011, 43:1819-27.
133) Middleton N, George K, Whyte G et al: Cardiac troponin T release is stimulated by endurance exercise in healthy humans. J Am Coll Cardiol 2008, 52:1813-4.
134) Neilan TG, Januzzi JL, Lee-Lewandrowski E et al: Myocardial injury and ventricular dysfunction related to training levels among nonelite participants in the Boston marathon. Circulation 2006, 114:2325-33.
135) Starnes JW and Bowles DK: Role of exercise in the cause and prevention of cardiac dysfunction. Exerc Sport Sci Rev 1995, 23:349-73.
136) Hickman PE, Potter JM, Aroney C et al: Cardiac troponin may be released by ischemia alone without necrosis. Clin Chim Acta 2010, 411:318-23.
137) Sahlin K, Shabalina IG, Mattsson CM et al: Ultraendurance exercise
increases the production of reactive oxygen species in isolated mitochondria from human skeletal muscle. J Appl Physiol 2010, 108:780-7.
138) McNeil PL and Khakee R: Disruptions of muscle fiber plasma membranes.
Role in exercise-induced damage. Am J Pathol 1992, 140:1097-109.
139) Goette A, Bukowska A, Dobrev D et al: Acute atrial tachyarrhythmia induces angiotensin II type 1 receptor-mediated oxidative stress and microvascular flow abnormalities in the ventricles. Eur Heart J 2009, 30:1411-20.
140) Fletcher GF, Balady G, Blair SN et al: Statement on exercise: benefits and recommendations for physical activity programs for all Americans. A statement for health professionals by the Committee on Exercise and Cardiac Rehabilitation of the Council on Clinical Cardiology, American Heart Association. Circulation 1996, 94:857-62.
141) Van Tol BA, Huijsmans RJ, Kroon DW et al: Effects of exercise training on cardiac performance, exercise capacity and quality of life in patients with heart failure: a meta-analysis. Eur J Heart Fail 2006, 8:841-50.
142) Belardinelli R, Georgiou D, Cianci G et al: Randomized, controlled trial of long term moderate exercise training in chronic heart failure: Effects on functional capacity, quality of life, and clinical outcome. Circulation 1999, 99:1173-82.
143) Tei C, Horikiri Y, Park JC et al: Acute hemodynamic improvement by thermal vasodilation in congestive heart failure. Circulation 1995, 91:2582-90.
144) Schmid JP, Noveanu M, Morger C et al: Infuluence of water immersion, water gymnastics and swimming on cardiac output in patients with heart failure. Heart 2007, 93:722-7.
145) Meyer K, Bucking J: Exercise in heart failure: should aqua therapy and swimming be allowed? Med Sci Sports Exerc 2004, 36:2017-23.
146) Cox KL, Burke V, Beilin LJ et al: A comparison of the effects of swimming and walking on body weight, fat distribution, lipids, glucose, and insulin in older women the Sedentary Women Exercise Adherence Trial 2. Metabolism 2010,
59:1562-73.
147) Takeshima N, Roqers ME, Watanabe E et al: Water-based exercise improves health-related aspects of fitness in older woman. Med Sci Sports Exerc 2002, 34:544-51.
148) Lucía A, Serratosa L, Saborido A et al: Short-term effects of marathon running: no evidence of cardiac dysfunction. Med Sci Sports Exerc 1999, 31:1414-21.
149) Tanaka H, Bassett DR Jr and Howley ET: Effect of swim training on body weight, carbohydrate metabolism, lipid and lipoprotein profile. Clinical Physiology 1997, 17:347-59.
150) Zonderland ML, Erich WBM, Peltenburg AL et al: Apolipoprotein and lipid profiles in young female athletes. Int J Sports Med 1984, 5:78-82.
151) Barr SI, Costill DL, Fink WJ : Effect of increased training volume on blood lipids and lipoproteins in male collegiate swimmers. Med Sci Sports Exerc 1991, 23:795-800.
152) Harri M, Kuusela P: Is swimming exercise or cold exposure for rats? Acta Physiol Scand 1986, 126:189-97.
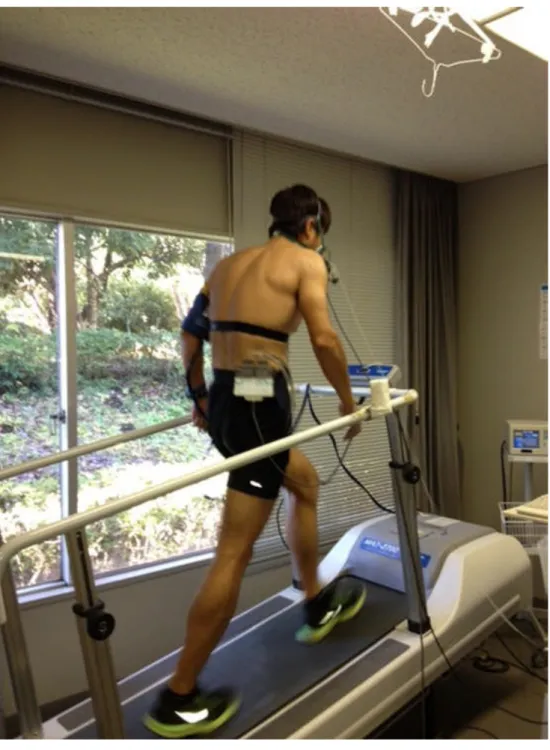
Figure 1-1. Running on a treadmill.
Table 1-1. Ramp protocol for running.
Stage Time (min) Speed (km/hr) Gradient (%)
1 1 1.0 0.0
2 1 1.5 8.2
3 1 2.0 12.4
4 1 2.5 14.8
5 1 3.0 16.4
6 1 3.5 17.5
7 1 4.0 18.3
8 1 4.5 18.9
9 1 5.0 19.3
10 1 5.5 19.7
11 1 6.0 19.9
12 1 6.5 20.2
13 1 7.0 20.3
14 1 7.5 20.4
15 1 8.0 20.5
16 1 8.5 20.6
17 1 9.0 20.7
18 1 9.5 20.7
19 1 10.0 20.7
20 1 10.5 20.7
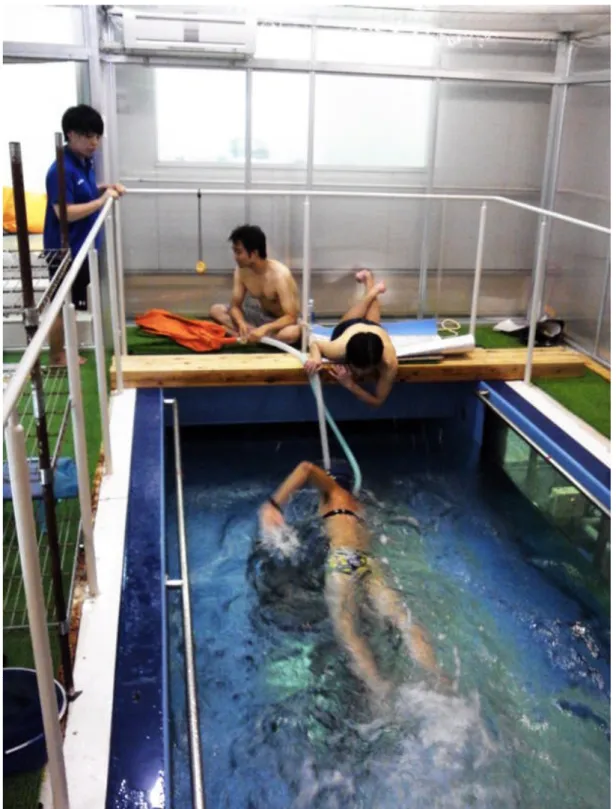
Figure 1-2. Swimming in a swim mill 1.
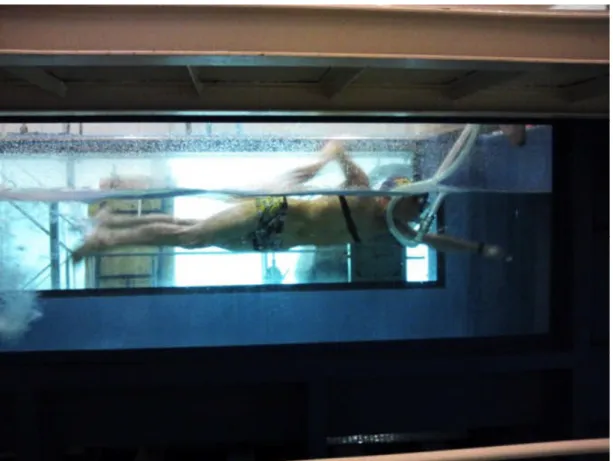
Figure 1-3. Swimming in a swim mill 2.
Table 1-2. Incremental exercise tolerance test protocol for swimming.
Stage Time (min) Speed (m/sec) Number of person of the start point (person)
1 1 0.7
2 1 0.75 1
3 1 0.8 2
4 1 0.85 4
5 1 0.9
6 1 0.95
7 1 1.0 1
8 1 1.05
9 1 1.1
10 1 1.15
11 1 1.2
12 1 1.25
13 1 1.3
14 1 1.35
15 1 1.4
16 1 1.45
17 1 1.5
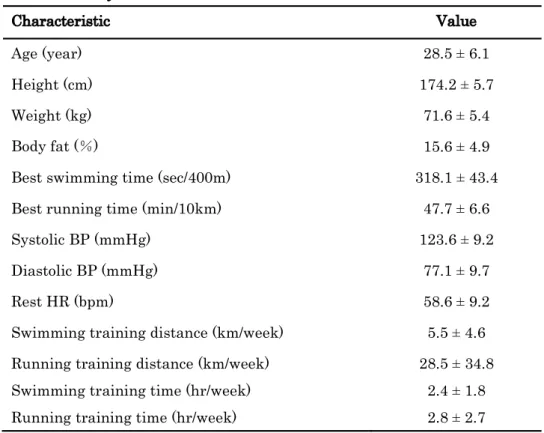
Table 1-3. Physical characteristics.
Characteristic Value
Age (year) 28.5 ± 6.1
Height (cm) 174.2 ± 5.7
Weight (kg) 71.6 ± 5.4
Body fat ( ) 15.6 ± 4.9
Best swimming time (sec/400m) 318.1 ± 43.4
Best running time (min/10km) 47.7 ± 6.6
Systolic BP (mmHg) 123.6 ± 9.2
Diastolic BP (mmHg) 77.1 ± 9.7
Rest HR (bpm) 58.6 ± 9.2
Swimming training distance (km/week) 5.5 ± 4.6 Running training distance (km/week) 28.5 ± 34.8
Swimming training time (hr/week) 2.4 ± 1.8
Running training time (hr/week) 2.8 ± 2.7
Mean ± SD
BP, blood pressure; HR, heart rate
Table 1-4. Aerobic capacity during exercise testing.
Swimming Running value
VO2max (ml/kg/min) 47.2 ± 7.2 49.0 ± 6.8 0.113
HRmax (bpm) 175.6 ± 9.7 184.5 ± 10.7 < 0.001
MFOR (mg/min) 473.5 ± 263.9 372.2 ± 90.3 0.305
Fatmax (%) 48.2 ± 4.9 34.4 ± 3.5 0.001
%HRmax of MFOR (%) 66.2 ± 5.2 55.6 ± 4.9 0.009
%VO2max of VT (%) 50.7 ± 5.6 40.9 ± 6.0 0.006
Mean ± SD
VO2max, maximal oxygen uptake; HRmax, maximal heart rate;
MFOR, maximal fat oxidation rate; Fatmax, %VO2max of MFOR VT, ventilatory threshold
Figure 1-4. Comparison of heart rate during exercise testing.
Mean
±SD
HR, heart rate;VO2max, maximal oxygen uptake
*
indicates a significant difference between swimming and running value ( < 0.05) 020 40 60 80 100 120 140 160 180 200
10 20 30 40 50 60 70 80 90 100
* *
%VO2max (%) HR (bpm)
Running Swimming
Figure 1-5. Comparison of fat oxidation each load during exercise testing.
Mean
±SD
VO2max, maximal oxygen uptake
*
indicates a significant difference between swimming and running value ( < 0.05) 0100 200 300 400 500 600
5 10 15 20 25 30 35 40 45 50 55 60 65 70 75 80 85 90 95 100 treadmill swim mill Fat oxidation (mg/min)
*
*
*
* *
% VO2max (%) Running
Swimming
Figure 2-1. Protocol of experimental trial.
Swimming trial
Running trial
Control trial
7:00 9:00 9:30 10:30 11:30 12:30
Breakfast Exercise
Exercise
Rest
Rest
Rest
Blood sampling, echocardiography, physical measurement Breakfast
Breakfast
Table 2-1. Mean exercise intensity and substrate oxidation during swimming and running trial.
S R value
HR (bpm) 142.9 ± 19.6 146.5 ± 18.1 0.237
%HRmax (%) 81.2 ± 8.9 79.3 ± 7.5 0.246
VO2(ml/min/kg) 32.4 ± 3.9 32.9 ± 3.6 0.179
%VO2max (%) 66.7 ± 6.7 67.5 ± 5.7 0.165
Fat oxidation rate (mg/min) 272.4 ± 157.2 130.8 ± 113.6 0.020 Carbohydrate oxidation (mg/min) 2453.6 ± 540.1 2903.0 ± 346.7 0.020 Mean ± SD
S, Swimming trial; R, Running trial; HR, heart rate; HRmax, maximal heart rate;
VO2, oxygen uptake; VO2max, maximal oxygen uptake
Table 2-2. Heart rate, body weight and blood pressure during swimming, running and control trial.
S R C
HR (bpm) Baseline
Post-Ex 60min 120min
60.6 ± 16.5 84.5 ± 25.5*,§
70.3 ± 20.1*
62.4 ± 18.8
54.8 ± 10.2 90.0 ± 23.8*,§
65.6 ± 16.9*
61.5 ± 13.3*
56.6 ± 11.8 50.5 ± 7.1 49.5 ± 10.9
47.5 ± 7.6 Systolic BP (mmHg) Baseline
Post-Ex 60min 120min
128.8 ± 9.8 130.4 ± 12.6
121.4 ± 6.6 124.4 ± 8.6
124.8 ± 6.1 128.4 ± 14.0
120.5 ± 8.5 121.5 ± 8.6
125.0 ± 7.2 122.4 ± 6.5 124.5 ± 7.1 119.6 ± 6.8 Diastolic BP (mmHg) Baseline
Post-Ex 60min 120min
77.1 ± 10.0 69.4 ± 10.3 72.1 ± 11.3 73.4 ± 11.7
70.1 ± 4.1 75.6 ± 7.4 70.0 ± 7.2*
75.5 ± 9.1
74.9 ± 9.9 71.8 ± 9.0 79.3 ± 9.3 74.5 ± 8.6
BW (kg) Baseline
Post-Ex 60min 120min
71.5 ± 1.9 70.7 ± 1.8§
70.6 ± 1.9§
70.6 ± 1.9§
71.6 ± 1.8 70.5 ± 1.8§
70.5 ± 1.8§
70.4 ± 1.8§
71.2 ± 2.0 71.0 ± 1.9 70.8 ± 1.9 70.4 ± 1.8 Mean ± SD
S, Swimming trial; R, Running trial; C, control trial; Ex, exercise HR, heart rate; BW, body weight; BP, blood pressure
* indicates a significant difference from control value ( < 0.05)
§ indicates a significant difference from baseline value ( < 0.05)
Table 2-3. Left ventricular dimension and systolic function by echocardiography during swimming, running and control trial.
S R C
SV (ml) Baseline
Post-Ex 60min 120min
91.1 ± 10.6 80.0 ± 17.6 87.0 ± 11.0 88.5 ± 12.5
85.7 ± 13.9 88.8 ± 13.3 88.8 ± 11.6 89.2 ± 11.7
89.2 ± 9.3 83.4 ± 8.5 86.0 ± 7.9 89.3 ± 7.7 LVEF (%) Baseline
Post-Ex 60min 120min
67.9 ± 3.5 65.1 ± 5.6 67.4 ± 3.6 67.9 ± 5.8
65.0 ± 3.4 69.0 ± 4.1 67.8 ± 4.6 68.2 ± 4.2
67.6 ± 3.2 66.2 ± 3.5 68.7 ± 4.9 68.8 ± 3.5 CO (L/min) Baseline
Post-Ex 60min 120min
5.2 ± 1.6 6.0 ± 2.3*
5.7 ± 2.1 5.3 ± 2.0
4.7±1.4 6.7±1.8*,§
5.6±1.6*
5.1±1.2
4.9 ± 1.1 4.3 ± 0.9 4.4 ± 0.8 4.4 ± 0.8 LVEDd (mm) Baseline
Post-Ex 60min 120min
52.8 ± 2.3 50.5 ± 4.2 51.8 ± 2.2 52.1 ± 2.9
52.2 ± 2.6 51.8 ± 3.3 52.1 ± 2.6 52.1 ± 2.9
52.4 ± 2.7 51.3 ± 2.1 51.2 ± 1.5 52.0 ± 1.6 Mean ± SD
S, Swimming trial; R, Running trial; C, control trial; Ex, exercise SV, stroke volume; LVEF, left ventricular ejection fraction
CO, cardiac output; LVEDd,left ventricular end-diastolic dimension
* indicates a significant difference from control value ( < 0.05)
§ indicates a significant difference from baseline value ( < 0.05)
Table 2-4. Left ventricle diastolic function by echocardiography during swimming, running and control trial.
S R C
E (cm/s) Baseline Post-Ex 60min 120min
0.86 ± 0.09 0.78 ± 0.22 0.68 ± 0.10§
0.76 ± 0.13§
0.79 ± 0.93 0.73 ± 0.23 0.75 ± 0.14 0.76 ± 0.18
0.78 ± 0.10 0.77 ± 0.78 0.82 ± 0.12 0.76 ± 0.08 A (cm/s) Baseline
Post-Ex 60min 120min
0.43 ± 0.10 0.54 ± 0.18 0.50 ± 0.16 0.49 ± 0.15*
0.44 ± 0.09 0.54 ± 0.16*
0.46 ± 0.14 0.44 ± 0.10*
0.41 ± 0.09 0.38 ± 0.07 0.42 ± 0.08 0.39 ± 0.10 E/A ratio Baseline
Post-Ex 60min 120min
2.06 ± 0.50 1.58 ± 0.52*§
1.48 ± 0.42*§
1.64 ± 0.44*§
1.85 ± 0.37 1.49 ± 0.61*
1.76 ± 0.64 1.84 ± 0.68
1.98 ± 0.52 2.10 ± 0.48 2.02 ± 0.47 2.05 ± 0.60 Baseline
Post-Ex 60min 120min
12.2 ± 2.4 10.7 ± 2.2 10.8 ± 2.6§
10.8 ± 2.2
11.4 ± 1.9 10.0 ± 2.0*
11.2 ± 2.3 11.9 ± 2.9
11.9 ± 2.1 11.5 ± 2.0 11.1 ± 1.8 11.5 ± 2.5 Baseline
Post-Ex 60min 120min
7.3 ± 2.5 9.8 ± 4.1 8.9 ± 3.8 8.5 ± 2.8
7.5 ± 2.7 8.2 ± 3.6 7.4 ± 1.5 8.1 ± 2.4
8.0 ± 2.4 7.3 ± 1.9 7.5 ± 1.6 7.6 ± 2.0 Baseline
Post-Ex 60min 120min
1.86 ± 0.71 1.28 ± 0.54*§
1.41 ± 0.59§
1.45 ± 0.63
1.80 ± 0.90 1.43 ± 0.59 1.63 ± 0.68 1.64 ± 0.71
1.64 ± 0.62 1.71 ± 0.65 1.56 ± 0.53 1.62 ± 0.59 Baseline
Post-Ex 60min 120min
7.3 ± 1.8 7.3 ± 1.8 6.5 ± 1.3 7.3 ± 1.8
7.2 ± 1.4 7.1 ± 1.6 6.8 ± 1.1 6.5 ± 1.2
6.6 ± 0.8 6.9 ± 1.1 7.6 ± 1.1 6.8 ± 1.3 Mean ± SD
S, Swimming trial; R, Running trial; C, control trial; Ex, exercise
E, peak early left ventricle filling velocity; A, peak late left ventricle filling velocity
* indicates a significant difference from control value ( < 0.05)
§ indicates a significant difference from baseline value ( < 0.05)
Figure 2-2. E/A ratio by echocardiography during swimming, running and control trial.
Ex, exercise; E/A ratio, ratio of peak early transmitral flow velocity to peak atrial flow velocity
* indicates a significant difference from control value ( < 0.05)
§ indicates a significant difference from baseline value ( < 0.05)
0 1 2 3 4
Baseline Post-Ex 60min 120min
swim run control
* E/A
§ §
*
*
*
§
Table 2-5. Brain natriuretic peptide and cardiac troponin T concentration during swimming, running and control trial.
S R C
BNP (pg/ml) Baseline Post-Ex 60min 120min
6.8 ± 3.2 9.8 ± 5.1 7.9 ± 3.4 7.3 ± 2.8
8.9 ± 7.7 11.4 ± 9.6
8.7 ± 8.0 9.3 ± 8.2
5.6 ± 3.8 6.2 ± 3.5 6.5 ± 3.8 6.0 ± 4.0 cTnT (ng/ml) Baseline
Post-Ex 60min 120min
0.0036 ± 0.0036 0.0056 ± 0.0043 0.0082 ± 0.0052 0.0120 ± 0.0081*
0.0044 ± 0.0035 0.0053 ± 0.0042 0.0067 ± 0.0044 0.0087 ± 0.0070
0.0048 ± 0.0023 0.0044 ± 0.0023 0.0047 ± 0.0025 0.0043 ± 0.0024 Mean ± SD
S, Swimming trial; R, Running trial; C, control trial; Ex, exercise;
BNP, brain natriuretic peptide; cTnT, cardiac troponin T
* indicates a significant difference from control value ( < 0.05)
Figure 2-3. Troponin T concentration during swimming, running and control trial.
Ex, exercise; cTnT, cardiac troponin T
* indicates a significant difference from control value ( < 0.05)
0 0.005 0.01 0.015 0.02 0.025
Baseline Post-Ex 60min 120min
swim run control
Troponin T (ng/ml)
*
Table 2-6. Adrenaline, noradrenaline, growth hormone cortisol and insulin concentration during swimming, running and control trial.
S R C
AD (pg/ml) Baseline Post-Ex 60min 120min
41.6 ± 26.2 201.4 ± 133.3*
48.2 ± 27.5 35.7 ± 16.6
38.0 ± 18.4 160.9 ± 129.6
50.6 ± 24.0 37.4 ± 12.9
25.5 ± 10.6 24.8 ± 9.1 29.5 ± 7.8 27.5 ± 12.5 NAD (pg/ml) Baseline
Post-Ex 60min 120min
439.9 ± 109.9 1381.0 ± 534.7*,§
435.1 ± 115.2 442.4 ± 115.7
393.4 ± 125.1 1501.7 ± 326.4*,§
390.5 ± 120.4 464.2 ± 213.4
412.5 ± 98.0 399.2 ± 123.7 369.2 ± 128.6 389.9 ± 103.4 GH (ng/ml) Baseline
Post-Ex 60min 120min
1.98 5.30 19.50 11.12*
2.97 1.87*
0.59 0.34
1.17 1.86 13.93 6.23*,§
1.34 0.73 0.33 0.16
0.20 0.25 2.95 5.94 1.33 1.75 0.80 0.76 Cortisol ( /dl) Baseline
Post-Ex 60min 120min
13.0 ± 3.3 17.8 ± 7.9 15.1 ± 6.7 10.6 ± 4.6
10.3 ± 3.0 12.0 ± 4.2 9.7 ± 2.4 8.2 ± 2.1
11.8 ± 2.2 9.3 ± 3.0 8.2 ± 3.8 7.8 ± 3.0 Insulin ( /ml) Baseline
Post-Ex 60min 120min
11.4 ± 6.3 1.6 ± 0.7*,§
4.0 ± 2.2 3.7 ± 2. 5§
8.1 ± 7.4 1.9 ± 1.8 3.7 ± 2.2 2.3 ± 0.6
12.2 ± 11.0 4.6 ± 1.5 3.3 ± 0.8 3.2 ± 1.3 Mean ± SD
S, Swimming trial; R, Running trial; C, control trial; Ex, exercise;
AD, adrenaline; NAD, noradrenaline; GH, growth hormone
* indicates a significant difference from control value ( < 0.05)
§ indicates a significant difference from baseline value ( < 0.05)
Table 2-7. Free fatty acid and lipoprotein cholesterol concentration during swimming, running and control trial.
S R C
FFA ( /l) Baseline Post-Ex 60min 120min
109.9 ± 32.7 585.9 ± 246.3*,§
715.2 ± 295.5*,§
975.4 ± 245.0*,**,§
145.5 ± 89.1 695.1 ± 227.0*,§
610.5 ± 286.3§
662.2 ± 256.1*,**,§
116.1 ± 42.7 171.7 ± 37.7 338.8 ± 140.5§
398.0 ± 178.5§
HDL-C (mg/dl) Baseline Post-Ex 60min 120min
68.4 ± 19.4 66.9 ± 19.0 71.1 ± 19.3 71.1 ± 19.7
66.9 ± 15.7 66.1 ± 16.7 65.6 ± 17.8 69.3 ± 16.4
68.0 ± 19.2 68.5 ± 19.8 69.1 ± 18.7 69.2 ± 19.5 LDL-C (mg/dl) Baseline
Post-Ex 60min 120min
100.8 ± 28.7 99.6 ± 30.7 105.8 ± 29.4§
105.4 ± 32.0
101.0 ± 30.5 99.3 ± 27.7 98.8 ± 32.1 103.8 ± 31.5
104.8 ± 22.3 103.7 ± 21.4 106.0 ± 21.7 106.1 ± 22.6 TG (mg/dl) Baseline
Post-Ex 60min 120min
105.6 ± 31.3 75.4 ± 24.1*,§
76.9 ± 19.9 81.9 ± 42.0
92.9 ± 50.0 71.5 ± 25.8*
68.0 ± 26.3 68.8 ± 25.6
117.5 ± 42.0 108.5 ± 31.2 90.7 ± 31.6 80.0 ± 28.8§
Mean ± SD
S, Swimming trial; R, Running trial; C, control trial; Ex, exercise;
FFA, free fatty acid; HDL-C, high density lipoprotein cholesterol LDL-C, low density lipoprotein cholesterol
TG, triglyceride
* indicates a significant difference from control value ( < 0.05)
** indicates a significant difference between swimming and running value ( < 0.05)
§ indicates a significant difference from baseline value ( < 0.05)
Figure 2-4. FFA concentration during swimming, running and control trial.
Ex, exercise; FFA, free fatty acid
* indicates a significant difference from control value ( < 0.05)
** indicates a significant difference between swimming and running value ( < 0.05)
§ indicates a significant difference from baseline value ( < 0.05) 0
200 400 600 800 1000 1200 1400 1600
Baseline Post-Ex 60min 120min
swim run control
§ § §
§
§
§
§
§
*
* *
*
*
**
FFA Eq/l)
Table 2-8. Lactate acid, acetoacetic acid and -hydroxybutyric acid concentration during swimming, running and control trial.
S R C
LA (mg/dl) Baseline Post-Ex 60min 120min
12.2 ± 6.3 34.8 ± 23.8*
13.4 ± 6.8 10.4 ± 3.1
10.7 ± 1.8 18.3 ± 7.1*
9.9 ± 3.0 8.2 ± 2.9
9.8 ± 3.4 7.3 ± 1.6 8.4 ± 4.4 8.1 ± 5.0 AAcA ( /l) Baseline
Post-Ex 60min 120min
10.9 ± 5.0 27.4 ± 13.7 91.4 ± 94.8 97.2 ± 90.9
15.4 ± 3.38 39.7 ± 21.2*
88.5 ± 74.1 86.0 ± 60.1*
11.9 ± 6.1 13.8 ± 4.0 24.3 ± 15.7 24.9 ± 13.8 HBA ( /l) Baseline
Post-Ex 60min 120min
19.5 ± 8.6 50.4 ± 19.5*,§
243.3 ± 243.6 346.0 ± 330.9
22.4 ± 11.5 78.0 ± 40.1*,§
244.8 ± 213.7 294.9 ± 229.8*
16.4 ± 6.5 21.2 ± 6.2 50.7 ± 37.6 65.0 ± 45.5 Mean ± SD
S, Swimming trial; R, Running trial; C, control trial; Ex, exercise;
LA, lactate acid; AAcA, Acetoacetic acid; HBA, -hydroxybutyric acid
* indicates a significant difference from control value ( < 0.05)
§ indicates a significant difference from baseline value ( < 0.05)
Figure 2-5. Fat oxidation rate each five minutes during exercise testing.
*
indicates a significant difference between swimming and running value ( < 0.05) 0100 200 300 400 500 600 700
Run Swim Fat oxidation rate (mg/min)
5 10 15 20 25 30 35 40 45 50 55 60 Time (min)
*
*
*
*
*
* *