K
+-Cl
-Cotransporter-3a Up-regulates Na
+,K
+-ATPase in Lipid Rafts of Gastric Luminal Parietal Cells *
Takuto Fujii1, Yuji Takahashi1, Yasuo Itomi1, Kyosuke Fujita1, Magotoshi Morii1, Yoshiaki Tabuchi3, Shinji Asano4, Kazuhiro Tsukada2, Noriaki Takeguchi1 and Hideki Sakai1 From the 1Department of Pharmaceutical Physiology and 2Department of Surgery II, Graduate School of
Medicine and Pharmaceutical Sciences, and 3Life Science Research Center, University of Toyama, Toyama 930-0194, Japan, and 4Department of Molecular Physiology, College of Information Science and
Engineering, Ritsumeikan University, Shiga 525-8577, Japan Running title: Up-regulation of Na+,K+-ATPase by KCC3a
Address correspondence to: Prof. Hideki Sakai, Department of Pharmaceutical Physiology, Graduate School of Medicine and Pharmaceutical Sciences, University of Toyama, 2630 Sugitani, Toyama 930-0194, Japan. Tel: +81-76-434-7575; Fax: +81-76-434-5051; E-Mail: [email protected]
Gastric parietal cells migrate from the luminal to the basal region of the gland and they gradually lose acid secretory activity. So far, distribution and function of K+-Cl- cotransporters (KCCs) in gastric parietal cells have not been reported. We found that KCC3a but not KCC3b mRNA was highly expressed and KCC3a protein was predominantly expressed in the basolateral membrane of rat gastric parietal cells located in the luminal region of the glands. KCC3a and Na+,K+-ATPase α1-subunit (α1NaK) were co-immunoprecipitated and both of them were highly localized in a lipid raft fraction.
The ouabain-sensitive K+-dependent ATP-hydrolyzing activity (Na+,K+-ATPase activity) was significantly inhibited by a KCC inhibitor (DIOA). The stable exogenous expression of KCC3a in LLC-PK1 cells resulted in association of KCC3a with endogenous α1NaK and it recruited α1NaK in lipid rafts, accompanying increases of Na+,K+-ATPase activity and ouabain-sensitive Na+ transport activity which were suppressed by DIOA, while the total expression level of α1NaK in the cells was not significantly altered.
On the other hand, the expression of KCC4 induced no association with α1NaK. In conclusion, KCC3a forms a functional complex with α1NaK in the basolateral membrane of luminal parietal cells and it up-regulates α1NaK in lipid rafts, while KCC3a is absent in basal parietal cells.
Cation-chloride cotransporter gene family
Na+-K+-2Cl- cotransporters (NKCCs) and K+-Cl- cotransporters (KCCs). KCCs mediate an electroneutrally-coupled transport of K+ and Cl- and contribute to transepithelial transport and cell volume regulation (1, 2). KCCs are encoded by at least four homologues genes (KCC1-KCC4), and KCC3 has three isoforms (KCC3a-KCC3c) generated by the difference of first coding exons (3-5). KCC1 is widely expressed, whereas KCC2 and KCC3b are restricted in neuron and kidney, respectively. KCC3a and KCC4 are mainly expressed in epithelial cells (3-5).
Among the SLC12 family, Na+-K+-2Cl- cotransporter-1 (NKCC1) is present in the basolateral membrane of gastric parietal cells (6).
NKCC1 was reported to be not involved in the gastric acid (HCl) secretion, but involved in non-acidic electrogenic ion secretions in mouse parietal cells (7, 8). So far, the distribution and function of KCCs have not been reported in the gastric parietal cells.
Lipid rafts are glycosphingolipid- and cholesterol-enriched microdomains and are thought to be the functional domains involved in membrane trafficking and signal transduction (9-11). Recently, it has been reported that some transporters and channels, such as Na+,K+-ATPase (12, 13), Na+/H+ exchanger-3 (NHE3) (14, 15), and epithelial Na+channel (ENaC) (16) are localized in lipid rafts of several tissues. However, little is known about lipid rafts of gastric parietal cells.
In the present study, we studied distribution of KCC3a and association of KCC3a with Na+,K+-ATPase α1-subunit (α1NaK) in the gastric
α1NaK by KCC3a in lipid rafts using the cells stably expressing exogenous KCC3a.
EXPERIMENTAL PROCEDURES Materials- Anti-rat KCC3 rabbit polyclonal antibody was generated with KLH-coupled peptides against 19 amino acids corresponding to the N-terminus sequence of KCC3 (KKARNAYLNNSNYEEGDEY). Both KCC3a and b contain this N-terminus sequence. This antigen peptide has no homology with the sequences of KCC1, 2 and 4. Anti-Na+,K+-ATPase α1-subunit (α1NaK) mouse monoclonal antibody was obtained from Upstate biotech (Lake Placid, NY, USA). Anti-H+,K+-ATPase α-subunit mouse monoclonal antibody (1H9) was from Medical &
Biological Laboratories Co. (Nagoya, Japan).
Anti-flotillin-2 mouse monoclonal antibody (B-6) and anti-human aquaporin-4 (AQP4) goat polyclonal antibody (H-19) were from Santa Cruz Biotechnology (Santa Cruz, CA, USA).
Lipofectamine 2000, anti-Xpress mouse monoclonal antibody, Alexa Fluor 488/546-conjugated anti-mouse IgG antibody, Alexa Fluor 488/546-conjugated anti-rabbit IgG antibody and Alexa Fluor 546-conjugated anti-goat IgG antibody were from Invitrogen (Carlsbad, CA, USA). Ouabain, SCH 28080, methyl-β-cyclodextrin (MβCD) and R-(+)-[(2-n-butyl-6,7-dichloro-2-cyclopentyl-2,3-
dihydro-1-oxo-1H-inden-5-yl)oxy]acetic acid (DIOA) were from Sigma-Aldrich (St. Louis, MO, USA). Protein A-agarose beads was from Pierce (Rockford, IL, USA). Hygromycin B and blasticidin S were obtained from Wako Pure Chemical Industries (Osaka, Japan) and Kaken Pharmaceutical Co. (Tokyo, Japan), respectively.
22NaCl was obtained from PerkinElmer Life Sciences (Boston, MA, USA).
Isolation of tissues and cells- The cell suspension rich in parietal cells and the gastric gland suspension were prepared from rabbit stomach as previously described (17). Human gastric mucosa was obtained from surgical resection of Japanese patients at Toyama University Hospital in accordance with the recommendations of the Declaration of Helsinki and with the ethics committee approval. All patients gave informed
consent.
Northern blotting- Poly A+ RNA of the cells was prepared by using PolyATtract mRNA isolation system II (Promega, Madison, WI, USA). The amplified products were sequenced and used for the preparation of the 32P-labeled cDNA probes.
The rabbit KCC3 probe was 712 bp long and corresponded to nucleotides 806-1507 of the KCC3a cDNA. The poly A+ RNA (2.5 µg) was separated on a 1% agarose/formaldehyde gel and transferred onto a nylon membrane (Zeta-probe GT, Bio-Rad). The membrane was hybridized with the 32P-labelled cDNA fragment for overnight at 65°C in 250 mM NaH2PO4-Na2HPO4
(pH7.2)-7% SDS, washed in 40 mM NaH2PO4-Na2HPO4 (pH7.2)-1% SDS at 65°C, and exposed to the Imaging Plate (Fuji Film) for 20 h.
Plasmid construction- Full-length cDNAs encoding rat KCC3a and rat KCC4 were inserted into pcDNA4/His vector (Invitrogen) by using KpnI/NotI and EcoRI/XbaI restriction sites, respectively (KCC3a-pcDNA4/His vector and KCC4-pcDNA4/His vector) and also inserted into pcDNA5/TO vector (Invitrogen) by using AflII/NotI and AflII/XbaI restriction sites, respectively (KCC3a-pcDNA5/TO vector and KCC4-pcDNA5/TO vector).
Expression of KCC3a and KCC4 in cultured cells- To establish the tetracycline-regulated expression system of KCC3a or KCC4 in LLC-PK1 cells, the cells were cotransfected with pcDNA6/TR vector (Invitrogen), KCC3a-pcDNA5/TO or KCC4-pcDNA5/TO vector by using Lipofectamine 2000 and cultured for 24 h in DMEM supplemented with 10% fetal bovine serum (FBS). The transfected cells were selected in the presence of 800 units/ml hygromycin B and 5 µg/ml blasticidin S. For transient expression of KCC3a in HEK293 cells stably expressing gastric H+,K+-ATPase (18), the cells were transfected with the KCC3a-pcDNA4/His vector by using Lipofectamine 2000 and cultured for 24 h in DMEM supplemented with 10% FBS.
Western blotting- Preparation of membrane fractions and Western blotting were carried out as described previously (19). Signals were visualized with the ECL Plus system (GE Healthcare, Buckinghamshire, UK). To quantify the chemiluminescence signals on the membranes, a
FujiFilm’s LAS-1000 system and the MultiGauge software were used. Anti-KCC3, anti-Xpress and anti-H+,K+-ATPase (1H9) antibodies were used at 1:1,000 dilution and anti-α1NaK antibody was used at 1:10,000 dilution. Anti-flotillin-2 antibody was used at 1:2,000 dilution. For negative control, one volume of each primary antibody was pre-incubated with five volumes of the corresponding blocking peptide. Horse-radish peroxidase-conjugated anti-mouse, anti-rabbit or anti-goat IgG was used as a secondary antibody (1:2,500 dilution).
Immunohistochemistry- The gastric mucosa isolated from rat stomach was embedded in the O.C.T. compound (Sakura Finetechnical Co., Tokyo, Japan) and was cut at 8 µm. The sections were fixed in ice-cold methanol for 7 min at room temperature and were pre-treated with the 3%
bovine serum albumin (BSA) for 1 h at room temperature to block non-specific binding of antibody. Then, they were incubated with anti-KCC3, anti-H+,K+-ATPase (1H9), anti-α1NaK or anti-AQP4 antibody (1:100 dilution) for overnight at 4°C. Alexa Fluor 488-conjugated and Alexa Fluor 546-conjugated anti-IgG antibodies (1:100 dilution) were used as secondary antibodies. Immunofluorescence images were visualized by using a Zeiss LSM 510 laser scanning confocal microscope.
Immunocytochemistry- LLC-PK1 cells were fixed with ice-cold methanol for 7 min and permeabilized with phosphate buffered saline (PBS) containing 0.3% Triton X-100 and 0.1%
BSA for 15 min at room temperature.
Non-specific binding was blocked by 3% BSA.
The permeabilized cells were incubated with the anti-Xpress or anti-α1NaK antibody (1:100 dilution) for overnight at 4°C, and then with the Alexa Fluor 488-conjugated or Alexa Fluor 546-conjugated anti-IgG antibody (1:100 dilution) for 1 h at room temperature. Immunofluorescence images were visualized by using a Zeiss LSM 510 laser scanning confocal microscope.
Isolation of lipid rafts- Membrane proteins were lysed with the ice-cold MBS buffer (150 mM NaCl, 25 mM MES-NaOH, pH 6.5) containing 1% 3-[(3-cholamidopropyl)dimethyl-ammonio]
propanesulfonic acid (CHAPS), 10 µg/ml aprotinin, 10 µg/ml phenylmethylsulfonyl
fluoride, 1 µg/ml leupeptin and 1 µg/ml pepstatin A for 15 min. The solution was mixed with equal volume of 66% sucrose in MBS buffer, and the mixture was placed at the bottom of an ultracentrifuge tube and a discontinuous gradient was formed by overlaying with the 30% sucrose and the 5% sucrose solutions. The sample was centrifuged at 261,000 x g in SW41Ti rotor (Beckman) for 18 h at 4°C. Ten fractions of 1 ml each were collected from the top of the gradient and proteins were precipitated by acetone before SDS-polyacrylamide gel electrophoresis and Western blotting. For depletion of cholesterol, the cells were treated with 10 mM MβCD for 30 min at 37°C before harvesting the cells.
Immunoprecipitation- Membrane fractions of rat gastric mucosa (500 µg of protein) and KCC3a-expressing LLC-PK1 cells (2.5 mg of protein) were solubilized in the 500 µl of lysis buffer (PBS containing 0.5% Triton X-100, 0.1%
BSA and 1 mM EDTA) for 30 min on ice, and centrifuged at 90,000 x g for 30 min at 4°C. The lysate was precleared with protein A-agarose beads and the supernatant was incubated with anti-KCC3 antibody or control rabbit IgG for 24 h at 4°C with end-over-end rotation. The antibody-antigen complexes were incubated with protein A-agarose beads for 4 h at 4°C with end-over-end rotation. Then, the beads were washed three times with the lysis buffer and suspended in SDS sample buffer. The samples were used for Western blotting.
Measurement of Na+,K+-ATPase activity- Na+,K+-ATPase activity of LLC-PK1 (30 µg of protein) and membrane fractions of the rabbit gastric glands (30 µg of protein) and rabbit kidney (3 µg of protein) was measured in a 1 ml of solution containing 120 mM NaCl, 15 mM KCl, 3 mM MgSO4, 1 or 3 mM ATP, 50 µM SCH 28080 and 40 mM Tris-HCl (pH 7.4), in the presence or absence of 100 µM ouabain. After incubation for 10 or 30 min at 37°C, the reaction was terminated by addition of the ice-cold stop solution containing 12% perchloric acid and 3.6%
ammonium molybdate, and inorganic phosphate released was measured (20). The Na+,K+-ATPase activity was calculated as the difference between the activities in the presence and absence of ouabain.
Measurement of phosphorylation level of Na+,K+-ATPase- Ten µg of membrane proteins were phosphorylated in a solution comprising 2 µM [γ-32P]-ATP (4 x 10⁶ cpm), 20 mM NaCl, 0.43 mM MgCl2, and 25 mM imidazole-HCl (pH 6.0) for 20 s at 0°C. The reaction was quenched by the solution containing 10% trichloroacetic acid, 10 mM inorganic phosphate and 1 mM ATP.
Then, the samples were centrifuged at 13,000 x g for 3 min at 4°C, and the pellet was washed with ice-cold 10% TCA, solubilized in a sample buffer comprising 2% SDS, 2.5% dithiothreitol, 10% glycerol and 50 mM Tris-HCl (pH 6.8) and subjected to the 5% SDS-polyacrylamide gel electrophoresis under acidic conditions at pH 6.0 (21, 22). The radioactivity associated with the Na+,K+-ATPase α-subunit separated on the gel was visualized and quantified by a digital autoradiography of the dried gel using Bio-Imaging Analyzer BAS2000 (Fuji Film).
Measurement of H+,K+-ATPase activity- H+,K+-ATPase activity of HEK293 cells (30 µg of protein) was measured in a 1 ml of solution containing 15 mM KCl, 3 mM MgSO4, 1 mM ATP, 5 mM NaN3, 2 mM ouabain and 40 mM Tris-HCl (pH 6.8) in the presence or absence of 50 µM SCH 28080, a specific inhibitor of H+,K+-ATPase. After incubation for 30 min at 37°C, the reaction was terminated by addition of the ice-cold stop solution containing 12%
perchloric acid and 3.6% ammonium molybdate, and inorganic phosphate released was measured (20).
Measurement of 22Na+ transport activity- Na+ transport activity of LLC-PK1 cells was estimated by measuring intracellular 22Na+ content (23, 24).
In each well of 12-well culture plates, 1 x 10⁵ cells equipped with the tetracycline-regulated expression system of KCC3a were seeded and cultured in DMEM supplemented with 10% FBS for 2 days, followed by treatment with or without 2 µg/ml tetracycline for 24 h. The treated cells were incubated at 37°C in the culture medium containing trace amounts of 22Na+ (0.5 µCi/ml) for 120 min to fully equilibrate exchangeable intracellular Na+ with 22Na+. The 22Na+-loaded cells were incubated at 37°C for additional 30 min in the presence and absence of 10 µM ouabain.
Cells were then washed three times with ice-cold
solution of 100 mM MgCl2 and dissolved in 1 ml of the solution containing 1% SDS. 22Na+ contents in the samples were measured in a γ-counter (Aloka AccuFLEXγ7001, Aloka Co., Tokyo, Japan). The Na+ transport activity of Na+,K+-ATPase was estimated as the difference between the intracellular 22Na+ contents in the presence and absence of ouabain.
Statistics- Results are shown as means ± S.E.
Differences between groups were analyzed by one-way ANOVA, and correction for multiple comparisons was made by using Dunnett’s multiple comparison test. Comparison between the two groups was made by using Student’s t test.
Statistically significant differences were assumed at p < 0.05.
RESULTS
Expression of KCC3a in gastric parietal cells.
Northern blotting with the KCC3 cDNA probe gave a strong band of ~8 kb and faint band of ~7 kb in the preparation of rabbit gastric parietal cells (Fig. 1A). The transcript sizes of KCC3a and KCC3b were reported to be around 8 and 7 kb, respectively (25). Western blotting with the anti-KCC3 antibody showed a single band of ~180 kDa in the samples from rats, rabbits and humans (Fig. 1B, upper panel). The specificity of the antibody for the 180 kDa-band was confirmed by using the corresponding blocking peptide (Fig.
1B, lower panel). KCC3b protein was reported to be expressed abundantly in kidney (5), thus we compared the band size of KCC3 expressed in the gastric mucosa with that expressed in the kidney of rats (Fig. 1C). The band size of the gastric mucosa (180 kDa) was apparently greater than that in the kidney (150 kDa). These results suggest that KCC3a mRNA and protein are predominantly expressed in gastric mucosa.
In the immunohistochemistry of isolated rat gastric mucosa, the distribution pattern of KCC3a (Fig. 2, A, C, D and F) was apparently different from that of H+,K+-ATPase (Fig. 2, B, C, E and F). KCC3a was co-localized with Na+,K+-ATPase α1-subunit (α1NaK) (Fig. 2, J-L), suggesting that it is present in the basolateral membrane of gastric parietal cells. The specificity of anti-KCC3 antibody for positive staining was confirmed by
using the blocking peptide (Fig. 2, G-I).
Aquaporin-4 (AQP4) was abundantly expressed in the basal parietal cells (Fig. 2, M and N) as previously reported (26).
Previously, younger parietal cells in the luminal region of the glands have been reported to secrete acid more actively than do older parietal cells in the basal region (27-29). Interestingly, the present double immunostaining of KCC3a and AQP4 in rat gastric mucosa has shown clearly that KCC3a is predominantly expressed in the luminal parietal cells (Fig. 2M).
Association of KCC3a with α1NaK in the gastric mucosa. To study whether KCC3a is associated with α1NaK in rat gastric mucosa, immunoprecipitation was performed by using an anti-KCC3 antibody. The subsequent Western blotting of the immune pellets with an anti-α1NaK antibody gave a clear band for α1NaK (100 kDa), while that with an anti-H+,K+-ATPase antibody gave no band for H+,K+-ATPase (95 kDa) (Fig.
3A). These results suggest that KCC3a is associated with α1NaK in gastric parietal cells.
Distribution of KCC3a and α1NaK in lipid rafts in rat gastric mucosa. Lipid rafts are known to be insoluble for treatment with non-ionic detergents such as Triton X-100 and CHAPS at low temperature and form detergent resistance membrane (DRM) fractions with low density (9).
In the present study, lipid rafts were isolated from rat gastric mucosa by using CHAPS and sucrose gradient. Flotillin-2 was used as a marker for lipid rafts (30, 31). As shown in Fig. 3B, most of KCC3a and α1NaK were distributed in the DRM fractions, in which flotillin-2 was also expressed (Fig. 3B).
Tetracycline-regulated stable expression of KCC3a in LLC-PK1 cells. Next, we constructed the tetracycline-regulated stable expression system of KCC3a in LLC-PK1 cells, a hog kidney proximal tubular cell line (Fig. 4). No significant expression of endogenous KCC3a was observed in control LLC-PK1 cells (data not shown). In this heterologous expression system, exogenous expression of KCC3a protein was assessed by using an anti-Xpress antibody. Expression of KCC3a (180 kDa) was observed in the cells treated with tetracycline (tet-on cells), while no significant expression of KCC3a was observed in
the cells treated without tetracycline (tet-off cells) (Fig. 4A). Both KCC3a and α1NaK were found to be present in the basolateral membrane of the tet-on cells (Fig. 4, F and G). Expression pattern of α1NaK in the tet-on cells was similar to that in the tet-off cells (Fig. 4, D and E).
Distribution of KCC3a and α1NaK in lipid rafts in the heterologous expression system. Lipid rafts were isolated from the tet-on and tet-off cells (Fig. 5). In the tet-off cells, 33.0 ± 4.1% of total α1NaK was in DRM fractions in which flotillin-2 was localized, and 67.0 ± 4.1% of total α1NaK was in non-DRM fractions (Fig. 5, A and C). In the tet-on cells, KCC3a was predominantly distributed in the DRM fractions, and an increased amount of α1NaK (76.9 ± 2.1%) was localized in the DRM fractions (Fig. 5, B and C). These findings suggest that the presence of KCC3a induces a significant recruitment of α1NaK from non-DRM fractions into the DRM fractions.
Furthermore, depletion of cholesterol with MβCD (10 mM) shifted the distributions of both KCC3a and α1NaK from the DRM fractions to the non-DRM fractions (Fig. 5, B and D).
Up-regulation of Na+,K+-ATPase activity by KCC3a. To study whether KCC3a is associated with α1NaK in the tet-on cells as well as the case in the rat gastric mucosa (Fig. 3A), immunoprecipitation was performed by using an anti-KCC3 antibody. The subsequent Western blotting of the immune pellets with an anti-α1NaK antibody gave a single band for α1NaK (100 kDa) (Fig. 6A). The anti-α1NaK antibody gave no band in the immune pellets obtained with the rabbit IgG used as a negative control (Fig. 6A).
Next, we examined the functional relationship between KCC3a and α1NaK. Although the total expression level of α1NaK in the tet-on cells was not significantly different from that in the tet-off cells (Fig. 6B), the ouabain-sensitive K+-ATPase activity (Na+,K+-ATPase activity) in the tet-on cells was significantly greater than that in the tet-off cells (Fig. 6C).
Effects of KCC3a on H+,K+-ATPase activity.
Here, we used HEK293 cells that stably express exogenous H+,K+-ATPase α- and β-subunits (18).
Additional exogenous expression of KCC3a changed neither expression level of H+,K+-ATPase nor the SCH 28080-sensitive K+-ATPase activity
(H+,K+-ATPase activity) in the cells (Supplemental Fig. 1).
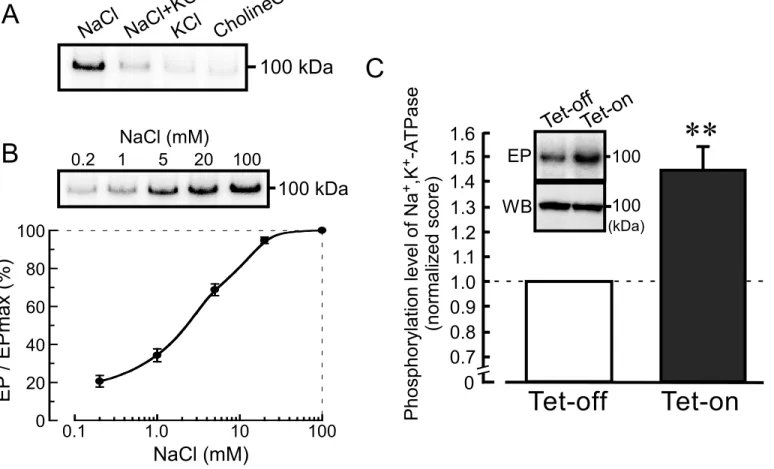
Elevation of phosphorylation level of Na+,K+-ATPase by KCC3a. Na+,K+-ATPase belongs to a P-type ATPase family and forms a phosphorylated intermediates (EP) in the catalytic cycle (32, 33). We studied if the association of KCC3a with α1NaK affects the phosphorylation level of Na+,K+-ATPase. In Fig.7A, membrane fractions of the tet-on cells were phosphorylated with [γ-32P] ATP under the different cationic conditions. The phosphorylated 100-kDa band was detected in the presence of 20 mM NaCl, and this band was diminished by the addition of 20 mM KCl. No phosphorylated band was observed in the presence of 20 mM KCl or 20 mM choline-Cl instead of 20 mM NaCl (Fig. 7A).
Phosphorylated level of the 100-kDa band was elevated by increasing the NaCl concentration, the maximal phosphorylation being observed at 100 mM (Fig. 7B). Figure 7C shows that phosphorylation level of the 100-kDa band in the tet-on cells which express KCC3a is significantly greater than that in the tet-off cells which do not express KCC3a. These results suggest that the phosphorylation level of α1NaK is affected by the expression of KCC3a.
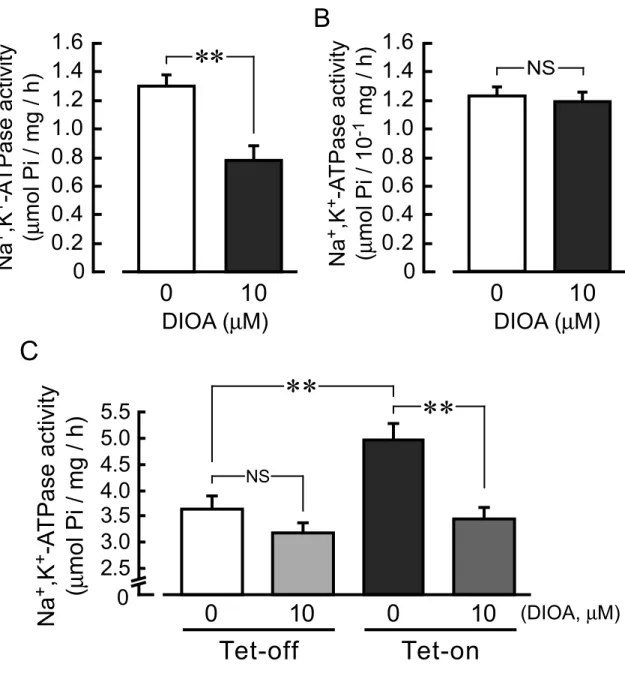
Effects of DIOA, an inhibitor of KCC, on Na+,K+-ATPase activity. DIOA is known as a potent inhibitor of KCCs (IC50 = 10 µM) (34).
Although high concentrations of DIOA (> 30 µM) suppressed Na+,K+-ATPase activity (IC50 = 53-95 µM), no inhibitory effect of this drug on Na+,K+-ATPase was observed at a lower concentration of 10 µM (19). Here, DIOA (10 µM) significantly inhibited the Na+,K+-ATPase activity of rabbit gastric glands (Fig. 8A) in which KCC3a is expressed (Fig. 1B), while it had no significant effect on the Na+,K+-ATPase activity of rabbit kidney (Fig. 8B) in which KCC3b but not KCC3a is expressed (Fig. 1C). These results suggest that Na+,K+-ATPase activity is positively regulated by KCC3a in the gastric parietal cells.
Furthermore, DIOA (10 µM) inhibited the KCC3a-increased Na+,K+-ATPase activity in the tet-on cells, while it had no significant effects on the Na+,K+-ATPase activity in the tet-off cells (Fig. 8C).
Ouabain-sensitive 22Na+ transport activity. To estimate Na+ transport activity of Na+,K+-ATPase in the tet-on and tet-off cells, the ouabain-sensitive change in the intracellular 22Na+ level was measured. Ouabain-sensitive 22Na+ transport activity in the tet-on cells was significantly greater than that in the tet-off cells (Fig. 9). DIOA (10 µM) inhibited the KCC3a-increased Na+ transport activity in the tet-on cells, while it had no significant effects on the Na+ transport activity in the tet-off cells (Fig. 9).
Effect of KCC4 on Na+,K+-ATPase. Finally, we studied effects of the expression of KCC4, which has 66% of amino acid identity compared with KCC3a (2, 3), on the raft distribution of α1NaK and the Na+,K+-ATPase activity. For this purpose, the tetracycline-regulated expression system of KCC4 was constructed in LLC-PK1 cells. No significant expression of endogenous KCC4 was observed in control LLC-PK1 cells (data not shown). KCC4 expression (165 kDa) was observed in the cells treated with tetracycline (tet-on cells), while no significant KCC4 expression was observed in the cells treated without tetracycline (tet-off cells) (Fig. 10A). In the tet-off cells, 35.8 ± 1.5% of total α1NaK was localized in the DRM fractions (Fig. 10, B and D).
In the tet-on cells, KCC4 was highly distributed in the DRM fraction as well as the case for KCC3a (Fig. 10C), and 29.8 ± 4.3% of total α1NaK was localized in the DRM fractions (Fig. 10, C and D).
These findings indicate that the presence and absence of KCC4 did not significantly affect the distribution of α1NaK between the DRM and non-DRM fractions (Fig. 10D). Furthermore, both the total expression level and the activity of Na+,K+-ATPase in the tet-on cells were not significantly different from those in the tet-off cells (Fig. 10, E and F), respectively. These results suggest that KCC4 is not functionally coupled to α1NaK.
DISCUSSION
In the present study, we have found following facts. 1) KCC3a, a longest form of KCC3, is expressed in the basolateral membrane of gastric parietal cells. Interestingly KCC3a is expressed in
the luminal region of the glands and absent in the basal region of the glands. 2) KCC3a is associated with Na+,K+-ATPase α1-subunit (α1NaK) and both of them are highly localized in lipid rafts. 3) The ouabain-sensitive Na+,K+-ATPase activity in rabbit gastric mucosa is significantly inhibited by a KCC inhibitor (10 µM DIOA). 4) In LLC-PK1 cells, the exogenous expression of KCC3a recruits α1NaK into lipid rafts, accompanying increases of Na+,K+-ATPase activity and ouabain-sensitive Na+ transport activity which are suppressed by DIOA.
Furthermore, the expression of KCC3a affects the phosphorylation level of Na+,K+-ATPase. But, the expression of KCC4 does not recruit α1NaK into lipid rafts. 5) In HEK293 cells stably expressing exogenous H+,K+-ATPase, H+,K+-ATPase activity was not affected by additional expression of KCC3a.
It has been suggested that the luminal parietal cells more actively secrete acid than do the basal parietal cells, because the luminal parietal cells have more transcriptional synthesizing activities for H+,K+-ATPase compared with the basal parietal cells (27, 28). For example, the luminal and basal parietal cells were assumed to secrete acid with pH of about 1 and 3, respectively, for the calculation of acid-activated quantity of gastric proton pump inhibitors (29). Furthermore, the secretory surface of luminal parietal cells was found to be greater than that of the basal parietal cells (35). Anion exchanger 2 (AE2), a Cl-/HCO3-
exchanger, was reported to be highly expressed in the basolateral membrane of luminal parietal cells (6) as found here for KCC3a. AE2 is essential for gastric acid secretion in the parietal cells of rabbits (36) and mice (37) and for normal development of secretory canalicular and tubulovesicular membranes of mouse parietal cells (37). We have found that the role of KCC3a in the luminal parietal cells resides in recruitment of α1NaK into the lipid rafts.
In contrast, NKCC1 and aquaporin-4 (AQP4) have been reported to be predominantly localized in the basolateral membrane of basal parietal cells (6, 26). In the mice lacking NKCC1 (7) or AQP4 (38), gastric acid secretion was found to be normal. Thus, downward migration of gastric parietal cells from the generating region to the basal region of the gland is associated with
expression of NKCC1 and AQP4 along with diminution of KCC3a and AE2, reflecting a process that is necessary for establishing different cell functions along the gastric glands. Previously, the parietal cells were proposed to undergo a programmed conversion of their principal function from acidic chloride (HCl) secretion to non-acidic chloride (NaCl or KCl) secretion on their migration (6, 8).
Furthermore, we have found that association of KCC3a with α1NaK in lipid rafts of LLC-PK1 cells increases Na+,K+-ATPase activity, the increment of which was inhibited by DIOA. These findings are interesting from the point of view that the ion transport by the secondary active transporter (KCC3a) up-regulates the primary active pump activity (α1NaK). There is another example that shows a functional coupling between KCC and Na+,K+-ATPase: in mouse brain, Na+,K+-ATPase α2-subunit and neuron-specific KCC2 were reported to be co-immunoprecipitated in purified synaptic membrane and functionally coupled to exclude Cl- from the cytosol in respiratory center neurons (39).
Recently, other examples have been reported that Na+,K+-ATPase plays different roles depending on locations in membrane such as between caveolae and non-caveolae and between different types of lipid rafts. In LLC-PK1 cells, pumping and non-pumping Na+,K+-ATPase are present. The non-pumping Na+,K+-ATPase is associated with Src and/or extracellular signal-regulated kinase and present in caveolae of the cells (24, 40). Once ouabain binds to the non-pumping Na+,K+-ATPase, Src is activated and subsequent tyrosine phosphorylation of multiple effectors occurs (40). The pumping Na+,K+-ATPase is present in non-caveolae domains (24, 40). Over half of Na+,K+-ATPase is estimated to be non-pumping Na+,K+-ATPase (24). Depletion of cholesterol with MβCD in the cells increases the activity of Na+,K+-ATPase because of the conversion of the non-pumping pump into the pumping pump (41). In rainbow trout gill epithelium, Na+,K+-ATPase in the lipid raft enriched in sulfogalactosylceramide (SGC-enriched raft) acts as a normal pump, while the non-SGC/raft-associated Na+,K+-ATPase acts as a Na+-pump (12). These findings suggest that
caveolae and lipid rafts are the microdomains that give multiple functions to Na+,K+-ATPase in the basolateral membrane.
In conclusion, we have found that KCC3a is abundantly expressed in the basolateral membrane of gastric luminal parietal cells and up-regulates the α1NaK activity in lipid rafts. The
disappearance of KCC3a in the basal parietal cells may indicate that KCC3a is involved in the morphological and functional transitions of gastric parietal cells, which occur when the cells migrate
away from their generative region.
REFERENCES 1. Gamba, G. (2005) Physiol. Rev. 85, 423-493
2. Adragna, N. C., Di Fulvio, M., and Lauf, P. K. (2004) J. Membr. Biol. 201, 109-137
3. Mount, D. B., Mercado, A., Song, L., Xu, J., George Jr, A. L., Delpire, E., and Gamba, G. (1999) J.
Biol. Chem. 274, 16355-16362
4. Race, J. E., Makhlouf, F. N., Logue, P. J., Wilson, F. H., Dunham, P. B., and Holtzman, E. J. (1999) Am. J. Physiol. 277, C1210-C1219
5. Pearson, M. M., Lu, J., Mount, D. B., and Delpire, E. (2001) Neuroscience 103, 481-491 6. McDaniel, N., and Lytle, C. (1999) Am. J. Physiol. 276, G1273-G1278
7. Flagella, M., Clarke, L. L., Miller, M. L., Erway, L. C., Giannella, R. A., Andringa, A., Gawenis, L.
R., Kramer, J., Duffy, J. J., Doetschman, T., Lorenz, J. N., Yamoah, E. N., Cardell, E. L., and Shull, G. E. (1999) J. Biol. Chem. 274, 26946-26955
8. McDaniel, N., Pace, A. J., Spiegel, S., Engelhardt, R., Koller, B. H., Seidler, U., and Lytle C. (2005) Am. J. Physiol. Gastrointest. Liver Physiol. 289, G550-G560.
9. Simons, K., and Vaz, W. L. C. (2004) Annu. Rev. Biophys. Biomol. Struct. 33, 269-295 10. Simons, K., and Ikonen, E. (1997) Nature 387, 569-572
11. Polishchuk, R., Di Pentima, A., and Lippincott-Schwartz, J. (2004) Nat. Cell Biol. 6, 297-307 12. Lingwood, D., Harauz, G., and Ballantyne, J. S. (2005) J. Biol. Chem. 280, 36545-36550
13. Welker, P., Geist, B., Frühauf, J. -H., Salanova, M., Groneberg, D. A., Krause, E., and Bachmann, S.
(2007) Am. J. Physiol. Regul. Integr. Comp. Physiol. 292, R1328-R1337
14. Li, X., Galli, T., Leu, S., Wade, J. B., Weinman, E. J., Leung, G., Cheong, A., Louvard, D., and Donowitz, M. (2001) J. Physiol. 537, 537-552
15. Murtazina, R., Kovbasnjuk, O., Donowitz, M., and Li, X. (2006) J. Biol. Chem. 281, 17845-17855 16. Balut, C., Steels, P., Radu, M., Ameloot, M., Van Driessche, W., and Jans, D. (2006) Am. J. Physiol.
Cell Physiol. 290, C87-C94
17. Sakai, H., Ohira, Y., Tanaka, A., Suzuki, T., Ikari, A., Morii, M., and Takeguchi, N. (2003) J.
Physiol. 551, 207-217
18. Kimura, T., Tabuchi, Y., Takeguchi, N., and Asano, S. (2002) J. Biol. Chem. 277, 20671-20677 19. Fujii, T., Ohira, Y., Itomi, Y., Takahashi, Y., Asano, S., Morii, M., Takeguchi, N., and Sakai, H.
(2007) Eur. J. Pharmacol. 560, 123-126
20. Yoda, A., and Hokin, L. E. (1970) Biochem. Biophys. Res. Commun. 40, 880-886
21. Teramachi, S., Imagawa, T., Kaya, S., and Taniguchi, K. (2002) J. Biol. Chem. 277, 37394-37400 22. Imagawa, T., Yamamoto, T., Kaya, S., Sakaguchi, K., and Taniguchi, K. (2005) J. Biol. Chem. 280,
18736-18744
23. Kometiani, P., Liu, L., and Askari, A. (2005) Mol. Pharmacol. 67, 929-936
24. Liang, M., Tian, J., Liu, L., Pierre, S., Liu, J., Shapiro, J., and Xie, Z. -J. (2007) J. Biol. Chem. 282, 10585-10593
25. Mercado, A., Vázquez, N., Song, L., Cortés, R., Enck, A. H., Welch, R., Delpire, E., Gamba, G., and
Mount, D. B. (2005) Am. J. Physiol. Renal. Physiol. 289, F1246-F1261
26. Carmosino, M., Procino, G., Nicchia, G. P., Mannucci, R., Verbavatz, J. -M., Gobin, R., Svelto, M., and Valenti, G. (2001) J. Cell Biol. 154, 1235-1243
27. Bamberg, K., Nylander, S., Helander, K. G., Lundberg, L. G., Sachs, G., and Helander, H. F. (1994) Biochim. Biophys. Acta 1190, 355-359
28. Karam, S. M., Yao, X., and Forte, J. G. (1997) Am. J. Physiol. 272, G161-G171 29. Sachs, G. (2001) Eur. J. Gastroenterol. Hepatol. 13 (Suppl 1), S35-S41
30. Bickel, P. E., Scherer, P. E., Schnitzer, J. E., Oh, P., Lisanti, M. P., and Lodish, H. F. (1997) J. Biol.
Chem. 272, 13793-13802
31. Volonté, D., Galbiati, F., Li, S., Nishiyama, K., Okamoto, T., and Lisanti, M. P. (1999) J. Biol. Chem.
274, 12702-12709
32. Lingrel, J. B., and Kuntzweiler, T. (1994) J. Biol. Chem. 269, 19659-19662 33. Blanco, G., and Mercer, R. W. (1998) Am. J. Physiol. 275, F633-F650
34. Garay, R. P., Nazaret, C., Hannaert, P. A., and Cragoe Jr., E. J. (1988) Mol. Pharmacol. 33, 696-701 35. Helander, H. F., and Sundell, G. W. (1984) Gastroenterology 87, 1064-1071
36. Rossmann, H., Bachmann, O., Wang, Z., Shull, G. E. Obermaier, B., Stuart-Tilley, A., Alper, S. L., and Seidler, U. (2001) J. Physiol. 534, 837-848
37. Gawenis, L. R., Ledoussal, C., Judd, L. M., Prasad, V., Alper, S. L., Stuart-Tilley, A., Woo, A. L., Grisham, C., Sanford, L. P., Doetschman, T., Miller, M. L., and Shull, G. E. (2004) J. Biol. Chem.
279, 30531-30539
38. Wang, K. S., Komar, A. R., Ma, T., Filiz, F., McLeroy, J., Hoda, K., Verkman, A. S., and Bastidas, A. (2000) Am. J. Physiol. Gastrointest. Liver Physiol. 279, G448-G453
39. Ikeda, K., Onimaru, H., Yamada, J., Inoue, K., Ueno, S., Onaka, T., Toyoda, H., Arata, A., Ishikawa, T. -o., Taketo, M. M., Fukuda, A., and Kawakami, K. (2004) J. Neurosci. 24, 10693-10701
40. Tian, J., Cai, T., Yuan, Z., Wang, H., Liu, L., Haas, M., Maksimova, E., Huang, X. -Y., and Xie, Z.
-J. (2006) Mol. Biol. Cell 17, 317-326
41. Wang, H., Haas, M., Liang, M., Cai, T., Tian, J., Li, S., and Xie, Z. (2004) J. Biol. Chem. 279, 17250-17259
FOOTNOTES
* This work was supported in part by Grants-in-Aid for Scientific Research from the Japan Society for the Promotion of Science (#18390064) and the Ministry of Education, Culture, Sports, Science and Technology of Japan (#18059012).
1The abbreviations used are: SLC, solute-linked carrier; NKCC, Na+-Cl- cotransporter; KCC, K+-Cl- cotransporter; NHE, Na+/H+ exchanger; ENaC, epithelial Na+ channel; α1NaK, Na+,K+-ATPase α1-subunit; AQP, aquaporin; MβCD, methyl-β-cyclodextrin; DIOA, R-(+)-[(2-n-butyl-6,7-dichloro-2- cyclopentyl-2,3-dihydro-1-oxo-1H-inden-5-yl)oxy]acetic acid; DMEM, Dulbecco’s modified Eagle’s medium; FBS, fetal bovine serum; BSA, bovine serum albumin; PBS, phosphate-buffered saline; MES, 2-morpholinoethanesulfonic acid; CHAPS, 3-[(3-cholamidopropyl)dimethyl-ammonio]propanesulfonic acid; DRM, detergent resistance membrane; Tet, tetracycline; AE, anion exchanger.
FIGURE LEGENDS
FIGURE 1. Expression of KCC3a in gastric parietal cells. A, Northern blotting was performed with poly A+ RNA (2.5 µg/lane) from isolated rabbit gastric parietal cells. A 8 kb-band was predominantly detected with the KCC3 cDNA probe. B, Western blotting was performed with gastric glands of rabbits (15 µg of protein) and gastric mucosa of rats (50 µg of protein) and humans (100 µg of protein) by using anti-KCC3 antibody. A single band of 180 kDa was observed (upper panel). The 180-kDa band was disappeared in the presence of the corresponding blocking peptide (lower panel). C, Western blotting was performed with gastric mucosa (50 µg of protein) and kidney of rats (100 µg of protein) by using anti-KCC3 antibody. The 180-kDa and 150-kDa bands were observed in gastric mucosa and kidney, respectively.
FIGURE 2. Immunostaining for KCC3a in isolated rat gastric mucosa. (A-C) show the same tissue under a microscope. Similarly, (D-F), (G-I) and (J-L). Double immunostaining was performed with isolated rat gastric mucosa by using anti-KCC3 plus anti-H+,K+-ATPase antibodies (A-I), anti-KCC3 plus anti-Na+,K+-ATPase antibodies (J-L), anti-KCC3 plus anti-AQP4 antibodies (M) and anti-H+,K+-ATPase plus anti-AQP4 antibodies (N). A-F, localizations of KCC3a (A and D), H+,K+-ATPase (B and E), and KCC3a plus H+,K+-ATPase (merged image; C and F) are shown. G-I, anti-KCC3 antibody was pre-treated with the blocking peptide. Localizations of KCC3a (G), H+,K+-ATPase (H), and KCC3a plus H+,K+-ATPase (merged image; I). Positive KCC3a staining was disappeared (G). J-L, localizations of KCC3a (J), Na+,K+-ATPase (K), and KCC3a plus Na+,K+-ATPase (merged image; L). M, localizations of KCC3a (green color) plus AQP4 (red color). N, localizations of H+,K+-ATPase (green color) plus AQP4 (red color). Original magnification: x 20 (A-C, M and N) and x 40 (D-L). Scale bars, 10 µm.
FIGURE 3. Association of KCC3a and α1NaK in rat gastric mucosa. A, immunoprecipitation (IP) was performed with the detergent extracts of rat gastric mucosa by using anti-KCC3 antibody and protein A agarose. The detergent extracts (input; 1/25 (for KCC3) or 1/200 (for α1NaK and αHK) of total protein) and IP samples obtained with and without the antibody (1/20 of IP samples) were detected by Western blotting (WB) using antibodies for KCC3 (upper panel), Na+,K+-ATPase α1-subunit (α1NaK; middle panel) and H+,K+-ATPase α-subunit (αHK; bottom panel). B, lipid raft fractions (DRM) and non-raft fractions (non-DRM) were isolated from membrane fractions of rat gastric mucosa by sucrose gradient (5-40%) as described in Experimental Procedures. Western blotting was performed by using antibodies for KCC3, α1NaK and flotillin-2.
FIGURE 4. Tetracycline-regulated expression system of KCC3a in LLC-PK1 cells. The tetracycline-regulated expression system of KCC3a was introduced to LLC-PK1 cells. The cells were treated with (Tet-on) or without (Tet-off) 2 µg/ml tetracycline. The expression of KCC3a was confirmed by Western blotting (A) and immunocytochemistry (B and C) using anti-Xpress antibody. In the cells, α1NaK was localized in the basolateral membrane (D, E and G). In the tet-on cells, KCC3a was localized in the basolateral membrane (F). Scale bars, 10 µm.
FIGURE 5. Lipid raft analysis of the tetracycline-regulated expression system of KCC3a. A and B, lipid raft fractions (DRM) and non-raft fractions (non-DRM) were isolated from membrane fractions of the LLC-PK1 cells (A, tet-off cells, B, tet-on cells) by sucrose gradient (5-40%) as described in Experimental Procedures. Western blotting was performed by using antibodies for KCC3a (anti-Xpress antibody), α1NaK and flotillin-2. C, expression level of α1NaK in the DRM and non-DRM fractions in the tet-on and tet-off cells. Intensity of the 100-kDa band of α1NaK was measured by densitometry, and percentages of α1NaK in the DRM and non-DRM fractions relative to total amount of α1NaK in the membrane fractions were calculated. n = 3. **, significantly different (p < 0.01). D, the membrane fractions of the tet-on cells were treated with 10 mM MβCD for 30 min at 37°C.
FIGURE 6. Up-regulation of the α1NaK activity by KCC3a. A, immunoprecipitation (IP) was performed with the detergent extracts of the KCC3a-expressing cells (tet-on cells) by using anti-KCC3 antibody and protein A agarose. As control experiments, control rabbit IgG instead of the antibody was used. The detergent extracts (input; 1/75 (for KCC3a) or 1/150 (for α1NaK) of total protein) and IP samples obtained with the IgG ((-); 1/22 of the IP sample) and with the anti-KCC3 antibody (KCC3; 1/22 of the IP sample) were detected by Western blotting using anti-Xpress antibody (detecting for KCC3a; left panel) and anti-α1NaK antibody (right panel). B, the total expression level of α1NaK in the tet-on cells was compared with that in the tet-off cells. In the upper panel, a representative picture of Western blotting is shown. The score for tet-off cells is normalized as 1. n = 8. NS, not significantly different (p > 0.05). C, Na+,K+-ATPase activity in the tet-on and tet-off cells. The score for tet-off cells is normalized as 1. n = 8.
**, significantly different (p < 0.01).
FIGURE 7. Increase in the phosphorylation level of Na+,K+-ATPase by KCC3a. A, a membrane fraction of the tet-on cells was incubated with [γ-32P] ATP in the presence of 20 mM NaCl (NaCl), 20 mM NaCl plus 20 mM KCl (NaCl+KCl), 20 mM KCl (KCl), or 20 mM choline chloride (CholineCl).
Radioactive 100-kDa band was observed only in the presence of 20 mM NaCl. B, increases in the intensity of radioactive 100-kDa band by increasing the NaCl concentration. The level of phosphorylated intermediates (EP) in the presence of 100 mM NaCl is normalized as 100%. n = 3. In the upper panel, a representative picture is shown. C, EP levels of Na+,K+-ATPase in the tet-on and tet-off cells. The EP level was measured in the presence of 20 mM NaCl. The score for tet-off cells is normalized as 1. n = 8.
**, significantly different (p < 0.01). In the upper panels, representative pictures of the phosphorylated α1NaK (EP) and Western blotting for α1NaK (WB) are shown.
FIGURE 8. Effects of DIOA, an inhibitor of KCC, on Na+,K+-ATPase activity. A and B, Na+,K+-ATPase activity in the membrane fractions of gastric glands (A) and kidney (B) of rabbits were measured in the absence and presence of 10 µM DIOA. n = 4. **, significantly different (p < 0.01). NS, not significantly different (p > 0.05). C, Na+,K+-ATPase activity in the absence and presence of 10 µM DIOA were measured in the membrane fractions of the KCC3a-expressing cells (Tet-on) and the KCC3a non-expressing cells (Tet-off). n = 6. **, p < 0.01; NS, not significant (p > 0.05).
FIGURE 9. Up-regulation of the ouabain-sensitive 22Na+ transport activity by KCC3a and inhibition of the KCC3a-increased transport activity by DIOA. Ouabain-sensitive 22Na+ transport activity in the absence and presence of 10 µM DIOA were measured in the KCC3a-expressing cells (Tet-on) and the KCC3a non-expressing cells (Tet-off). The ouabain-sensitive Na+ transport activity in the tet-off cells in the absence of DIOA was calculated to be 4.92 ± 0.05 nmol/105 cells/min (n = 5). The score for tet-off cells in the absence of DIOA is normalized as 1 (open bar). n = 5. *, p < 0.05; **, p < 0.01; NS, not significant (p > 0.05).
FIGURE 10. No association of KCC4 with α1NaK. The tetracycline-regulated expression system of KCC4 was introduced into LLC-PK1 cells. The cells were treated with (Tet-on) or without (Tet-off) 2 µg/ml tetracycline. A, the expression of KCC4 was confirmed by Western blotting using anti-Xpress antibody. B and C, lipid raft fractions (DRM) and non-raft fractions (non-DRM) were isolated from membrane fractions of the KCC4 non-expressing cells (Tet-off; B) and the KCC4-expressing cells (Tet-on; C) by sucrose gradient (5-40%). Western blotting was performed by using antibodies for KCC4 (anti-Xpress antibody), α1NaK and flotillin-2. D, expression level of α1NaK in the DRM and non-DRM fractions in the tet-on and tet-off cells. Intensity of the 100-kDa band of α1NaK (B and C) was measured by densitometry, and percentages of α1NaK in the DRM and non-DRM fractions relative to total amount of α1NaK in the membrane fractions were calculated. n = 3. NS, not significant (p > 0.05). E, the total expression level of α1NaK in the tet-on cells was compared with that in the tet-off cells. In the upper
panel, a representative picture of Western blotting is shown. The score for tet-off cells is normalized as 1.
n = 6. NS, not significant (p > 0.05). F, Na+,K+-ATPase activity in the tet-on and tet-off cells. The score for tet-off cells is normalized as 1. n = 6. NS, not significant (p > 0.05).
Supplemental FIGURE 1. No association of KCC3a with H+,K+-ATPase. A, the expression level of H+,K+-ATPase α-subunit (αHK) in the KCC3a-transfected HEK293 cells (KCC3a) and pcDNA4/His vector-transfected HEK293 cells (mock). The score for mock cells is normalized as 1. n = 8. NS, not significant (p > 0.05). In the upper panel, a representative picture of Western blotting for H+,K+-ATPase is shown. B, H+,K+-ATPase activity in the KCC3a-transfected cells was compared with that in the mock cells. The score for mock cells is normalized as 1. n = 8. NS, not significant (p > 0.05).
250 150 100
rat gas tric mu cos a
rab bit gas tric gla nd s
hu ma n g ast ric mu cos a
(kDa)
+ blocking peptide
250 150 100 (kDa)
250 150 100 (kDa)
rat sto ma ch
rat kid ne y 8.0 kb
A
B
C
7.0 kb
Figure 1
A B C
D E F
G H I
J K L
M N
Figure 2
WB:α1NaK 100 kDa input
IP
KCC3 (-)180 kDa WB: KCC3
A
Flotillin-2 KCC3a
DRM non-DRM
α 1NaK
5% sucrose 40%
180 kDa
100 kDa 45 kDa
B
Figure 3
WB:αHK 95 kDa
5 4 3
2 6 7 8 9 10
1
B C
E F D
basal apical
basal apical
G
A Tet-off Tet-on
Tet -off Tet -on
250 150 100 (kDa)
Figure 4
α1NaK α1NaK
KCC3a KCC3a
KCC3a
α 1NaK
DRM non-DRM Flotillin-2
KCC3a α1NaK
5% sucrose 40%
180 kDa
100 kDa 45 kDa 5
4 3
2 6 7 8 9 10
1 1 2 3 4 5 6 7 8 9 10
DRM non-DRM Flotillin-2
KCC3a α1NaK
5% sucrose 40%
180 kDa
100 kDa 45 kDa
DRM non-DRM
KCC3a
Flotillin-2 α1NaK
5% sucrose 40%
180 kDa
100 kDa 45 kDa 5
4 3
2 6 7 8 9 10
1
A
(Tet-off)C
B
(Tet-on)Figure 5
D
(Tet-on, +MβCD)Tet-off Tet-on
DRM non-DRM
**
0 20 40 60 80 100
DRM non-DRM Expressionlevelofα1NaK (%oftotalfractions)
WB: α1NaK input (-) KCC3 input
WB: Xpress (KCC3a) IP
KCC3 (-)
IP
180 kDa 100 kDa
A
N a
+,K
+-A T P a se a ct iv ity (n o rm a liz e d sc o re ) 1.2
Tet-off Tet-on
1.4 1.3 1.1 1.0 0.9 0.8 0.7
**
0 E xp re ss io n o f α 1 N a K (n o rm a liz e d sc o re )
Tet-off Tet-on
1.2 1.4 1.3 1.1 1.0 0.9 0.8 0.7
NS
100 kDaTet -off Tet -on
0
B C
Figure 6
Figure 7
Na Cl
Na Cl+ KC l KC l
Ch olin eC l 100 kDa
0.2 1 5 20 100 NaCl (mM)
100 kDa
0.1 1.0 10 100
NaCl (mM)
E P / E P m a x (% )
0 20 40 60 80 100
Tet-off Tet-on
1.2 1.4 1.3 1.1 1.0 0.9 0.8 0.7 1.5
1.6
**
PhosphorylationlevelofNa+ ,K+ -ATPase (normalizedscore)
Tet -of f Tet -on
100 100 EP
WB
0
(kDa)
A
B
C
Figure 8
0 0.2 0.4 0.6 0.8 1.0 1.2 1.4 1.6
0 10
DIOA ( µ M)
0 10
DIOA ( µ M)
A B
N a
+,K
+-A T P a se a ct iv ity ( µ m o lP i/ m g / h ) N a
+,K
+-A T P a se a ct iv ity ( µ m o lP i/ 1 0
-1m g / h )
2.5 3.0 3.5 4.0 4.5 5.0 5.5
0 10 0 10
0 (DIOA, µ M)
NS
** **
Tet-off Tet-on
N a
+,K
+-A T P a se a ct iv ity ( µ m o lP i/ m g / h )
C
** NS
0
0.2
0.4
0.6
0.8
1.0
1.2
1.4
1.6
0.7
0 10 0 10
0 (DIOA, µ M)
NS
* **
Tet-off Tet-on O u a b a in -s e n si tiv e
22N a
+tr a n sp o rt a ct iv ity (n o rm a liz e d sc o re )
0.8 0.9 1.0 1.1 1.2 1.3 1.4
Figure 9
Flotillin-2 KCC4 α1NaK
DRM non-DRM
165 kDa 100 kDa 45 kDa
5% sucrose 40%
(Tet-off)
5 4 3
2 6 7 8 9 10
1
DRM non-DRM
Flotillin-2 KCC4 α1NaK
5% sucrose 40%
165 kDa 100 kDa 45 kDa
(Tet-on)
5 4 3
2 6 7 8 9 10
1
0 0.2 0.4 0.6 0.8 1.2
Tet-off Tet-on NS 1.0
Na+,K+-ATPaseactivity (normalizedscore) 0
0.2 0.4 0.6 0.8 1.2
Tet-off Tet-on NS Tet-off
Tet-on
α1NaK 100 kDa
1.0
Expressionofα1NaK (normalizedscore)
Te t-o ff Te t-o n
150 250
100 (kDa)
A B
non-DRM DRM Expressionlevelofα1NaK (%oftotalfractions)
0 20 40 60 80 100
non-DRM DRM Tet-off Tet-on
NS
C
D E F
Figure 10
0 0.2 0.4 0.6 0.8 1.2 1.0
mock KCC3a
ExpressionofH+ ,K+ -ATPase (normalizedscore) NS
mock
KCC3a 100 kDa αHK
0 0.2 0.4 0.6 0.8 1.2 1.0
mock KCC3a
H+ ,K+ -ATPaseactivity (normalizedscore) NS