Development of Body Weight Support System for Gait
Training: Design and Evaluation of the Novel Body Weight
Support System Using Pneumatic Muscle Actuators.
A DISSERTATION SUBMITTED TO THE
GRADUATE SCHOOL OF ENGINEERING AND SCIENCE OF SHIBAURA INSTITUTE OF TECHNOLOGY
by
TRAN VAN THUC
IN PARTIAL FULFILLMENT OF THE REQUIREMENTS FOR THE DEGREE OF
DOCTOR OF ENGINEERING
Acknowledgments
First of all, I would like to express my special gratitude to my supervi-sor, Professor Shin-ichiroh Yamamoto who always trusts and supports me in the whole progress of this course. I have learned from him a lot of new knowledge and, especially, the professional attitude of working. Thanks to his kind support and informative comments, I could finish my Ph.D. dissertation. I am also grateful to every committee mem-bers, Prof. Akihiko Hanafusa, Assoc.Prof. Nobuo Watanabe, Prof. Masahiro Shibata, and Prof. Kengo Ohnishi, for their patience and many valuable comments such that I could improve my thesis and overcome numerous obstacles facing in this research.
me, and let me encouragement in each difficult time of my life.
Saitama, Sept 5, 2017
Abstract
Contents
Dedication i
Abstract iv
Acknowledgments ii
List of Figures viii
List of Tables xiii
1 Introduction 1
1.1 Problem Statement . . . 6
1.2 Objectives . . . 7
1.3 New Findings/Knowledge . . . 7
1.4 Significance of Research . . . 8
1.5 State of the Art . . . 10
1.6 Scopes and Limitations . . . 10
1.7 Outline of the Thesis . . . 11
2 Characterization of the Pneumatic Muscle Actuator 13 2.1 The static Pneumatic Muscle Actuator Characterization . . . 14
2.2 The dynamic Pneumatic Muscle Actuator Characterization . . . . 16
2.3 Conclusion . . . 17
3 Mechanical system design 19 3.1 Introduction . . . 19
CONTENTS
3.3 Mechanical system and disposition of Pneumatic muscle . . . 27
3.4 Conclusion . . . 29
4 Control System 30 4.1 Overview of the control system for Pneumatic Muscle Actuator . 30 4.2 Identification simplified linear model for pneumatic muscle actuator 31 4.3 Control strategy for BWS system . . . 35
4.3.1 COP tracking control scheme . . . 35
4.3.2 PID controller . . . 39
4.4 Control system using LabVIEW Real-time and LabVIEW FPGA 39 4.4.1 Hardware . . . 39
4.4.2 Software . . . 40
4.5 Conclusion . . . 42
5 Result and Discussion 43 5.1 Experiment protocol . . . 43
5.2 Reaction force and unloading force . . . 49
5.3 COP trajectories . . . 55
5.4 COM movements . . . 59
5.5 Discussion . . . 76
5.6 Conclusion . . . 80
6 Conclusion and Future work 82
References 88
List of Figures
1.1 Scheme of BWS apparatus using series of springs [30] [18]. . . 3 1.2 Scheme of the WARD system [10]. . . 4 1.3 The novel mechatronic BWS system using the complicated
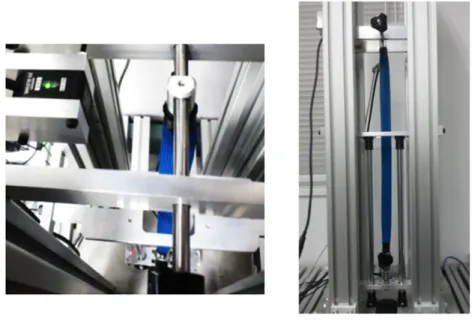
rope-pulley-spring system [24]. . . 5 1.4 A BWS system using electrical motor [29]. . . 5 2.1 Pneumatic artificial muscle (PAM) – McKibben. . . 14 2.2 The Testbed used for conducted experiments to investigate the
characteristic of the pneumatic muscle actuator. . . 15 2.3 Pneumatic muscle characterization: The Force-Pressure relationship. 15 2.4 Dynamic Characterization of Pneumatic Muscle Actuator. . . 17 2.5 Dynamic Characterization of Pneumatic Muscle Actuator: scale
at the range of one second. . . 18 3.1 Scheme of the BWS system using pneumatic muscle actuators is
represented. . . 21 3.2 The prototype of the new BWS system. . . 22 3.3 Scheme for the first idea of the active BWS system which combines
the pulley-rope mechanism and the counter weights. . . 23 3.4 Scheme for the second idea the active BWS system which combines
the pulley-rope mechanism, spring and air cylinder. . . 24 3.5 The linear electric motor. . . 24 3.6 Principle scheme of the Linear elastic actuator. . . 25 3.7 The new design for BWS system using four pneumatic muscle
LIST OF FIGURES
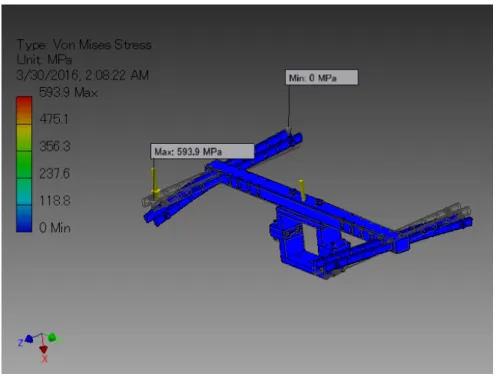
3.8 The most dangerous case since all load concentrate at the furthest position. . . 28 3.9 The Dynamic Simulation result in which the maximum Von Mises
stress reach to 593 Mpa is represented. . . 28 3.10 The maximum displacement is reached to 1.5 mm. . . 29 4.1 Step response of the model and the actual system. . . 33 4.2 Comparison between the estimated force from model and the
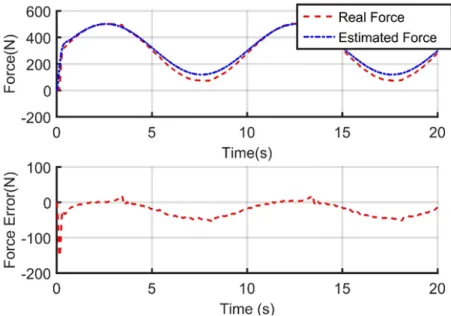
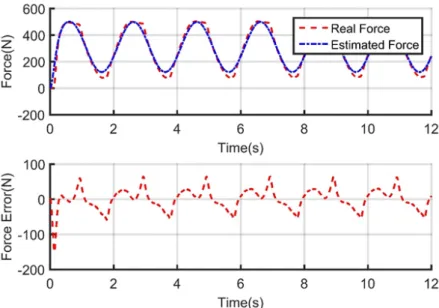
mea-surement force from muscle at frequency 0.1 Hz. . . 33 4.3 Comparison between the estimated force from model and the
mea-surement force from muscle at frequency 0.2 Hz. . . 34 4.4 Comparison between the estimated force from the model and the
measurement force from muscle at frequency 0.5 Hz. . . 34 4.5 Demonstration of COP moving in force plate. . . 35 4.6 Treadmill with four force sensors integrated into four corners. . . 36 4.7 Demonstration of changing the instantaneous value of pressure in
PAMs. . . 37 4.8 Block diagram of proposed tracking COP movement control model. 38 4.9 Block diagram of the PID controller. . . 39 4.10 The main blocks of software program based LabVIEW using for
controlling the BWS system. . . 41 4.11 LabVIEW project and User Interface of the software program for
controlling BWS system. . . 42 5.1 The procedure to calculate vertical ground reaction force (Fz) and
COP movement. . . 45 5.2 COP in one gait cycle and the definition of step width. . . 46 5.3 The method to partition the COM data and to quantify the COM
parameters. . . 47 5.4 COM in mediolateral direction and the definition of the COMy
amplitude in mediolateral. . . 47 5.5 The COM in the vertical direction and the definition of the COMz
LIST OF FIGURES
5.6 Reaction Force When applying BWS system. The black line rep-resents for the normal walking, the blue line reprep-resents for BWS system, and the green line represents for Counter Weight system. From the top to the bottom, the weight support level is 30%, 50%, and 70%, respectively. . . 50 5.7 0.8 . . . 51 5.8 Reaction Force When applying Weight systems. Backline Reaction
Force at 0% is scaled for comparison, Blue Reaction force using the Active system, Green Reaction force using Counter Weight system. From the left to the right, the weight support level is 30%, 50%, and 70%, respectively. . . 52 5.9 The demonstration of the difference of reaction force pattern when
using the weight support systems to reaction force pattern in nor-mal walking of the representative subject. Difference = Fz by weight support system - Fz by normal walking. . . 54 5.10 The adaptation of the unloading force for the BWS system on
the left side. The red line represents for desired unloading force (named Refinput), the blue line represents the actual force. . . 54 5.11 The adaptation of the unloading force for the Counter Weight
sys-tem on the left side. The red line represents for desired unloading force (named Refinput), the blue line represents the actual force. . 55 5.12 COP trajectories of unloading subject weight of the representative
subject. The black line represents for the COP at normal Walking, the Blue line represents for Counter Weight system, and the Green line represents for BWS system. . . 56 5.13 The demonstration of the difference of COP amplitudes in the
frontal direction (step width) of all nine subjects when using the weight support systems at 30% weight support, *** represented the significant value p < 0.001. . . 57 5.14 The demonstration of the difference of COP amplitudes in the
LIST OF FIGURES
5.15 The demonstration of the difference of COP amplitudes in the frontal direction (step width) of all nine subjects when using the weight support systems at 70% weight support, *** represented the significant value p < 0.001. . . 58 5.16 The COM trajectories in three dimensions: sagittal (COMx),
medi-olateral (COMy), and vertical (COMz) for both BWS system and Counter Weight system at the unloading force 20% of subject weight of the representative subject. . . 60 5.17 The COM trajectories in three dimensions: sagittal (COMx),
medi-olateral (COMy), and vertical (COMz) for both BWS system and Counter Weight system at the unloading force 30% of subject weight of the representative subject. . . 61 5.18 The COM trajectories in three dimensions: sagittal (COMx),
medi-olateral (COMy), and vertical (COMz) for both BWS system and Counter Weight system at the unloading force 50% of subject weight of the representative subject. . . 62 5.19 COM of the representative subject with unloading of 20%; left
represent for BWS and right is for CWS. Red represents for COM value of mean + sd; yellow represents for COM value of mean – sd. 64 5.20 COM of the representative subject with unloading of 30%; left
represent for BWS and right is for CWS. Red represents for COM value of mean + sd; yellow represents for COM value of mean – sd. 65 5.21 COM of the representative subject with unloading of 50%; left
represent for BWS and right is for CWS. Red represents for COM value of mean + sd; yellow represents for COM value of mean – sd. 66 5.22 The demonstration of the difference of COM trajectories in frontal
direction when using the weight support systems to COM trajec-tory in the frontal direction in in normal walking. Difference = COM by weight support system - COM normal walking. . . 67 5.23 Demonstrate the comparison of the COMy amplitudes by using the
LIST OF FIGURES
5.24 The demonstration of the difference of COMy amplitude (in medi-olateral) of all subjects when using the weight support systems at 30% weight support, *** represented the significant value p < 0.001. 71 5.25 The demonstration of the difference of COMy amplitude (in
medi-olateral) of all subjects when using the weight support systems at 50% weight support; *** represented the significant value p < 0.001; * represented the significant value p < 0.05. . . 71 5.26 The demonstration of the difference of COMy amplitude (in
medi-olateral) of all subjects when using the weight support systems at 70% weight support, *** represented the significant value p < 0.001. 72 5.27 Demonstrate the unloading force applying to the subject’s trunk. 72 5.28 Demonstration the variance of differences in COM trajectories in
the vertical direction of the representative subject when using the weight support systems to COM trajectory in the vertical direction in in normal walking. Difference = COM by weight support system - COM normal walking. . . 74 5.29 Demonstrate the comparison of the COMz amplitude by using the
BWS support system and Counter weight system at 30%, 50%, and 70% weight support by using ANOVA. *** represented the significant value p < 0.001. . . 77 5.30 The demonstration of the difference of COMz amplitude (in
verti-cal) when using the weight support systems at 30% weight support by using ANOVA, *** represented the significant value p < 0.001. 77 5.31 The demonstration of the difference of COMz amplitude (in
verti-cal) when using the weight support systems at 50% weight support by using ANOVA, *** represented the significant value p <0.001. 78 5.32 The demonstration of the difference of COMz amplitude (in
List of Tables
2.1 Representation of the parameters for static force pressure model of the PMA characterization. . . 16 2.2 Sensibility analysis of fitting curve of the experiment data. . . 16 4.1 The estimated parameters for the continuous model using Matlab. 32 4.2 Representation of the estimated parameter for the discrete model
at sample time equal to 0.001 seconds. . . 32 5.1 Comparison Reaction force between BWS system, counter Weight
system and Normal Walking of the representative subject by Paired t-test. . . 53 5.2 Comparison of the step width (of all nine subjects) between BWS
system, counter Weight system, and Normal Walking by ANOVA. NormalStd, BwsStd, and CwsStd are data of step width standard-ized in cases of Normal walking, BWS system and Counter Weight system respectively. . . 57 5.3 Comparison COM in Y (Frontal) direction between BWS system,
counter Weight system and Normal Walking of the representative subject by Paired t-test. . . 67 5.4 Comparison of the COMy amplitude in mediolateral of all nine
LIST OF TABLES
5.5 Comparison COM in Z (longitudinal) direction between BWS sys-tem, counter Weight system and Normal Walking of the represen-tative subject by Paired t-test. . . 73 5.6 Comparison of the COMz (in vertical) amplitude of all nine
Chapter 1
Introduction
than training for who bearing full weight. In comparison with the conventional therapies and gait training using Treadmill BWS, the clinical results showed that therapy with Treadmill BWS system was more advantaged than the old meth-ods because walking with weight support allowed the patient walking with their desired gait [33]. Other tests were implemented for comparison of BWS method versus conventional methods for stroke patients [26][27][1], spinal cord injury pa-tients [19][5][28]. Many researchers investigated a lot of aspects and parameters influence to training, such as age [3][2], the ground reaction force, the symmetry of gait locus [29][1], and the influence of the degree of weight support to hip, knee and ankle parameters [1][29][32][8]. Almost authors agreed that Treadmill BWS system has many advantages in not only for spinal cord injury patient but also stroke, Parkinson and gait recovery for elderly patients. Recent years, Tread-mill BWS system in conjugation with orthosis robots were applied for many gait training systems to reduce the therapy cost and labor, for example, WAD system [13], DGO system [36], Lokomat [37] [35].
There are some reasons so that the body weight unloading system plays an important role in gait training system. The first reason is by reducing the gravi-tational forces acting on the legs by BWS system would reduce the load needs to be overcome by the patient and then the patient could be stepping movements. The other reason is the use of BWS system may be beneficial, because of its dy-namic characteristic and special task activity which allow the patient to initiate gait training activities in early after injury [22]. Finally, the BWS system also provided the safety conditions and stability for gait training process.
afferent signals to the brain will be increased. In this way, the sensory receptors are activated and improved their functions during the gait cycle.
another Partial BWS system, which characterizes the ability to provide either a constant or synchronously modulated support force, is published by [25]. This system used a linear motor to reduce the gravitational force on the subject body, but this system so cumbersome and not friendly to mount on the gait training system.
Figure 1.2: Scheme of the WARD system [10].
Figure 1.3: The novel mechatronic BWS system using the complicated rope-pulley-spring system [24].
1.1 Problem Statement
adapted, but uncontrollable, with moving of COM during walking. The adapted suspension force is a potential force such as gravitation, elastic force or displace-ment of the cart in the case of using pneumatic cylinder. Limitations of passive systems can be seen that they could not guarantee constant force, and by using a rope-pulley system, the subject could be swung during walking. In contrast, active systems could overcome almost of the limitations of passive systems; they could be sure constant weight support by combining close-loop control system with dynamic roller [24] [23] or electromagnetic motor [29]. Also, Franz et al., suggested that unloading force which was a variation of gait pattern had more efficient than the constant force. However, almost active systems, which were applied the inherent structure in which actuators were connected with subject trunk through a pulley-rope mechanism, had a disadvantage that subject using these systems would be swung. The critical point of gait training is that center of human body always changes in three-dimension space. Franz et al. suggested that synchronizing between gait and force modulation during stance phase could provide more efficient in gait training [29]. However, no study successes modu-late the support force in other dimensions of moving COM as well as consider the movement of the center of pressure (COP).
1.1
Problem Statement
1.2 Objectives
not yet to be extensively investigated and commercially available. Also, as men-tion above, even though there are numerous of BWS system has been developed, the limitations of rope-pulley type are the swinging of COM and difficulty of modulating the unloading force follow the moving of COP during patient gait training. Then authors’ motivation is to design and develop a very simple Body Weight unloading system with its capabilities generating active unloading forces and tracking the COP moving. This thesis focuses on widely activities from system design, control and system assessment for the new system including com-parisons the new Treadmill BWS system and the Counter Weight system (the previous one).
1.2
Objectives
This research embarks on the following objectives:
• i. To design the novel BWS system for gait training and implemented in the AIRGAIT system by using pneumatic artificial muscles.
• ii. To derive and design and validate control scheme for the BWS sys-tem using pneumatic muscles base on real time control syssys-tem and FPGA platform.
• iii. To evaluate the effects of the new strategy implement unloading force based on the new BWS system using motion capture system.
1.3
New Findings/Knowledge
This research will result in new Body Weight unload system and a potential pilot strategy unloading force for locomotion rehabilitation system. Concept and knowledge from this research could lead to new explorations as below:
1.4 Significance of Research
• ii. Derivation of the control strategy and a novel unloading force generated that enables to follow the moving of COP during gait locomotion.
• iii. The new strategy using the Treadmill BWS system for gait training system as well as the alternative for clinical rehabilitation training can be evaluated. The flexible providing unloading force of the new BWS sytem could provide very flexible gait training strategy in clinical practice.
1.4
Significance of Research
1.4 Significance of Research
From the authors observation, intuitively, the rehabilitation device cost is a big problem in the developed country in general as well as for individuals. The lower limb gait training system could be only approached by some big hospital or national rehabilitation center; this then leads to high rehabilitation cost which prevents lower income people could be used, especially in developing countries or develop countries. Another problem is that the expensiveness of rehabilitation devices will prevent their spreading and also home therapy. If the patient could begin therapy sessions quickly, he/she could take a shorter time for recovering. Unfortunately, the more technological and efficient rehabilitation device is the higher cost of the instrument is. It is because the advanced gait training device has been used much expensive and high precision apparatus like electric servo-motor, linearity actuators, and other sophisticated mechanisms. The using of Pneumatic muscle in rehabilitation system is an indisputably competitive advan-tage in comparison with the other apparatuses. Moreover, this actuator could be applied to many rehabilitation devices not only to lower limb rehabilitation device but also to the upper limb rehabilitation device. This kind of actuator could reduce the cost for the health-care instruments which have big meaning for spreading the rehabilitation device and also for developing countries.
mus-1.5 State of the Art
cle allow a patient who disables his/her legs could repetitively follow gait pattern at different speed. The measurement system integrated is to identify the subject’s walking parameters like COM and COP. This information will help therapists an-alyze the health condition of the subject, and then therapist could have specific treatment strategy depending on the level of training.
1.5
State of the Art
In this research, the author proposes an entirely new way to think the rehabil-itation of patient on the treadmill. The author is strongly convinced that the common static BWS systems are not comfortable enough to give good results on the rehabilitation of patients. The main scope of this research is to provide a new designing, validating and assessment for active BWS system to reproduce, in the best way, the behavior of the usual walk. We implemented and compared two different systems, a conventional and new method based on the utilization of PAMs. The main differences between the systems based on PAMs are just under the control of the unloading force. In the active BWS system, the author uses the projection along the frontal axis of the subject’s center of pressure (COP) as an input to give to the patient the freedom to oscillate as during a normal walk. To show the goodness of the proposed active BWS system, author recorded the reaction force, COP path, and COM trajectories of the subject in the imple-mented systems. The results show that the new active BWS system is the best in reproducing the behavior of a normal walk. Future work will focus on giving more freedom to the patient especially by also considering the oscillation on the sagittal axis.
1.6
Scopes and Limitations
1.7 Outline of the Thesis
• ii. All the measurements, control system, experimental tests, and design will be based on the developed BWS gait training system of AIRGAIT exoskeleton.
• iii. The simulation and control design are coded in MATLAB language, while the control system programs are coded using LabVIEW real-time and LabVIEW FPGA. The measurement system is based on Cortex and Motion capture system.
1.7
Outline of the Thesis
The title of this research is ” Development of BWS system for gait training: de-sign and evaluation the novel BWS system using pneumatic muscle actuators.” This section briefly describes the content of the research thesis which consists of six different chapters including introduction, Pneumatic Muscle Actuators Char-acterization, mechanical system design, control system, results and discussion, and conclusions.
• Chapter 1: The first chapter provides a general introduction, overview, and background of the whole research including the problem of the state-ment, specific objectives, scopes and limitation, and outline of the thesis. • Chapter 2: The second chapter is to describe in detailed the Pneumatic
Muscle Characterizations of Pneumatic Muscle Actuator which is developed by our laboratory.
• Chapter 3: The third chapter is the design system and evaluation section for the Treadmill BWS system using Pneumatic Muscle Actuators. All of the mechanical were described thoroughly in this section.
1.7 Outline of the Thesis
input reference for the actuators were described in details. Furthermore, the controller design and the control implementation base on LabVIEW real-time and LabVIEW FPGA were also described.
• Chapter 5: The fifth chapter consists of the results and discussion of this research project. The first sub-topic would describe the experiment design for system validation. After that, several sub-topics delves into the as-sessments evaluation results and analyzing. In this chapter, the validation experiments were designed including BWS system and Counter Weight sys-tem for comparison. The motion capture syssys-tem with six cameras also was used for recording twelve reflexed markers to calculate COM for comparing between the new system and the old one. Moreover, in the experiment as-sessment for the new BWS system, unloading forces, reaction forces, COP (COP) also were recorded at several weight unloading levels for both BWS system and Counter Weight system so that we could have the whole picture of the advantages and disadvantages of the new system.
Chapter 2
Characterization of the
Pneumatic Muscle Actuator
The applied Pneumatic Muscle Actuator with 1.0” [inch] diameter in this work was McKibben braid pneumatic actuator type that has been developed in our laboratory as shown in Figure 2.1. An internal bladder tube of Pneumatic Muscle Actuator was made from rubber and was surrounded by braid mesh. Both ends of the bladder and surrounding layer were attached to the fitting. The input air pressure was separately supplied for each PAM and regulated by single pressure regulator. When PAM is provided pressure with input signal, it would contract and generate force like a bio-muscle.
2.1 The static Pneumatic Muscle Actuator Characterization
Figure 2.1: Pneumatic artificial muscle (PAM) – McKibben.
2.1
The static Pneumatic Muscle Actuator
Char-acterization
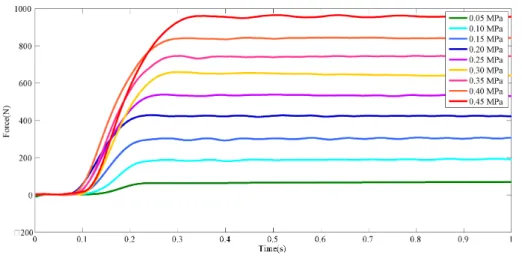
Figure 2.2 shows the experimental set up for conducting the statics characteri-zation. The aim of this experiment is to see the maximum responded force for a specific pneumatic muscle. A characterization of pneumatic artificial muscle was implemented to investigate the behavior of the actuators. The experiment was set up such that both tips of PAM were fixed in a solid frame which has length equals to the free length of PAM; then the pressure was supplied into PAM in equidistant levels of 0.05 MPa and from 0.05 to 0.5 MPa. The measurement system records the output forces for each level of pressure.
2.1 The static Pneumatic Muscle Actuator Characterization
Figure 2.2: The Testbed used for conducted experiments to investigate the char-acteristic of the pneumatic muscle actuator.
2.2 The dynamic Pneumatic Muscle Actuator Characterization
The Table 2.1 represents the parameters for static force pressure model of the PMA characterization. The Root Mean Square Error between the experimental points and the fit equation is computed and showed in Table 2.2 as a function of the degree of the equation. It is possible to see that the error was small even though in the first order of fitting equation. Then fitting equation was chosen as the first order polynomial equation to express the characterization of PAM in the relationship between force and pressure. The reduction of error would be seen in the second order fitting function but not so much in the higher order of equation.
Y = p0∗ X + p1 (2.1)
Table 2.1: Representation of the parameters for static force pressure model of the PMA characterization.
Parameters p0 p1
Value 2447 -56.87
Table 2.2: Sensibility analysis of fitting curve of the experiment data. Degree RMSE R square
1 14.4371 0.9986 2 2.3617 1.0000 3 2.1342 1.0000 4 1.9637 1.0000
2.2
The dynamic Pneumatic Muscle Actuator
Characterization
2.3 Conclusion
a load cell. The data from the dynamic characterization of PMA would be con-sider in the system identification for the control system. The detail of the system identification procedure will be discussed in Chapter 4 The results are shown in Figure 2.4 where we can see that the response of the PMA is very quick and it can be considered appropriate for the specific application. In the Figure 2.5, the dynamic characterization of PMA was depicted clearly. We could observe that the PMA activated after around 100 (ms) and reached to the steady state after 300 (ms). The time delay would affect to the quality of the control system.
Figure 2.4: Dynamic Characterization of Pneumatic Muscle Actuator.
2.3
Conclusion
2.3 Conclusion
Figure 2.5: Dynamic Characterization of Pneumatic Muscle Actuator: scale at the range of one second.
Chapter 3
Mechanical system design
3.1
Introduction
In the third chapter, author discusses the mechanical system design procedure for the BWS system. The first subsection delves some possible method that would apply for the BWS system. In the second subsection, the mechanical system design of the BWS system is discussed in detail.
BWS system has been developed in more than two recent decade for gait train-ing. The conventional BWS systems commonly applied the inherent mechanical structure in which the actuator was used the rope-pulley mechanism connected to subject trunk. The ”pendulum effect” would appear in gait training and made the patient uncomfortable during gait locomotion. In this study, a new BWS sys-tem which applies the PMAs is proposed. The new BWS syssys-tem has a very low cost and simple mechanical system, however, it could overcome every limitation of the previous BWS system.
3.2 Selection of Actuator for BWS system
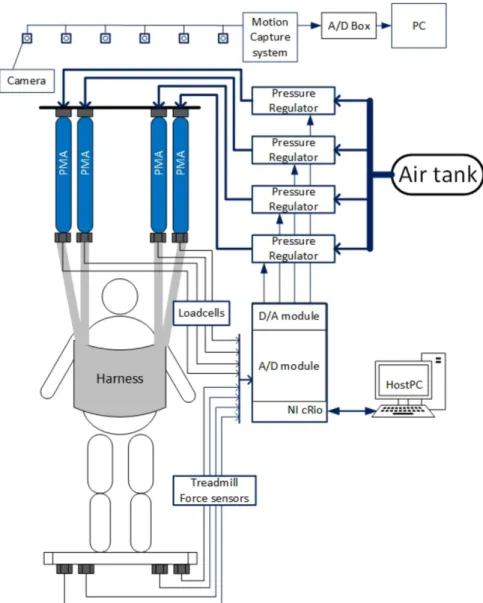
like the human musculoskeletal system (i.e., mono- and bi-articular muscles), see [11] for more details. The design of the mechanical structure of BWS system was described in the previous paper [34]. Currently, the AIRGAIT system employs the National Instrument device – NI cRIO-9176 which utilizes the NI Control and Simulation Module and LabVIEW My Rio software as the operating system. The level of unloading force is inputted in the program in host computer, then the data is transferred by the local network to the real-time computer which is inte-grated FPGA chip. Finally, the command is sent from the real-time computer to FPGA by using FPGA interface functions. The signals from load cells are used to calculate the COP tracking model and generate the reference signals. The control signals are outputted from NI output module to operate the electron-pneumatic regulators (ITV 2050 by SMC). In this system, each of muscle is implemented by a regulator. The measurements by the system (i.e. Force (N)) provide the feedback signal to the controller through A/D input modules from National In-strument. The force sensors are given by KYOWA (LUR – A – 2KNSA1). For each pneumatic actuator also has a small pressure sensor for monitor the pressure inside. The four load cells for measurement of the COP moving are integrated type under the motion base of the treadmill. The treadmill is provided by Force Link.
3.2
Selection of Actuator for BWS system
3.2 Selection of Actuator for BWS system
3.2 Selection of Actuator for BWS system
3.2 Selection of Actuator for BWS system
pneumatic cylinder will adjust the dynamic unloading force which is generated by the movement of the COM. This system has the advantage that is the simple structure and can be absorbed vertical force, but it is a little bit difficult to control and maintain constant unloading, it may be not convenient for the operating of the therapist.
Figure 3.3: Scheme for the first idea of the active BWS system which combines the pulley-rope mechanism and the counter weights.
3.2 Selection of Actuator for BWS system
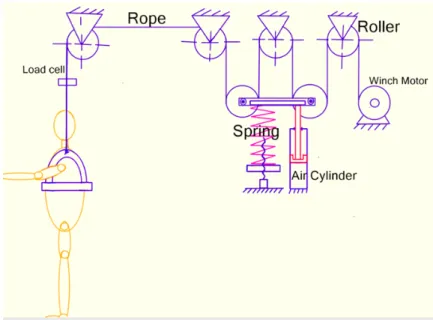
Figure 3.4: Scheme for the second idea the active BWS system which combines the pulley-rope mechanism, spring and air cylinder.
dynamic unloading force which is minuscule, and reducing the oscillation of the counterweight due to the movement of the COM. However, the system is still too complicated because there are many actuators in the scheme and even these actuators are similar capability but are used for the same goal.
Figure 3.5: The linear electric motor.
3.2 Selection of Actuator for BWS system
system, then it would lose the redundant characteristic like spring and difficult to compensate for the dynamic unloading force since the COM suddenly moves up and down.
Some technical information:
• Voltage: 12V DC Linear Actuator. • Stroke Size: 1- 24” (25.4 – 609 mm) • Load Capacity: up to 850 lbs (385.55 kg) • Speed: 0.59”/sec (no load) (14.968 mm/sec) • Type of duty: 20% )
• Operational temp: -250C +650C
• Protection class: IP65 • Certification: CE
• Built-in limit switches, not adjustable. • Product Weight: 9.55 Lbs (4.332 kg)
3.2 Selection of Actuator for BWS system
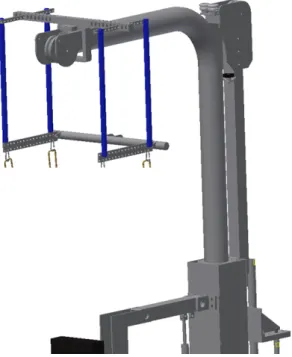
Figure 3.7: The new design for BWS system using four pneumatic muscle actu-ators.
The elastic actuator was also considered for using as the main actuator to adjust the unloading force. The idea of the elastic actuator using electrical actu-ator for BWS system with the principle scheme is shown in Figure 3.6. In gait training, one of the most important things we have to consider is the mechanism to conserve the expenditure energy during walking. That means the gravitational potential energy transfers to the kinetic energy due to the moving of the COM during swing phase. So this actuator has an advantage that it will store potential energy in the first stage of swing phase and restore this energy in the rest stage of swing phase due to the spring element. However, this actuator is still difficult for manufacturing, and maybe the price will be very high. Another limitation of this system is that since connecting one tip to the pulley rope system its capac-ity is only to try to maintain unloading force as constant, it cannot remove the fluctuation due to the pendulum mechanism since a rope connects to the trunk.
3.3 Mechanical system and disposition of Pneumatic muscle
shown in Figure 3.7. Pneumatic muscle is chosen for this BWS system due to its advantages as a high power-weight ratio, high power-to-volume ratio, and inherent compliance. It represents its behavior is very suitable for applying for BWS system since it can be connected directly from base frame to the harness. The pneumatic muscle is very compact, flexible and vigorous; it can easily mount.
3.3
Mechanical system and disposition of
Pneu-matic muscle
The BWS system consists of a huge inverted L-shape beam. Four Stainless steel bars are separated in two couple, and each of couple is mounted in each left or right side of strong steel bar. Four pneumatic muscle actuators are mounted to the steel frame. Each of these muscle has with one tip fixing on the beam and the free tip connecting to harness. The positions for mounting pneumatic muscle actuator are symmetrically arranged so that the total unloading force generated will be balanced and reduce the displacement of the mounting point as well as the vibration during operation. The designing and dynamic simulation analyzing are implemented by using Inventor software by Autodesk. The detail for the design is introduced in Appendix A. The simulation analyzing is conducted for the most dangerous case since all the load is concentrated at the furthest position as shown in Figure 3.8.
3.3 Mechanical system and disposition of Pneumatic muscle
Figure 3.8: The most dangerous case since all load concentrate at the furthest position.
3.4 Conclusion
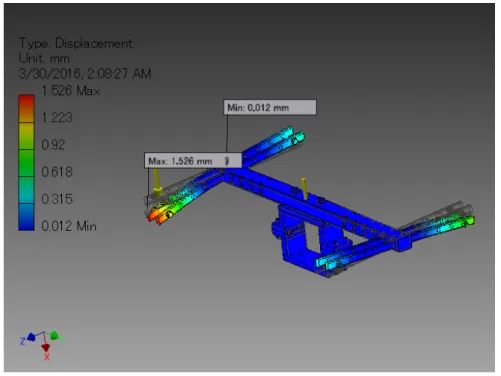
Figure 3.10: The maximum displacement is reached to 1.5 mm.
3.4
Conclusion
Chapter 4
Control System
4.1
Overview of the control system for
Pneu-matic Muscle Actuator
4.2 Identification simplified linear model for pneumatic muscle actuator
model and PI model [4] [12]. Most of these models tried to interpret the hysteresis model and apply to the very high precise position control system [15] [31]. These models are too difficult to implement in real-time control because of heavy com-putation for each cycle time. Moreover, in this research, position precise control of PAM is not in scope, instead, force-pressure control is considered because of the characteristic of unloading system which does not require the too accurate value of unloading force. Control design in this chapter is to consider to the simplified linear model so that the controller can reduce the time computing in each cycle time.
4.2
Identification simplified linear model for
pneu-matic muscle actuator
In this section, a Pneumatic muscle actuator model is obtained by linear iden-tification method. An experiment was set up for dynamic system ideniden-tification. The experiment setup was similar the experiment for investigation the mechan-ical properties of the Pneumatic muscle. It means the object muscle was fixed both two tips in nominal length. A step function pressure signal was supplied inside the muscle. Measurement system would collect the force responded by the muscle. After that, the sine wave pressure signals were also provided in several frequencies. The aim of these experiments was to validate the estimated model later. Then, the collected results were analyzed using MATLAB for identifying the model using Linear Model Identification module integrated. For simplify, transfer function model with no zero and two poles was selected.
The continuous linear transfer function is represented by:
Y (s) = b0
a0 + a1s + a2s2
∗ U (s) (4.1)
In this equation: Y(s), and U(s) is the output signal and input signal in frequency domain. a0, a1, a2, and b0 represent for coefficient parameters of the
4.2 Identification simplified linear model for pneumatic muscle actuator
Table 4.1: The estimated parameters for the continuous model using Matlab. Parameters a0 a1 a2 b0
Value 116.3 15.95 1.000 27.83
Discrete the derived continuous linear transfer function, from the equation 5.1 we have:
Y (z) = b
0
0+ b01z−1+ b02z−2
a00 + a01s + a02s2 ∗ U (z) (4.2)
In this model Y(z) and U(z) are discrete output and input signals. a00, a01, a02, b00, b01, and b02 represent for coefficient parameters of the denominator and numerator polynomial.
Table 4.2: Representation of the estimated parameter for the discrete model at sample time equal to 0.001 seconds.
Parameters a00 a01 a20 b00 b01 b02 Value 1.000 -1.984 0.984 0.000 1.3845-05 1.377e-05 Table 4.1 and Table 4.2 represent the parameters estimated for the Pneumatic muscle actuator model since considering to force and pressure. Figure 4.1 shows the fitting of pneumatic muscle model and the measurement data. The calculation showed the fit to estimated data up to 87.7%. The fourth order of transfer function model is also considered, and the data are fitting up to 94%. However, the higher order of the transfer function, the more difficult in control design step and longer time computing in the real-time system. Then, in this study, for simplicity, the lower order of transfer function model for pneumatic muscle was selected.
4.2 Identification simplified linear model for pneumatic muscle actuator
Figure 4.1: Step response of the model and the actual system.
4.2 Identification simplified linear model for pneumatic muscle actuator
Figure 4.3: Comparison between the estimated force from model and the mea-surement force from muscle at frequency 0.2 Hz.
4.3 Control strategy for BWS system
error is bigger than the low frequencies. In the case of BWS application, the too precise control system is not necessary then the approximated simple model, in this instance, is acceptable. The key thing is that the derived model is very simple so it would be easily implemented in the real-time device which has very limited resource.
4.3
Control strategy for BWS system
4.3.1
COP tracking control scheme
Figure 4.5 shows the COP movement of the subject during walking in one gait cycle. The COP of human, at first, locates at the left leg, when this leg becomes a swing state, the COP change to the right leg (the leg is in the stance phase at this time). The subject COP will travel along of the stance phase on the right leg until the right leg becomes the swing state and at the same time the left leg becomes into the stance state the COP will again change to the left leg. The process is repeated in every gait cycle during human walking. In the case of using treadmill system, the subject is walking on it so that the position of the subject does not change. The moving of dual belts is opposite with the subject walking direction and moves the COP backward. The moving of COP is redrawn as shown in Figure on the right-side.
4.3 Control strategy for BWS system
Figure 4.6: Treadmill with four force sensors integrated into four corners.
4.3 Control strategy for BWS system
words, the COP-x is in the center. By reducing the percentage of unloading force, the highest value of pressure will change, and the instantaneous value of pressure signal in each PAM will change following the moving of COP-x as shown in Figure 4.7 . Figure 4.8 shows the block diagram of the active tracking COP moving control model. Therefore, a simple control law for each PAM would be chosen to track COP moving following.
p1 = Pm∗ x + b1 (4.3)
p2 = Pm∗ x + b2 (4.4)
In the equations 4.3 and 4.3, p1 and p2 variables represent the instantaneous
values of the pressure signal in PAMs. Pm coefficient represents the highest value
of pressure input signal while x variable represents the position of the COP in the x direction. b1 and b2 parameters express the offset values which depend on
the actual size of the treadmill.
4.3 Control strategy for BWS system
4.4 Control system using LabVIEW Real-time and LabVIEW FPGA
4.3.2
PID controller
In this study, conventional PID controller was used for controlling the Pneumatic muscle of BWS system. The advantage of PID controller is that it is very easy to be implemented and it is used very commonly in the mechanical system and in industrial. One of the reason author chooses the PID controller is that author tends to use the compact Rio device provide by National Instrument based on FPGA platform. The device has tiny resource and strict time clock for every loop programming. If we use other controller system strategies which would require significant resource and take much time for computing these are not meet the requirements for this device.
Figure 4.9: Block diagram of the PID controller.
4.4
Control system using LabVIEW Real-time
and LabVIEW FPGA
4.4.1
Hardware
4.4 Control system using LabVIEW Real-time and LabVIEW FPGA
different. For general computer because of the CPU has to process many tasks at a time, and the control program designed by LabVIEW is not a priority task, then control system can only run at very slow sample time. Therefore, it not a good choice for Body Weigh Support system. An embedded device is a good solution since it runs at higher frequency and reliability, the disadvantage of em-bedded system in comparison with a general computer is the limitation resource like CPU frequency clock or memory. For FPGA solution, the most advantage of control program implemented by using FPGA chip is that it is very high perfor-mance and reliability because FPGA in the compact Rio device is a blank chip and the program load into FPGA chip will perform like an electric circuit. FPGA program could implement at the very high sample rate. Nevertheless, the size of the program executes on FPGA is not too big and depends on the number of logic cells of FPGA chip. At this time, we have three components in case of an application for control program: general computer with huge resource and limita-tion of sample rate, embedded device in the balance of performance and resource and FPGA with very high performance and limitation of resources. For the BWS control system, all three components were used up for controlling and analyzing the system. The general computer was used to set the initial parameters and send every command to the real-time device. The control program was design base on FPGA platform for ensuring high performance of control system and mea-surement system. What data collect from meamea-surement system was sent to the time device and save to the memory of the time instrument. The real-time device will receive every command from the user (using a general computer) and direct these command to FPGA program executing in FPGA chip.
4.4.2
Software
4.4 Control system using LabVIEW Real-time and LabVIEW FPGA
software has significant jitter, so the program based Window platform commonly is used for data analyzing and to send every tag, message, and command to the target computer. For FPGA part, FPGA hardware could be considered as an electronic circuit then it could operate at the very high frequency and very low jitter for a single cycle time. Then, the FPGA program which included control program and acquisition program is embedded inside the FPGA chip to get the highest performance and reliability. Particularly, the FPGA in compact Rio is a white chip. Since the FPGA software is compiled, deployed and executed, one processing inside FPGA chip is rewired on hardware to implement that function-ality that defined in software. For the real-time target, it has a balance between resource and performance. However, the recommendation sampling rate for an application using the real-time device is lower than 500Hz.Therefore, it does not meet the requirements for control and measurement system in case of BWS sys-tem. Hence, real-time target device would take responsibility to connect between the user computer and FPGA part inside the compact device and to log data which are collected by FPGA program. Network publish shared variables are used for communication between Windows program and Target program because we want to send only the latest values like updating parameters or messages. In communication between Target program and FPGA program, FIFO memories are used because we want to send all collected data from a sensor for analyzing progress later. Figure 4.11 shows the LabVIEW project and User Interface of Window program which is used for control the BWS system.
4.5 Conclusion
Figure 4.11: LabVIEW project and User Interface of the software program for controlling BWS system.
4.5
Conclusion
Chapter 5
Result and Discussion
The fifth chapter consists of the results and discussion of this research project. The first sub-topic would describe the experiment design for system validation. After that, several sub-topics delves into the assessments evaluation results and analyzing. In this chapter, the validation experiments were designed including BWS system and Counter Weight system for comparison. The motion capture system with six cameras also was used for recording twelve reflexed markers to calculate COM for comparing between the new system and the old one. Moreover, in the experiment assessment for the new BWS system, unloading forces, reaction forces, COP also were recorded at several weight unloading levels for both BWS system and Counter Weight system so that we could have the whole picture of the advantages and disadvantages of the new system.
5.1
Experiment protocol
5.1 Experiment protocol
5.1 Experiment protocol
5.1 Experiment protocol
Figure 5.2: COP in one gait cycle and the definition of step width.
5.1 Experiment protocol
Figure 5.3: The method to partition the COM data and to quantify the COM parameters.
5.1 Experiment protocol
Figure 5.5: The COM in the vertical direction and the definition of the COMz amplitude in vertical.
starting point of a new gait cycle is defined as the marker on the ankle joint goes down. In that case, the event that the coordination in vertical of the marker on the ankle joint goes to a minimum value is chosen as the detection point of a new gait cycle. From the detection point, the data of COM is partitioned to every individual gait cycles. The COM amplitude parameters in mediolateral and vertical (as shown in the Figure 5.4 and Figure 5.5) are quantified to represent the effect of the BWS system and Counter Weight system. The data of COP and COM amplitude parameters then were standardized for all nine subjects. The standardized procedure for the experimental data of each subject is conducted by using the formula below:
5.2 Reaction force and unloading force
5.2
Reaction force and unloading force
Figure 5.6 the reaction forces of the representative subject recorded when the subject is walking on the treadmill under unloading force at 30%, 50%, and 70% weight unloading. The blue line represented for the reaction force when subject walking using the BWS system, the green line represented the reaction force when subject walking using the counterweight system and finally the black line is for normal walking (mean that 0% weight unloading and the subject did not wear the harness as well). The reaction force in normal walking is for comparing among weight support systems and locomotion posture at which subject felt most comfortable. We could see that both BWS system and counter weight system modified the subject’s reaction force and made reaction force pattern deformation. When the weight support level increased, the deformation of the reaction force patterns was also increased. This change of the reaction force pattern is because at the high levels of weight support subject would be difficult to touch the whole sole (include both heel contact and toe off) on the treadmill. Moreover, the higher weight support also affects stronger to every gait parameter so it would be difficult to say reaction force would have scaled pattern from normal walking. Intuitively, we may see the reaction force at low and medium weight support for the BWS system look like better reaction force pattern than the Counter Weight system. However, the differences in the reaction force patterns were not clear between two weight support systems.
5.2 Reaction force and unloading force
5.2 Reaction force and unloading force
5.2 Reaction force and unloading force
Figure 5.8: Reaction Force When applying Weight systems. Backline Reaction Force at 0% is scaled for comparison, Blue Reaction force using the Active system, Green Reaction force using Counter Weight system. From the left to the right, the weight support level is 30%, 50%, and 70%, respectively.
0.3, 0.5 and 0.7 times so that we could see how modification of the reaction force pattern by weight support systems in comparing with the normal walking. In almost case, we may see reaction force shapes for both Body Weight system and counter Weight system were matching the normal walking reaction force pattern. In the Figure 5.8, the reaction force in case of using Body Weight system was higher matching to the normal walking than the counter weight system.
5.2 Reaction force and unloading force
Table 5.1: Comparison Reaction force between BWS system, counter Weight system and Normal Walking of the representative subject by Paired t-test.
Method Weight Support Sample Size Mean difference (N) SD SE mean 95% CI down 95% CI up BWS 30% 8800 11.242 27.864 0.297 10.66 11.825 CWS 30% 8800 -13.279 21.775 0.232 -13.734 -12.824 BWS 50% 6450 15.853 20.144 0.251 15.362 16.345 CWS 50% 6450 9.636 18.013 0.224 9.196 10.076 BWS 70% 6752 19.014 25.382 0.309 18.408 19.619 CWS 70% 6752 50.963 16.522 0.201 50.569 51.357
behavior of CW system is due to the ”pendulum effect” increase strongly at the high level of weight support.
The Figure 5.9 expresses more clearly the mean difference of Reaction force patterns of the representative subject during walking under in case of comparison to reaction force in normal walking. In this Figure, the vertical axis represents the difference in the reaction force patterns; the more closed to 0 is the more agree-ment between two patterns. The negative value expresses the lower amplitude of the pattern to the reference pattern; the positive value expresses the higher amplitude. The horizontal axis expresses the weight support level. We could see that in the case of using BWS system, the difference is increased steadily since the weight support level increases. In the case of using Counter Weight system, the difference increases extremely when the weight support level increases. These results also confirm that the ”pendulum effect” strongly effects to gait parameters at the high-level weight supports.
5.2 Reaction force and unloading force
Figure 5.9: The demonstration of the difference of reaction force pattern when using the weight support systems to reaction force pattern in normal walking of the representative subject. Difference = Fz by weight support system - Fz by normal walking.
5.3 COP trajectories
Figure 5.11: The adaptation of the unloading force for the Counter Weight system on the left side. The red line represents for desired unloading force (named Refinput), the blue line represents the actual force.
sole from the heel to the toe and this moving takes time then the unloading force keeps as a constant there. When the COP switch to the right and locomotion posture changes to swing phase, the unloading force on the left side goes quickly down. The same calculation is applied for the desired unloading force in case of the counter weight system. The blue line represents the actual unloading force recorded by the left load cell mounted in the left hardness bell. We may see that the real force tries to follow the desired unloading force in Figure 5.10. For the lower Figure, the real force does not follow the desired unloading force. Instead, it tries to be a constant.
5.3
COP trajectories
Figure 5.12 shows COP trajectories with 30%, 50%, and 70% of the subject weight for the representative subject. Each experiment was conducted using both two kinds of BWS system including Counter Weight system and BWS system using the COP tracking model. We also recorded a normal walk (with 0% of unloading force) to give a graphical comparison of how the real COP path without the BWS system must be. In Figure 5.12, the black line represents the COP trajectory without unloading force while blue and green lines represent the COP trajectories for counter weight and BWS system with the active model, respectively.
5.3 COP trajectories
the lower level of unloading force, the active BWS system shows its best behavior comparing with the counter weight system. The responses from subject revealed that subject’s feeling is more comfortable using the active BWS support system than the counter weight system. On the other hand, results show significant differences between the COP trajectories of the subject in normal walking and when using counterweight system (consider in the x direction). When considering COP paths of BWS systems and the counterweight system in the higher level of the unloading force, the difference of the COP paths is reduced. It is because at the high degree of weight support subject would difficult to touch the whole sole especially the heel contact so the COP paths are deformation and therefore we may difficult to see the difference between them.
Figure 5.12: COP trajectories of unloading subject weight of the representative subject. The black line represents for the COP at normal Walking, the Blue line represents for Counter Weight system, and the Green line represents for BWS system.
5.3 COP trajectories
Table 5.2: Comparison of the step width (of all nine subjects) between BWS system, counter Weight system, and Normal Walking by ANOVA. NormalStd, BwsStd, and CwsStd are data of step width standardized in cases of Normal walking, BWS system and Counter Weight system respectively.
Weight Support Method Sample Size Mean SD 95% CI 30% NormalStd 139 1.0000 0.0753 (0.9756, 1.0244) BwsStd 139 0.7971 0.1726 (0.7727, 0.8215) CwsStd 139 0.8012 0.1698 (0.7768, 0.8256) 50% NormalStd 132 1.0000 0.1131 (0.9749, 1.0251) BwsStd 132 0.7806 0.1510 (0.7555, 0.8057) CwsStd 132 0.7567 0.1697 (0.7316, 0.7817) 70% NormalStd 138 1.0000 0.0695 (0.9644, 1.0356) BwsStd 138 0.9334 0.2223 (0.8979, 0.9690) CwsStd 138 0.9109 0.2852 (0.8753, 0.9464)
5.3 COP trajectories
Figure 5.14: The demonstration of the difference of COP amplitudes in the frontal direction (step width) of all nine subjects when using the weight support systems at 50% weight support, *** represented the significant value p < 0.001.
5.4 COM movements
unloading force equal to 30%, 50%, and 70% subject weight respectively. These Figures show the significant difference of step width of the normal walking case to the step width during applying the BWS system and the Counter Weight sys-tem (p < 0.001). We could see that at the mean value of the COP amplitudes in frontal in case of BWS system are almost closer to the normal walking and higher than the Counter Weight system case. However, the significant of COP ampli-tude in the frontal direction between the BWS system and the Counter Weight system was not found.
5.4
COM movements
5.4 COM movements
(a) COM trajectory at 20% using BWS system.
5.4 COM movements
(a) COM trajectory at 30% using BWS system.
(b) COM trajectory at 30% using Counter Weight system.
medio-5.4 COM movements
(a) COM trajectory at 50% using BWS system.
(b) COM trajectory at 50% using Counter Weight system.
medio-5.4 COM movements
The Figure 5.19, 5.20, and 5.21 show more clearly the effects of the weight support systems since the COM trajectories were represented in one gait cycle. The method to calculate the COM was also similar to the method that calculates the reaction force and COP for one gait cycle. This means that the COM patterns were split to every single gait cycle, after that the COM trajectories were averaged for all parts. The COM trajectories also were represented to the percentage of gait cycle for easier comparing. To see more clearly, the author also added the standard deviation for all COM trajectories. In this case, we also should put more attention to the COM trajectories in the vertical direction because the weight support systems give much effect to this pattern. We could see that in general when the unloading force increases the COM in vertical direction also increases. However, the COMs in vertical direction keep the similar shape, amplitude and the variation of trajectory. At the high level of weight support, the Body Weight support system still kept the similar effect to the COM trajectory in the vertical direction. In contrast, the COM trajectory in case of the high level of unloading force using Counter Weight system was much deformation and variance, the range from negative standard deviation to positive standard deviation was bigger than the case of using BWS system.
5.4 COM movements
5.4 COM movements
5.4 COM movements
5.4 COM movements
Table 5.3: Comparison COM in Y (Frontal) direction between BWS system, counter Weight system and Normal Walking of the representative subject by Paired t-test. Method Weight Support Sample Size Mean difference (N) SD SE mean 95% CI down 95% CI up BWS 20% 2596 -25.535 32.704 0.642 -26.793 -24.276 CWS 20% 2596 -16.23 25.607 0.503 -17.216 -15.245 BWS 30% 2530 -6.2 25.327 0.504 -7.187 -5.212 CWS 30% 2530 -21.105 25.72 0.511 -22.107 -20.102 BWS 50% 2332 -4.655 28.202 0.584 -5.8 -3.509 CWS 50% 2332 -26.367 26.695 0.553 -27.451 -25.283
5.4 COM movements
In Figure 5.22, the difference of COM trajectories of the representative subject in frontal direction by using the weight support systems to the COM trajectory in normal walking is demonstrated. The more closed to 0 of the difference is the more similar of the COM trajectories by weight support system to the case of normal walking. The mean value is negative this represents the amplitude of COM trajectories since applying the weight support systems is smaller than in the case of normal walking. The difference of COM in the case of using Counter Weight system is increased when the weight support level increases. However, in the case of using the BWS system even is decreased follow the increasing of the weight support level. The limitation is due to the BWS system activates at two positions on subject unlike the case of the conventional weight support system. Then, when the weight support is more increased, this effect is clearer and makes the COM more similar to the case normal walking.
5.4 COM movements
Figure 5.24, Figure 5.25 and Figure 5.26, we could observe that the mean value COMy by using the BWS system is significantly higher than the case using the Counter Weight system (p < 0.001 at 30% weight support, and p < 0.05 at 50% weight support). We also see that the significant difference between the mean val-ues is not found at the high level of weight support (at 70% weight support, p = 0.927). The closer mean value of the case using the BWS system is evidence such that the new system shows its better behavior to the Counter Weight system. The higher mean value of COMy in the case of applying the BWS system than Counter Weight system could be explained by the way that the unloading force that applies to the subject’s trunk. The Figure 5.27 demonstrates the unloading force that applying on the subject’ trunk for the Counter Weight system (sub-figure A) and the BWS system (sub(sub-figure B). In the case of the Counter Weight system, the lateral part of unloading force tends to prevent the movement of the COM during walking and to pull the COM in mediolateral to the center axis. This affection is similar to the “pendulum effect” since in pendulum mechanism there always exists a lateral force. This “pendulum effect” may make the subject uncomfortable during walking and modify the gait parameters. However, in the case of the BWS system, the lateral part of the unloading force would be small because the unloading force in this case always tries to follow the moving of the COP during walking and reduces the effect of the lateral unloading force.
5.4 COM movements
Table 5.4: Comparison of the COMy amplitude in mediolateral of all nine subjects between BWS system, counter Weight system, and Normal Walking by ANOVA. NormalStd, BwsStd, and CwsStd are data of COMy amplitude standardized in cases of Normal walking, BWS system and Counter Weight system respectively.
Weight Support Method Sample Size Mean SD 95% CI 30% NormalStd 123 1.0002 0.0841 (0.9716, 1.0288) BwsStd 123 0.8457 0.1809 (0.8170, 0.8743) CwsStd 123 0.7410 0.1957 (0.7124, 0.7696) 50% NormalStd 127 0.9993 0.0953 (0.9712, 1.0274) BwsStd 127 0.6264 0.2114 (0.5984, 0.6545) CwsStd 127 0.5724 0.1548 (0.5443, 0.6005) 70% NormalStd 122 0.9993 0.0838 (0.9715, 1.0271) BwsStd 122 0.3709 0.1929 (0.3431, 0.3987) CwsStd 122 0.3783 0.1693 (0.3506, 0.4061)
5.4 COM movements
Figure 5.24: The demonstration of the difference of COMy amplitude (in medi-olateral) of all subjects when using the weight support systems at 30% weight support, *** represented the significant value p < 0.001.
5.4 COM movements
Figure 5.26: The demonstration of the difference of COMy amplitude (in medi-olateral) of all subjects when using the weight support systems at 70% weight support, *** represented the significant value p < 0.001.
5.4 COM movements
Table 5.5: Comparison COM in Z (longitudinal) direction between BWS system, counter Weight system and Normal Walking of the representative subject by Paired t-test. Method Weight Support Sample Size Mean difference (N) SD SE mean 95% CI down 95% CI up BWS 20% 2596 28.027 4.816 0.095 27.842 28.213 CWS 20% 2596 27.175 6.754 0.133 26.915 27.435 BWS 30% 2530 49.426 4.892 0.097 49.236 49.617 CWS 30% 2530 33.894 6.591 0.131 33.637 34.151 BWS 50% 2332 65.182 5.127 0.106 64.974 65.319 CWS 50% 2332 65.395 8.289 0.172 65.058 65.731
weight system. In contrast, the effect of dynamic force due to inertia in BWS system is absolute no, instead of, the unloading force generated by BWS system will adapt to the movement of the subject, then, the subject will feel comfortable as walking under BWS system.
Figure 5.28 demonstrates the variance of the differences in COM trajectories of the representative subject in the vertical direction when applying the weight support systems to the Com trajectory in normal walking. The vertical axis expresses the mean difference with standard deviation (SD), the horizontal rep-resents the weight support level. The gray dot reprep-resents the BWS system, and the with dot represents the Counter Weight system. We may see that the seg-ments of standard deviation are increased since the weight support levels increase. Moreover, at every weight support levels, the segment of SD by Counter Weight system is always longer than the case of using BWS system. In this result, we could strictly say that the COM trajectories in the vertical direction by using Counter Weight system are more variant than the case of using BWS system.
5.4 COM movements
5.4 COM movements
5.5 Discussion
in the case of using BWS system is slightly higher than the case using Counter Weight system. However, the significant difference of the COMz amplitude at the high level of weight support (70% weight support) is not found (p = 0.164). This result could be explained that the gait in locomotion at the high level of weight support is not unstable. Moreover, in the novel BWS system, the PMA that connect to the subject trunk is a soft actuator. And, at the strong pendulum influence to the locomotion gait, the moving virtual position of the unloading force may not compensate for the deformation of the COM movement.
Table 5.6: Comparison of the COMz (in vertical) amplitude of all nine subjects between BWS system, counter Weight system, and Normal Walking by using ANOVA. NormalStd, BwsStd, and CwsStd are data of COMy amplitude stan-dardized in cases of Normal walking, BWS system, and Counter Weight system respectively. Weight Support Method Sample Size Mean SD 95% CI 30% NormalStd 144 1.0004 0.1207 (0.9785, 1.0224) BwsStd 144 0.7392 0.1163 (0.7172, 0.7612) CwsStd 144 0.6048 0.1610 (0.5829, 0.6268) 50% NormalStd 143 1.0009 0.1116 (0.9748, 1.0272) BwsStd 143 0.7048 0.1704 (0.6786, 0.7310) CwsStd 143 0.5915 0.1866 (0.5653, 0.6177) 70% NormalStd 143 1.0010 0.1209 (0.9573, 1.0447) BwsStd 143 0.6731 0.1545 (0.6294, 0.7168) CwsStd 143 0.6160 0.4166 (0.5723, 0.6597)
5.5
Discussion
5.5 Discussion
Figure 5.29: Demonstrate the comparison of the COMz amplitude by using the BWS support system and Counter weight system at 30%, 50%, and 70% weight support by using ANOVA. *** represented the significant value p < 0.001.
5.5 Discussion
Figure 5.31: The demonstration of the difference of COMz amplitude (in vertical) when using the weight support systems at 50% weight support by using ANOVA, *** represented the significant value p <0.001.
5.5 Discussion
and provide the desired unloading force. Therefore, the generated unloading force by the new BWS system could make the subject more comfortable than the Counter Weight System. The fact that in almost experiments subject always confirmed that the new system makes the subject more comfortable than the Counter Weight system.
The first advantage of the novel BWS system is that it could easily tune the weight support level to get the desired unloading force. The new BWS system by using Pneumatic muscle actuators is active system then unloading force could easily be tuned by changing the pressure of the input compressed air. The Counter Weight System has itself limitation of tuning the weight support level, then the high level of unloading force it was difficult to catch up correctly. Then we could see that reaction force was a little bit higher than BWS system case, however, even though that the reaction force pattern generated by using Counter Weight system was still deformation. Furthermore, by using up to four muscle for BWS system, we could easily modulate the generated force for each side as we see in the Figure 5.10. Therefore, the total unloading loading force could change the virtual application point since the system tries to track the COP movement during the subject walking; and we also get the desired unloading force that follows the moving of COP. In Figure 5.10, we also could see the limitation of the control algorithm for the new system as the time delay for generated unloading force was still a bit high. However, the author believes that the new system still meets the basic criterion of a BWS system.
![Figure 1.3: The novel mechatronic BWS system using the complicated rope- rope-pulley-spring system [24].](https://thumb-ap.123doks.com/thumbv2/123deta/9766093.1850097/20.892.298.664.222.577/figure-novel-mechatronic-bws-using-complicated-pulley-spring.webp)