Determination of Intracellular Darunavir by Liquid Chromatography Coupled with Fluorescence Detection
Daisuke Nagano1,2, Takuya Araki1,2, Tomonori Nakamura1,2* and Koujirou Yamamoto1,2
1Department of Clinical Pharmacology, Gunma University Graduate School of Medicine, 3-39-22 Showa-machi, Maebashi 371-8511, Japan and2Department of Pharmacy, Gunma University Hospital, 3-39-15 Showa-machi, Maebashi 371-8511, Japan
*Author to whom correspondence should be addressed. Email: [email protected]
Received 2 February 2013; revised 5 September 2013
The concentration of darunavir (DRV) in peripheral blood mono- nuclear cells (PBMCs) was reported to affect the clinical symptoms of patients and the development of drug-resistant viruses. We devel- oped a simple and highly sensitive method to quantify the concentra- tion of DRV in human PBMCs using high-performance liquid chromatography with fluorescence detection. PBMC samples were collected using commercially available tubes for density-gradient centrifugation. To disrupt the cells, we used a heating fragmentation method. To compensate for the disadvantages of the heating frag- mentation method, liquid – liquid partitioning was used to destroy the unbroken cells by the degeneration of proteins using an organic solvent. As an analytical column, we used an ODS column. The mobile phase consisted of 20 mmol/L potassium phosphate buffer ( pH 4.3)/acetonitrile (57/43, v/v) and was pumped at 1.0 mL/min.
The lower limit of quantification was 5 ng/106cells. Good linearity was obtained with 5 – 100 ng/106cells. The intra- and inter-assay precision and accuracy were<15%. Because our method makes pos- sible the measurement of DRV concentration in PBMCs at medical fa- cilities or laboratories without tandem mass spectrometry systems, we believe that it will contribute to clinical studies and will improve the medical treatment of human immunodeficiency virus infections with DRV.
Introduction
Several new types of drugs have recently been introduced for the treatment of drug-resistant human immunodeficiency virus 1 (HIV-1) infection. Darunavir (DRV), a protease inhibitor, is one such drug and has become crucial for antiretroviral therapy (ART) because it potently suppresses the replication of wild- type and drug-resistant HIV-1. Thus, DRV has been focused on as one of the main drugs for the treatment of patients infected with multidrug-resistant HIV-1, and therapeutic drug monitoring (TDM) of DRV has been considered to be important to obtain the expected clinical efficacy as an alternative to counting CD4þ cells or viral load (1,2). Moreover, some recent studies reported that the concentration of DRV in peripheral blood mononuclear cells (PBMCs), the site of action for DRV, affected the clinical symptoms of patients and the development of drug-resistant viruses, and monitoring the concentration of DRV in PBMCs has been argued to be more important than its level in plasma (3). In the field of transplantation, the impact of intracellular concentra- tion of a drug on its clinical efficacy has been reported (4).
To determine the blood level of DRV, several methods using high-performance liquid chromatography (HPLC) with an
ultraviolet (UV) detector or with tandem mass spectrometry (LC – MS/MS) have been developed. Goldwirt et al. and Takahashiet al.reported HPLC-UV methods with lower limits of quantification (LOQs) of 250 and 130 ng/mL, respectively (5,6).
However, because of its low sensitivity and specificity, HPLC-UV requires a huge volume of blood and complex sample prepar- ation procedures to detect DRV at a low concentration such as in PBMCs. D’Avolio et al. reported an HPLC-photodiode array method with a sensitivity of 200 ng/mL using 500mL of plasma;
however, this method also has insufficient sensitivity to deter- mine the concentration of DRV in PBMCs (7). Recently, some highly sensitive methods using LC – MS/MS were reported for the simultaneous determination of DRV and other ART drugs in plasma (8–12), dried blood spots (13,14), and PBMCs (15,16).
In 2011, Guptaet al.developed an LC – MS/MS method to detect DRV in plasma with an LOQ of 1 ng/mL (17). Thus, LC – MS/MS methods are highly sensitive and useful for determining the con- centration of DRV in PBMCs. However, LC – MS/MS methods are not considered suitable for routine clinical use because many medical facilities and laboratories do not have access to an MS/
MS system due to its high cost and complexity of use, at least at the present time.
Conversely, a method using HPLC with fluorescence detec- tion (FLR), which is more sensitive than HPLC-UV and simpler and more widely used than LC – MS/MS, has not been reported for the detection of DRV. Thus, in this study, we established a simple and highly sensitive method to determine the concentra- tion of DRV in PBMCs using HPLC coupled with fluorescence detection (HPLC-FLR), which is suitable for routine clinical use as an additional tool to detect DRV in PBMCs, and for use in medical facilities and laboratories that cannot use LC – MS/MS systems.
Experimental
Chemicals and reagents
DRV and voriconazole (VCZ) were purchased from Toronto Research Chemicals Inc. (North York, ON, Canada) and Sigma Aldrich Inc. (St. Louis, MO, USA), respectively (Figure 1). All other reagents were obtained from commercial sources and were graded for HPLC or analytical use.
Chromatography conditions
The HPLC analysis was performed using a Waters Alliance 2690 separation module (Waters, Milford, MA, USA) equipped with a
Journal of Chromatographic Science 2014;52:1021 – 1025
doi:10.1093/chromsci/bmt147 Advance Access publication November 4, 2013 Article
2475 scanning fluorescence detector (Waters). The appropriate wavelength for the detection of DRV was determined by 3D spectrum analysis using 100 ng/mL DRV solution and set at 235 nm for excitation and 337 nm for emission, which was found to be the maximum wavelength for DRV. We used a YMC-Pack Pro C18column (2504.6 mm, 5mm particle size;
YMC, Tokyo, Japan) that was maintained at 408C. The mobile phase was 20 mmol/L potassium phosphate buffer ( pH 4.3)/
acetonitrile (57/43, v/v) and was pumped at a flow rate of 1.0 mL/min. Empower 2.0 was used for data collection and integration.
Collection of blood and separation of PBMCs
BD Vacutainer Mononuclear Cell Preparation Tubes (Becton Dickinson and Company, Franklin Lakes, NJ, USA) were used as blood collection tubes to collect PBMCs by the density-gradient centrifugation method. Blood samples were centrifuged at 1600gfor 20 min, and the PBMC layer was separated. PBMC samples were washed twice with 10 mL phosphate-buffered saline (PBS), and suspended in PBS to obtain a concentration of 1.0106cells/mL. PBMC samples were transferred to a poly- ethylene tube and treated immediately.
Preparation of standard stock solutions and calibration standard samples
The DRV stock solution was prepared in 50% methanol at a con- centration of 500mg/mL. This stock solution was diluted with 50% methanol to obtain the concentrations required for the standard working solutions. Calibration standard samples were prepared by spiking a suspended PBMC solution (4% total volume of PBMC suspension) with the standard working solu- tions. Calibration curve standards to determine the DRV concen- trations were made at 5, 10, 20, 50, and 100 ng/106cells. The VCZ stock solution (1 mg/mL), as an internal standard (IS), was dissolved in 50% methanol. This stock solution was diluted with 50% methanol to the working concentration of 50mg/mL. All samples were stored at2208C until use.
Sample preparation from PBMCs
Two hundred microliters of PBMC suspension and 20mL of cali- bration standard samples or 50% methanol were mixed by vor- texing for 1 min, and heated at 958C for 5 min to destroy the cell and nuclear membranes. Then, 20mL of VCZ (5.0mg/mL), 500mL of 500 mmol/L sodium carbonate buffer ( pH 9.0), and chilled samples were placed into glass centrifuge tubes. Two milliliters of ethyl acetate were added and the samples were shaken vigorously for 10 min with a mechanical shaker, followed
by centrifugation at 1500gfor 5 min. The upper organic layer was transferred to another disposable glass tube, and evaporated to dryness under reduced pressure. The residue was dissolved in 200mL of 50% methanol and 25mL of the solution was injected into the HPLC system.
Assay validation
Specificity was checked using five different PBMC samples. The extraction ratio for DRV and the IS was calculated by comparing spiked PBMC samples and stock solutions diluted to the same DRV concentration. The extraction ratio were calculated at five different concentrations, 5.0, 10, 20, 50, and 100 ng/106cells, by comparing the peak areas of the samples after the clean-up pro- cedure with the areas obtained by direct injection of the aqueous solutions.
The lowest concentration of DRV with acceptable precision and accuracy (,20%) was defined as the lower limit of quantifi- cation (LOQ). The lower limit of detection (LOD) was defined as the concentration at which the height of the peak was three times greater than the baseline. For the other concentrations, precision and accuracy should be within 15%. Precision was expressed as the percentage coefficient of variation (CV), while accuracy was expressed as the relative error of the nominal versus measured concentration (RE). The intra-assay variability was tested on five different PBMC samples. The inter-assay vari- ability was tested on five different days and a new calibration curve was constructed each day.
Sample stability
To confirm the stability of DRV, PBMC suspensions with 100 ng/
106cells spiked with 1.0mg/mL of DRV were stored at2208C.
After storage for 4 weeks, the stability of DRV in the samples was evaluated by comparing their peak areas with those that were measured immediately after collection.
Clinical samples
Eight milliliters of blood, which was the minimum amount required to separate the PBMC layer and the same volume used in a previous report (3), were obtained from patients with HIV re- ceiving an 800-mg daily dose of DRV before oral administration of DRV. For the collection of PBMC samples, BD Vacutainer Mononuclear Cell Preparation Tubes were used as described above, and PBMC sample were separated within 2 h after blood sampling. PBMC samples were stored at2808C until extraction of DRV, which was performed as described above within 1 day. The treated sample was assayed into an HPLC-FLR system immediately.
Approval for this study was obtained from the Institutional Review Board of Gunma University Hospital, and written consent was obtained from all patients after they had been informed of the experimental procedure and the purpose of the study.
Results
Selectivity and linearity
Typical chromatograms for the detection of DRV in PBMCs are shown in Figure 2. The peaks for DRV and VCZ were well Figure 1. Chemical structures of DRV (A) and VCZ (B).
separated, with retention times of 13.8 and 9.8 min, respectively.
The resolution of these peaks was 8.0. The theoretical plates and the symmetry coefficient value of the DRV peak were 1.2104 and 6.0, respectively, and those of the IS peak were 6.1103 and 4.0, respectively.
The mean equation describing the calibration curve to deter- mine the concentration of DRV in PBMCs 5 – 100 ng/106cells was y¼0.0222xþ0.0456 (R2¼0.999), where y is the peak area ratio of DRV against the IS andxis the nominal concentra- tion of DRV.
Precision, accuracy and recovery
The intra- and inter-assay precision and accuracy values are shown in TableI. The intra- and inter-assay precision and accur- acy were,15%.
The extraction ratio of DRV and VRC varied from 84.5 to 93.2% and 82.5 to 88.5%, respectively.
Lower limit of detection and lower limit of quantification
The LOD and LOQ for DRV in PBMCs were 1.0 and 5.0 ng/
106cells, respectively. The quantification range for of DRV in PBMCs was 5.0 – 100 ng/106cells.
Sample stability
The peak area of DRV after storage for 4 weeks was 95.3+0.4%
(n¼5) compared with samples that were measured immediate- ly. Therefore, DRV was stable in PBMCs at2208C for at least 4 weeks.
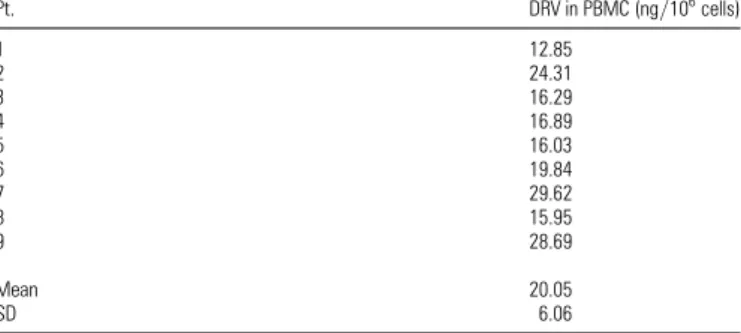
Application of the method
The established method was applied to obtain the trough con- centration of DRV in PBMC samples from nine subjects. We detected PBMC DRV concentrations of 20.05+6.06 ng/
106cells using 8 mL of blood, which was the minimum amount where it was possible to separate the PBMC layer from the whole blood sample and was the same volume used in a previous report (3) (TableII). These data were found to be similar to pre- viously published data (3).
Discussion
In the treatment of HIV-1 infection, maintaining the blood con- centration of DRV within appropriate levels is considered to be essential to prevent the proliferation of drug-resistant viruses.
Recently, the importance of measuring the concentration of Figure 2.Typical chromatograms of blank human PBMC (A), human PBMC spiked with DRV (5 ng/106cells) and VCZ (5mg/106cells) (B) and PBMC of a patient treated with DRV (C).
Table I
Precision and Accuracy of the Assay for DRV in PBMCs Nominal concentration (ng/
106cells)
Measured concentration mean+SD (ng/106cells)
Accuracy (RE %)
Precision (CV %) Intra-assay (n¼5)
5 4.59+0.33 28.16 7.19
10 9.01+0.79 29.94 8.77
20 22.4+1.43 12.0 6.37
50 52.2+3.56 4.49 6.82
100 99.1+5.32 20.90 5.37
Inter-assay (n¼5)
5 4.48+0.25 210.3 5.52
10 9.11+0.69 28.82 7.54
20 22.2+1.02 10.8 4.58
50 55.5+3.05 11.9 5.50
100 97.3+3.84 22.74 3.96
CV, coefficient of variation; RE, relative error of the nominal versus the measured concentration.
DRV, especially that in PBMCs, has been focused upon and dis- cussed (18). Clinically, the trough plasma concentration of DRV was found to be 3.8mg/mL (2), which is sufficiently high to be detected by conventional HPLC-UV methods; however, HPLC-UV methods are not suitable for the detection of DRV in PBMCs in the clinical setting because a huge volume of blood is required and easily confounded by the presence of foreign sub- stances. In our preliminary test using a UV detector to detect intracellular concentration of DRV, some interfering foreign sub- stance peaks were found at the same retention time with DRV;
however, when using an FLR detector, we could eliminate these contaminated peaks and obtain a clear base line due to FLR’s higher specificity. Regarding the sensitivity, Glodwirt et al.
reported that they could detect 250 ng/mL of DRV with an in- jection volume of 50mL using HPLC-UV without condensation from plasma, and here, we detected 500 ng/mL of DRV with an injection volume of 25mL using HPLC-FLR with 10 times dilu- tion from original plasma. These data clearly show the advan- tages of FLR, namely higher selectivity and sensitivity. Recently, some even more sensitive methods to detect DRV using LC – MS/MS have been developed (8–17); however, they are not con- sidered to be suitable for routine clinical use because of cost and complexity. Thus, we established here a simple and highly sensi- tive method to determine the concentration of DRV in PBMCs by HPLC-FLR as an additional tool for the measurement of DRV concentration in PBMCs for use in medical facilities and labora- tories that cannot use MS/MS systems.
In the first step of sample preparation, we used Vacutainer Cell Preparation Tubes to collect PBMCs because of their simpli- city of use. Using these tubes, PBMCs can be isolated simply and quickly without complex manipulations as compared with density-gradient centrifugation using Ficoll. However, in our pre- liminary examination, we found that the recovery ratio of PBMCs from whole blood samples using Vacutainer Cell Preparation Tubes was 70 – 80% of that when using conventional density- gradient centrifugation. At this point, because 8 mL of whole blood was required as a minimum volume to separate the PBMC layer due to limitations in the methodology,6 mL of PBMC sus- pension with a concentration of 1.0106cells/mL was col- lected as a minimum amount of PBMC sample, and therefore the 70 – 80% recovery ratio of PBMCs is not a critical disadvantage.
The disruption of cell membranes by the addition of an acid or base, heating or ultrasonic fragmentation is usually performed before the extraction of chemical compounds. According to
D’Avolioet al.(13), we initially used ultrasonic fragmentation to destroy the cell and nuclear membranes; however, because we did not achieve a sufficient extraction ratio (near 57%) or suffi- cient reproducibility, the extraction ratio varied between 34.8 and 72.8% in a preliminary study. This low sufficient extraction ratio and reproducibility might have been caused by low capabil- ity or unstable performance of the ultrasonication systems and might have been resolved by use of a high-performance system.
In this study, we assessed a heating fragmentation method using a commonly used heating system, which is rarely affected by technical fluctuations because of its simplicity. Additionally, to address the disadvantages of the heating fragmentation method (i.e., the low efficacy for the destruction of cell membranes), we used liquid-phase extraction to disrupt the unbroken cells by protein degeneration using an organic solvent, which is neces- sary for liquid-phase extraction, and could successfully extracte DRV from PBMCs at a high extraction ratio (91%) and reprodu- cibility (the extraction ratio varied between 84.5 and 93.2%).
Using the above process, we have established a simple and highly sensitive method to detect DRV by HPLC-FLR with an LOQ of 5.0 ng/106cells. In a past study, Heineet al. established the LC – MS/MS method to measure the concentration of DRV in PBMCs with a LOQ of 1.0 ng/mL using a lysate containing 5 106cells per 200mL prepared from 8 mL of blood. This indicates that their LOQ was 0.4 ng/106cells, which is10 times more sensitive than our method reported here (16). However, this dif- ference in sensitivity is not presently a critical problem for clinic- al use since we can obtain 6 mL of 1.0106cells/mL PBMC suspension as a minimum volume, as described above. We suc- cessfully detected DRV in the PBMCs of patients receiving an 800 mg daily dose of DRV with a blood sampling volume of 8 mL, which is the same volume reported for LC – MS/MS by Heineet al.(16), and found that our data were similar to previ- ously reported data (16). Although the recovery ratio might be a key factor in reducing sampling volume when a new method to separate PBMCs from a lower volume of whole blood is devel- oped, our method requires only0.2106cells for the meas- urement of DRV concentration in PBMC, which could theoretically be collected from as little as 0.5 mL of whole blood.
In other words, following the development of a method to separ- ate the PBMC layer from a lower volume of whole blood, our method will allow for blood sampling of under 0.5 mL—a clinic- ally sufficient albeit low volume—to reduce the burden on patients.
Using an FLR detector, we could obtain high sensitivity and a clear baseline by eliminating peaks derived from foreign sub- stances, which sometimes interrupt the measurement process when using a UV detector. Additionally, using the above pro- cesses such as heating and liquid-phase extraction, we could obtain high accuracy, precision and reproducibility. We believe that our study provides an additional tool to measure the con- centration of DRV in PBMC using HPLC-FLR for medical facilities and laboratories, and believe this method will be useful and suit- able for clinical use due to its simplicity and high sensitivity. In conclusion, we have established a simple, rapid and highly sensi- tive quantification method for DRV in PBMCs. The present method will contribute to the progress of pharmacokinetic studies of DRV or the TDM system and improve the medical treatment of HIV infections with DRV.
Table II
DRV Concentration in PBMC and Plasma Obtained from Nine Subjects
Pt. DRV in PBMC (ng/106cells)
1 12.85
2 24.31
3 16.29
4 16.89
5 16.03
6 19.84
7 29.62
8 15.95
9 28.69
Mean 20.05
SD 6.06
Acknowledgments
We thank Ms. Aiko Matsumoto of Gunma University for her sec- retarial assistance.
References
1. Koh, Y., Nakata, H., Maeda, K., Ogata, H., Bilcer, G., Devasamudram, T., et al.; Novel bis-tetrahydrofuranylurethane-containing nonpeptidic protease inhibitor (PI) UIC-94017 (TMC114) with potent activity against multi-PI-resistant human immunodeficiency virus in vitro;
Antimicrobial Agents and Chemotherapy, (2003); 47: 3123 – 3129.
2. Pretorius, E., Klinker, H., Rosenkranz, B.; The role of therapeutic drug monitoring in the management of patients with human immunodefi- ciency virus infection;Therapeutic Drug Monitoring, (2011); 33:
265 – 274.
3. ter Heine, R., Mulder, J.W., van Gorp, E.C., Wagenaar, J.F., Beijnen, J.H., Huitema, A.D.; Intracellular and plasma steady-state pharmaco- kinetics of raltegravir, darunavir, etravirine and ritonavir in heavily pre-treated HIV-infected patients; British Journal of Clinical Pharmacology, (2010); 69: 475 – 483.
4. Lepage, J.M., Lelong-Boulouard, V., Lecouf, A., Debruyne, D., Hurault de Ligny, B., Coquerel, A.; Cyclosporine Monitoring in Peripheral Blood Mononuclear Cells: Feasibility and Interest. A Prospective Study on 20 Renal transplant recipients; Transplantation Proceedings, (2007); 39; 3109–3110.
5. Goldwirt, L., Chhun, S., Rey, E., Launay, O., Viard, J.P., Pons, G.;
Quantification of darunavir (TMC114) in human plasma by high- performance liquid chromatography with ultra-violet detection;
Journal of Chromatography B, (2007); 857: 327 – 331.
6. Takahashi, M., Kudaka, Y., Okumura, N., Hirano, A., Banno, K., Kaneda, T.; The validation of plasma darunavir concentrations deter- mined by the HPLC method for protease inhibitors;Biological and Pharmaceutical Bulletin, (2007); 30: 1947 – 1949.
7. D’Avolio, A., Baietto, L., Siccardi, M., Sciandra, M., Simiele, M., Oddone, V.,et al.; An HPLC-PDA method for the simultaneous quantification of the HIV integrase inhibitor raltegravir, the new nonnucleoside reverse transcriptase inhibitor etravirine, and 11 other antiretroviral agents in the plasma of HIV-infected patients;Therapeutic Drug Monitoring, (2008); 30: 662 – 669.
8. D’Avolio, A., Siccardi, M., Sciandra, M., Baietto, L., Bonora, S., Trentini, L.,et al.; HPLC-MS method for the simultaneous quantification of the new HIV protease inhibitor darunavir, and 11 other antiretroviral agents in plasma of HIV-infected patients; Journal of Chromatography B, (2007); 859: 234 – 240.
9. ter Heine, R., Alderden-Los, C.G., Rosing, H., Hillebrand, M.J., van Gorp, E.C., Huitema, A.D.,et al.; Fast and simultaneous determination of darunavir and eleven other antiretroviral drugs for therapeutic drug monitoring: method development and validation for the determination of all currently approved HIV protease inhibitors and
non-nucleoside reverse transcriptase inhibitors in human plasma by liquid chromatography coupled with electrospray ionization tandem mass spectrometry;Rapid Communications in Mass Spectrometry, (2007); 21: 2505 – 2514.
10. Fayet, A., Be´guin, A., Zanolari, B., Cruchon, S., Guignard, N., Telenti, A.,et al.; A LC-tandem MS assay for the simultaneous measurement of new antiretroviral agents: raltegravir, maraviroc, darunavir, and etravirine;Journal of Chromatography B, (2009); 877: 1057 – 1059.
11. Martin, J., Deslandes, G., Dailly, E., Renaud, C., Reliquet, V., Raffi, F., et al.; A liquid chromatography-tandem mass spectrometry assay for quantification of nevirapine, indinavir, atazanavir, amprenavir, saqui- navir, ritonavir, lopinavir, efavirenz, tipranavir, darunavir and mara- viroc in the plasma of patients infected with HIV; Journal of Chromatography B, (2009); 877: 3072 – 3082.
12. Else, L., Watson, V., Tjia, J., Hughes, A., Siccardi, M., Khoo, S.,et al.;
Validation of a rapid and sensitive high-performance liquid chromatog- raphy-tandem mass spectrometry (HPLC-MS/MS) assay for the simul- taneous determination of existing and new antiretroviral compounds;
Journal of Chromatography B, (2010); 878: 1455–1465.
13. D’Avolio, A., Simiele, M., Siccardi, M., Baietto, L., Sciandra, M., Bonora, S.,et al.; HPLC-MS method for the quantification of nine anti-HIV drugs from dry plasma spot on glass filter and their long term stabil- ity in different conditions; Journal of Pharmaceutical and Biomedical Analysis, (2010); 52: 774 – 780.
14. ter Heine, R., Rosing, H., van Gorp, E.C., Mulder, J.W., van der Steeg, W.A.,et al.; Quantification of protease inhibitors and non-nucleoside reverse transcriptase inhibitors in dried blood spots by liquid chromatography-triple quadruple mass spectrometry; Journal of Chromatography B, (2008); 867: 205 – 212.
15. D’Avolio, A., Simiele, M., Siccardi, M., Baietto, L., Sciandra, M., Oddone, V.,et al.; A HPLC-MS method for the simultaneous quantifi- cation of fourteen antiretroviral agents in peripheral blood mono- nuclear cell of HIV infected patients optimized using medium corpuscular volume evaluation; Journal of Pharmaceutical and Biomedical Analysis, (2011); 54: 779 – 788.
16. ter Heine, R., Davids, M., Rosing, H., van Gorp, E.C., Mulder, J.W., van der Heide, Y.T.,et al.; Quantification of HIV protease inhibitors and non-nucleoside reverse transcriptase inhibitors in peripheral blood mononuclear cell lysate using liquid chromatography coupled with tandem mass spectrometry;Journal of Chromatography B, (2009);
877: 575 – 580.
17. Gupta, A., Singhal, P., Shrivastav, P.S., Sanyal, M.; Application of a vali- dated ultra-performance liquid chromatography-tandem mass spec- trometry method for the quantification of darunavir in human plasma for a bioequivalence study in Indian subjects; Journal of Chromatography B, (2011); 879: 2443 – 2453.
18. Bazzoli, C., Jullien, V., Le Tiec, C., Rey, E., Mentre´, F., Taburet, A.M.;
Intracellular Pharmacokinetics of Antiretroviral Drugs in HIV-Infected Patients, and their Correlation with Drug Action;
Clinical Pharmacokinetics, (2010); 49: 17 – 45.