Academia Arena 2010:2(8)
Determinants of Non Farm Income among Farm Households in South East Nigeria
Ibekwe, U.C; Eze, C.C; Ohajianya, D.O; Orebiyi, J.S; Onyemauwa, C. S. and O.C. Korie Department of Agricultural Economics, Federal University of Technology, P.M.B, 1526, Owerri,
Imo State, Nigeria
Email: [email protected]
ABSTRACT: Agriculture led growth played an important role in reducing poverty and transforming the economies of many Latin American Countries, but the same has not yet occurred in sub –Saharan Africa.
Most Countries in Sub-Saharan Africa have not yet met the criteria for a successful agricultural revolution.
Factor productivity still lags far behind the rest of the world. This has led to growing doubt about the relevance of agriculture to growth and poverty reduction in the region, especially in Nigeria. As a result the promotion of off farm activities as part way out of poverty has gained widespread support among development agencies. However little policy efforts have been made to promote the off farm sector to reduce poverty and overcome potential constraints in counties of sub-Saharan Africa like Nigeria. Results indicate that self employed activities dominate source of farm income. The share of non farm income is positively correlated with overall income. The econometric analysis show that households with low education and infrastructure are constrained in their ability to participate in non farm activities. Policy implication is that barriers for disadvantaged households to participate in better paying non farm income activities need to be overcome to promote crop and livestock activities which will benefit the poor more than the rich. [Academia Arena, 2010;2(8):29-33] (ISSN 1553-992X).
Key words: Farm, off farm, income, diversification, self employment, Push factors.
INTRODUCTION
Non-farm activities have become an important component of livelihood strategies among rural households. Different studies have reported an increasing share of non-farm income in total household income, Haggblade et al: 2007 de Janvry and sadoulet, 2001, Ruben and van de Bercy, 2001). The reasons for this observed income diversification include declining farm incomes and desire to insure against agricultural production risk (Lanjouw, 1999). Household are pulled into the off farm activities when returns to non farm employment are higher and less risky than in agriculture.
Also when farming is less profitable and move risky due to population growth and market failures, many households are pushed into non- farm activities (Reardon, 1997). Many studies assume that the distress effects dominate.
Although the findings presented in this paper are specific to the study area, they may contribute to a better general understanding of the issues and linkages.
MATERIALS AND METHODS
An interview–based survey of households was carried out in the study area.
The information collected was representative of Owerri Agricultural zone in South East of Nigeria. Farm enterprises are small in size, that most production is net buyers of food.
The sample consists of 200 farm households which were chosen by a multi-stage random sampling technique. Eight out of the 16 Local Government Areas (LGA’s) were randomly selected in the first stage. Then five villages were randomly selected from each of the eight Local Government Areas, and finally five households were sampled in each of the 40 villages using a complete village lists compiled for this study. The survey questionnaire are designed to gather information on household composition and other socio economic data, including details on the participation of individual household members in different income generating activities.
29
RESULT AND DISCUSSIONS
1.0 The descriptive statistics of the household characteristics is presented in table 1.
Table 1: Descriptive statistics of the Farm Households
Variable Description Mean Std.
Deviation Household size Number of household members 7 2.14
Age Age of household Head (yrs) 48 3.12
Education Numbers of yrs in school of the household Head (yrs)
8 1.4 Farm Size Area cultivated by household (ha) 0.87 6.44
Income Total household income per year (Naira/
month)
187,157,11 4.4 Electricity Dummy for access to electricity (yrs = 1,
No=0
0.58 022 Pipe–borne water Dummy for access to pipe borne water (yes
= 1, No = 0)
0.641 0.32 Tarred road Dummy for tarred road in the village (yes =
1, No =0)
0.550 6.42 Distance to market Distance from the village to the nearest
market place (KM)
10.2 4.24
The average household size is seven (7) persons per household. About 32 percent of the households are headed by women. The average educational status is fair showing that the households heads have an average of eight (8) years of formal education, which can be explained by the density of secondary education schools in the study area. The average farm size is 0.87 hectares which can be attributed to the high population pressure in the area. The infrastructure variables indicate that many of the farm households do not have access to electricity and pipe born water. Total household income is approximately N40 thousand per month.
2.0 STRUCTURE OF HOUSEHOLD INCOME.
The structure of farm household income is presented in table 2.
Table 2: Average composition of farm household income
Income Source Mean annual income
(N)
Std. Deviation Total farm income
Crop income Livestock income Export
1,272,846.00 127,284.60 190,926.90 38,185,92
20.4 14.5 30.2
Total non-farm income 59,872.59
Agric wage income 18,328.99 23.4
Non agric wage income 22,911,23 38.2
Self employment 88,372.76 22.4
Remittance 10,259,53 10.8
30
Academia Arena 2010:2(8)
31
To determine the extent of relationship between socio-economic factors and the level of non-arm income, four functional regression forms were tried, and a lead equation was chosen on the basis of R2, F-ratio, number of significant variables and a –priori expectations. Based on these attributes, the double log was chosen as the lead equation. The implicit regression function is of the form .
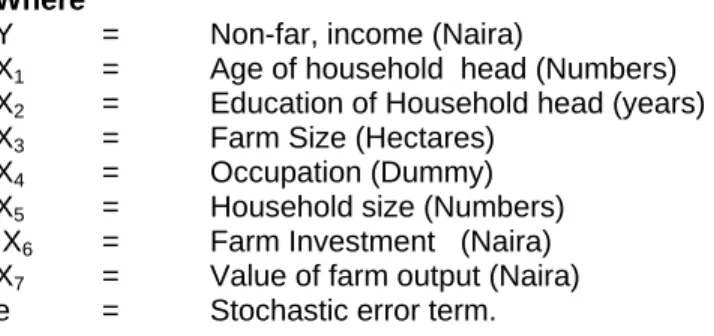
Y = ƒ (X1, X2, X3,X4,X5,X6,X7, e) Where
Y = Non-far, income (Naira)
X1 = Age of household head (Numbers) X2 = Education of Household head (years) X3 = Farm Size (Hectares)
X4 = Occupation (Dummy)
X5 = Household size (Numbers) X6 = Farm Investment (Naira) X7 = Value of farm output (Naira) e = Stochastic error term.
The estimated non – farm income parameters is presented in table 3.
Table 3: Parameter Estimates of the double Log function for Non farm Income among farm households
Variables Co-efficient Standard Error
T-value Unit of Measurement Age of House hold
head (X1)
-0.0519 0.0493 0.527 Years
Education of House hold head (X2)
0.0718 0.0207 3..4686* Years
Farm Size (X3) -0.1092 0.0418 -2.6124* Hectare
Occupation (X4) -0.0529 0.0497 -1.0644 Dummy
Household Size (X5)
-0.0849 0.0217 -3.9124* Number
Farm Investment (X6)
-0.0667 0.0599 -3.1135* Naira
Value of farm output (X7)
-0.0188 0.0075 -2.5067* Naira
Intercept -15821.2
Source: Field data: 2006
R2 = 0.6183
F Value = 9.7171
t (0.05) = 1.98
F (0.05) 7,42 = 2.24
* = Significant at five percent level.
The co-efficient of land holding size, occupation, household size, farm investment and hours spent on farm work have the expected signs. The most important result of this model from the point of view of Non farm income is found to be the coefficient for education. It should be noted that the coefficient is positive and significant at the chosen level of significance (0.05), indicating a rather strong relationship with Non Farm income. Its marginal effect is positive suggesting that households with higher education are more likely to seek non farm employment in rural areas. The marginal effect is 0.0718 showing that one additional year of education increases the probability of non farm employment by 7.18 percentage points. This is similar to the findings of parasada (2002) in India and Ibekwe (2001).
It is understandable that where the education of household workers is higher, they are reluctant to work in the farm sector as they have better prospects elsewhere. The coefficient for age of household heads was not significant and negatively correlated with Non farm income.
This may be due to the fact that the optimism mental and physical energy required for increased farm productivity declines with age.
This is most common in the rural communities where young people have migrated outside the communities (FAO, 1998). The coefficient for farm size was significant and negatively correlated with non farm income. This conforms to a prior expectation that increase in farm size will encourage farmers to increase their farm output and farm income. But due to the fact that Imo State is one of land deficient states in Nigeria (Ibekwe 2001) farmers are forced to diversify their activities which decreases income from farming due competitive nature of the non farm activities the farmers pursue. The coefficient of occupation of household heads was not significant and negatively correlated with non farm income this may be due to increased opportunity cost of the farm activities pursued by the farm households. The coefficient of household size is significant and negatively correlated with non farm income.
This may be due to the fact that most of the dependants in farm household at the community level are too young to migrate or work in the household farms. The coefficient farm investment was significant and negatively correlated with non farm income. This was in accordance with expectation as poor farm income can lead to low saving and consequently
to low investment in farming. This will make the farmers to invest outside their farms.
The coefficient value of farm output per hectare was found to be significant and negatively correlated with non farm income. A household per hectare agricultural output may effect its member’s decision to be engaged in non farm activities. Therefore a negative relationship is expected between per hectare value of agricultural output and non farm income. Households that fail in agriculture may be pushed into Non farm activities due to distress diversification. This therefore supports the hypothesis of negative link from agricultural income to traditional non farm income as against a positive link from agriculture to modern Non farm income due to agricultural growth (World Bank, 1996).
CONCLUSION:
A distress diversification hypothesis in this study is supported by negative relationship between non farm income and the farm output per hectare of land. We sought to account for a household involvement in non farm activities by reference to its demographic features and to other household specific characteristics such as occupation, education level, family size and land holding as well as farm output therefore, it can be inferred from the result that land holding size, years of workers education, per hectare value of agricultural output, occupation and age of household head are important factors for non farm income at the household level. This suggests that economic and social factors would matter in Non farm sector policy Southeast Nigeria if the distress diversification is to be ameliorated.
Corresponding Author:
C.S.Onyemauwa Department of Agricultural Economic,
Federal University of Technology P.M.B, 1526, Owerri, Imo State, Nigeria.
Email: [email protected]
REFERENCES
1. De Janvry, A. and E. Sadoulet (2001).
Income Strategies among Rural Households in Mexico. The Role of Off- Farm Activities.
World Development 29(3): 467-480.
2. FAO (Food and Agricultural Organisation) (1998). Rural Non Farm Income in Developing Countries. Special Chapter in
32
Academia Arena 2010:2(8)
33
FAO. The State of Food and Agriculture 1998; FAO, Rome.
3. Haggblade, S; Hazell, P. and T. Reardon (2007). Transforming the Rural Non- Farm Economy. John Hopkins University Press Baltimore.
4. Ibekwe, U.C. (2001), Income Distribution Among Farm Households in Orlu Agricultural Zone of Imo State: Unpublished Ph.D thesis, Department of Agricultural Economics, University of Nigeria Nsukka.
5. Lanjouw, P. (1999). Rural Non Agricultural Employment and Poverty in Ecuador Economic Development and Cultural Change; 48(1):91-122.
6. Parasada, R.M. (2002). The Determinants of Rural Off farm Employment in Two Villages
of Andra Pradish (India). Poverty Research Unit, University of Sussex.
7. Reardon, T. (1997). Using Edidence of Household Income Diversification to inform Study of the Rural Non farm Labour Market in Africa. World Development, 25 (5):735- 748.
8. Ruben, R. and M. Van den Berg.( 2001).
Non Farm Employment and poverty Alleviation of Rural Households in Honduras. World Development 29(3): 549- 560.
9. World Bank (1996). Nigeria: Poverty in the Midst of Plenty.The Challenge of Growth. A World Bank Poverty Assessment Report.
Population and Human Resources Division, World Bank, Washington,DC.
6/1/2010