Clincal Oral Implants Research
Effects of different types of intraoral scanners and scanning ranges on the precision of digital implant impressions in
edentulous maxilla: An in vitro study
Journal: Clinical Oral Implants Research Manuscript ID Draft
Manuscript Type: Original Research Date Submitted by the
Author: n/a
Complete List of Authors: Miyoshi, Keita; Showa University School of Dentistry, Prosthodontics Tanaka, Shinpei; Showa University, Department of Prosthodontics Yokoyama, Sawako; Showa University School of Dentistry, Prosthodontics
Sanda, Minoru; Showa University School of Dentistry, Prosthodontics Baba, Kazuyoshi; Showa University School of Dentistry, Prosthodontics Keywords: Morphometric analysis, Prosthodontics, Diagnosis, Clinical assessment
Clincal Oral Implants Research
Title
Effects of different types of intraoral scanners and scanning ranges on the precision of digital implant impressions in edentulous maxilla: An in vitro study
Running Head
Intraoral scanners and scanning ranges for edentulous jaw
Category: Original Research
Keita Miyoshi, D.D.S.a
Shinpei Tanaka, D.D.S., Ph.D.a Sawako Yokoyama, D.D.S,Ph.D.a Minoru Sanda, D.D.S., PhD.a Kazuyoshi Baba, D.D.S., Ph.D.a
aDepartment of Prosthodontics, Showa University School of Dentistry, Tokyo, Japan
Correspondence to:
Kazuyoshi Baba, D.D.S., Ph.D., Professor and Chair, Department of Prosthodontics, Showa University School of Dentistry, 2-1-1 Kitasenzoku, Ota-ku, Tokyo 145-8515, JAPAN Phone: +81-3-3787-1151 ext. 234
Fax: +81-3-3784-7603
Email: [email protected] 5
6 7 8 9 10 11 12 13 14 15 16 17 18 19 20 21 22 23 24 25 26 27 28 29 30 31 32 33 34 35 36 37 38 39 40 41 42 43 44 45 46 47 48 49 50 51 52 53 54 55 56 57 58
Clincal Oral Implants Research
Author Contribution:
K.M., S.T., S.Y., and K.B. came up with ideas. K.M. and S.Y. collected the data. K.M., S.T., and M.S. analyzed the data. K.M., S.T., M.S. and K.B. led the writing.
Keywords:
Digital impression, Dental implant, Scanning range, Precision, Intraoral scanner 5
6 7 8 9 10 11 12 13 14 15 16 17 18 19 20 21 22 23 24 25 26 27 28 29 30 31 32 33 34 35 36 37 38 39 40 41 42 43 44 45 46 47 48 49 50 51 52 53 54 55 56 57 58
Clincal Oral Implants Research
Abstract Objective:
This study aimed to evaluate the precision of digital implant impressions in comparison with conventional impressions and assess the impact of the scanning range on precision.
Materials and Methods:
A model of an edentulous maxilla with six implant analogs was scanned by using four intraoral scanners (IOSs) and a dental laboratory scanner five times each, and stereolithography (STL) data were generated. A conventional silicone impression was made and a working model was fabricated, which was scanned using the laboratory scanner. This procedure was also repeated 5 times. Nine different ranges of interest (ROIs) were defined, and the average discrepancies of the measurement points between each pair of STL images out of five for each ROI were calculated. The effects of "impression method" and "ROI" on the precision, as evaluated by the averaged discrepancy, were tested by two-way analysis of variance (ANOVA, p < 0.05).
Results:
Two-way ANOVA revealed that the effects of "impression methods" and "ROI" and their interactions were statistically significant. The discrepancies in the scanned datasets of the dental laboratory scanner were significantly higher than those in the other impression methods. The discrepancies of the IOSs were comparable with those of the laboratory scanner when the ROI was limited, however; the discrepancies deteriorated when the ROI expanded across the arch, while those of the laboratory scanner remained stable irrespective of the ROI.
5 6 7 8 9 10 11 12 13 14 15 16 17 18 19 20 21 22 23 24 25 26 27 28 29 30 31 32 33 34 35 36 37 38 39 40 41 42 43 44 45 46 47 48 49 50 51 52 53 54 55 56 57 58
Clincal Oral Implants Research
Conclusions:
Digital implant impressions obtained by IOSs may show clinically acceptable precision when the scan range is limited.
5 6 7 8 9 10 11 12 13 14 15 16 17 18 19 20 21 22 23 24 25 26 27 28 29 30 31 32 33 34 35 36 37 38 39 40 41 42 43 44 45 46 47 48 49 50 51 52 53 54 55 56 57 58
Clincal Oral Implants Research
1. Introductions
Digital impressions obtained using intraoral scanners (IOSs) have recently gained popularity and now play a central role in the advancement of digital dentistry because of their substantial advantages over conventional impressions, especially for dental implants. For example, digital impressions do not require resources such as custom trays, impression copings, elastic impression materials, and other laboratory components. Furthermore, digital impressions are generally more patient-friendly than the conventional method (Yuzbasioglu, Kurt, Turunc, Bilir, 2014; Schepke, Meijer, Kerdijk, Cune, 2015), especially when impressions are made for dental implants placed in the molar region. The trueness and precision of the captured dimensional images by the IOSs are reported to be equal or superior to those of the conventional methods (Papaspyridakos, et al., 2016; Amin, et al., 2017; Kamimura, Tanaka, Takaba, Tachi, Baba, 2017; Hayama, Fueki, Wadachi, Wakabayashi, 2018; Menini, Setti, Pera F, Pera P, Pesce P, 2018; Nedelcu, Olsson, Nyström, Rydén, Thor, 2018), however; they are also reported to be affected by the extent of impression range, with both trueness and precision deteriorating with an expansion of the impression range (van der Meer, Andriessen, Wismeijer, Ren, 2012; Su &
Sun, 2015; Gimenez-Gonzalez, Hassan, Ozcan, Pradies, 2017; Imburgia, et al., 2017;
Vandeweghe, Vervack, Dierens, De Bruyn, 2017; Ahlholm, Sipila, Vallittu, Jakonon, Kotiranta, 2018; Flügge, et al., 2018; Nedelcu, et al., 2018; Treesh, et al., 2018).
Impressions made for multiple screw-retained implant superstructures require higher dimensional trueness and precision than those for cement-retained superstructures or conventional crowns and fixed partial dentures, since misfits of the superstructures to the 5
6 7 8 9 10 11 12 13 14 15 16 17 18 19 20 21 22 23 24 25 26 27 28 29 30 31 32 33 34 35 36 37 38 39 40 41 42 43 44 45 46 47 48 49 50 51 52 53 54 55 56 57 58
Clincal Oral Implants Research
implant body might directly lead to treatment failures. The trueness and precision of digital impression methods for fabricating implant superstructures are reported to be equivalent to those of the conventional method (Papaspyridakos, et al., 2016; Menini, et al., 2018), while other studies have reported that the dimensional trueness and precision of digital impressions decreases as the impression ranges expand (Gimenez-Gonzalez, et al., 2017; Imburgia, et al., 2017; Vandeweghe, et al., 2017). However, none of the previous studies have systematically analyzed how the impression ranges affect the dimensional trueness or precision of the images captured by digital impression.
Therefore, this study investigated the influence of the impression ranges and the impression methods on the dimensional precision using a model of an edentulous maxilla with six embedded implant analogs. The null hypothesis of this study was that “impression method and the range of the impression do not affect the dimensional precision of the digital impression.”
2. Materials and Methods
2.1. Preparation of the reference model
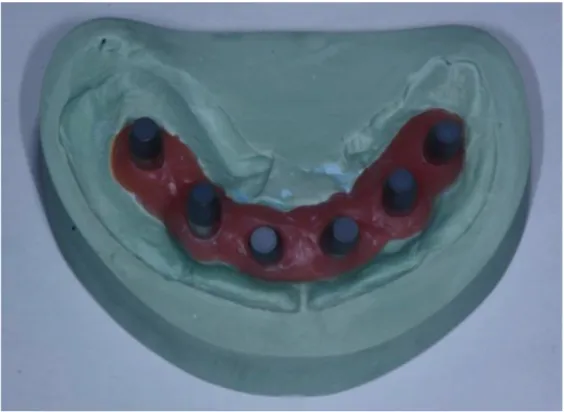
A reference model of a maxillary edentulous patient who received six implants (NobelSpeedy Groovy; Nobelbiocare, Kloten, Switzerland) with connected abutments (Multi-unit Abutment Brånemark System RP; Nobelbiocare, Kloten, Switzerland) was fabricated using type IV dental stone (NEW DIAROCK; MORITA, Osaka, Japan) with laboratory analogs (Abutment Replica Multi-unit Brånemark System RP; Nobelbiocare, Kloten, Switzerland).
5 6 7 8 9 10 11 12 13 14 15 16 17 18 19 20 21 22 23 24 25 26 27 28 29 30 31 32 33 34 35 36 37 38 39 40 41 42 43 44 45 46 47 48 49 50 51 52 53 54 55 56 57 58
Clincal Oral Implants Research
2.2. Impression making
2.2.1. Scanning with a dental laboratory scanner
Titanium scanbodies (Position Locator Multiple Nobelbiocare Multi-unit Abutment;
Nobelbiocare, Kloten, Switzerland) were connected to the analogs on the reference model (Fig.
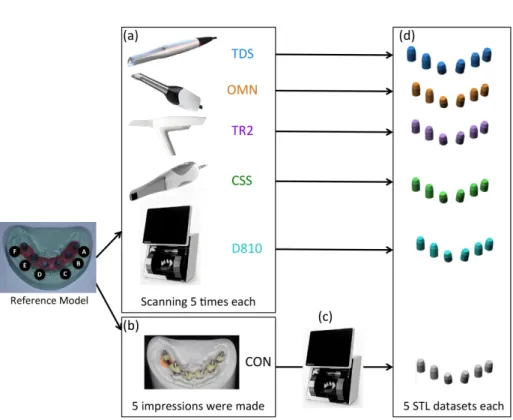
1). In order to prevent light reflections on the titanium surface of the scanbodies, which could interfere with the optical scanning procedure, a very thin layer of titanium oxide powder (CEREC Opti Spray; Sirona, Long Island City, NY, USA) was sprayed onto the surface. The model with the scanbodies was scanned five times by a dental laboratory scanner (D810;
3Shape, Copenhagen, Denmark; "D810"), and the captured image in each scan was exported in the stereolithography (STL) format (Fig. 3).
2.2.2. Digital impressions by IOSs
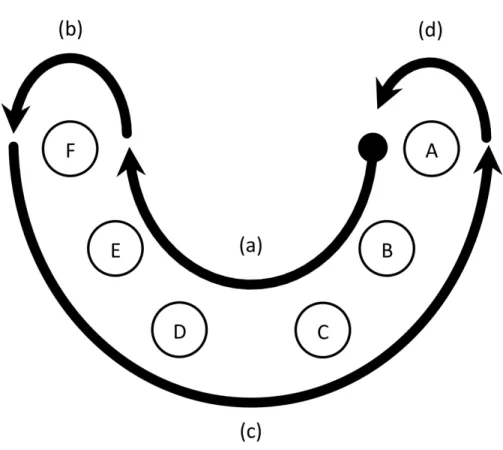
Four different IOSs were evaluated in this study: 3M True Definition Scanner (3M ESPE, Seefeld, Germany; "TDS"), Cerec Omnicam (Sirona, Long Island City, NY, USA; "OMN"), TRIOS Scanner 2 (3Shape, Copenhagen, Denmark; "TR2"), and CS 3600 (Carestream Health, Rochester, NY, USA; "CSS"). After the titanium oxide powder was sprayed on the reference model, the digital impression was made according to the manufacturer’s instructions except for the scan path, which was kept consistent irrespective of the type of scanner, as shown in Fig .2.
Although re-scanning was performed to complement the missing dataset captured at the first scan, the scanning operations were performed as one series of steps without pause and resume.
The impression making procedure was repeated 5 times for each IOS, and all of the captured images were exported in the STL format (Fig. 3).
5 6 7 8 9 10 11 12 13 14 15 16 17 18 19 20 21 22 23 24 25 26 27 28 29 30 31 32 33 34 35 36 37 38 39 40 41 42 43 44 45 46 47 48 49 50 51 52 53 54 55 56 57 58
Clincal Oral Implants Research
2.2.3. Conventional impression
Impression copings (Impression Coping Open Tray Multi-unit; Nobelbiocare, Kloten,
Switzerland) were connected to the analogs on the reference model, which were splinted using cobalt-chromium wires (diameter, 2.35 mm) and autopolymerizing acrylic resin (FIXPEED; GC, Tokyo, Japan). Whole-arch conventional impressions were made with a vinylpolysiloxane silicone impression material (Imprint4 Penta Heavy; Regular, 3 M ESPE, Seefeld, Germany) using custom trays. After the setting time, impressions were removed from the reference model and stored for 3 hours at room temperature and ambient humidity. Plaster models were
fabricated with dental stone (NEW FUJIROCK IMP; GC, Tokyo, Japan) and laboratory analogs according to the manufacturer’s instructions. Scanbodies were connected to the embedded analogs and then scanned by the dental laboratory scanner, similar to the scanning procedure for the reference model. Five duplicates were fabricated and scanned using the above protocol, and the captured images were exported in the STL format ("CON", Fig. 3).
2.3. Data analyses
Five STL datasets were obtained for each of the six impression methods ("D810", "TDS",
"OMN", "TR2", "CSS", and "CON") and then imported into a data analysis software
(PolyWorks Inspector, PolyWorks Japan, Tokyo, Japan). Each of the six scanbodies from #16 to #26 were named “A” to “F” in alphabetical order, as shown in Fig. 2.
In order to examine the dimensional precision of the five captured STL datasets, 10 possible combinations of pairs of STL images were compared using the best-fit-algorithm by the 5
6 7 8 9 10 11 12 13 14 15 16 17 18 19 20 21 22 23 24 25 26 27 28 29 30 31 32 33 34 35 36 37 38 39 40 41 42 43 44 45 46 47 48 49 50 51 52 53 54 55 56 57 58
Clincal Oral Implants Research
least-squares method. This algorithm first calculated the direction and closest distance of each vertex of the polygon of one dataset to the triangle surface of the corresponding polygon of the other dataset. The absolute values of all these values were averaged, which were utilized to evaluate the discrepancy between the STL datasets. Color mapping of the discrepancy for each corresponding measurement point was also displayed for visual inspections (Fig. 5).
In order to examine how the scanning ranges affect the precision, the STL data of nine different ranges of interest (ROIs), namely, "AB," "AC," "AD," "AE," "AF," "ABC," "ABCD,"
"ABCDE," and "ABCDEF," were investigated respectively (Figs. 4).
The averaged discrepancy values of 10 pairs from the 5 STL dataset were calculated for each ROI, and this procedure was conducted for the six impression methods.
2.4. Evaluation of the precision and statistical analyses
We conducted two different analyses as shown in Fig. 4. First, we evaluated the effects of six types of impression scanners ("D810", "TDS", "OMN", "TR2", "CSS", and "CON") and five patterns of ROIs with increase the number of scanbodies ("AB", "ABC", "ABCD", "ABCDE", and "ABCDEF") on the dimensional precision (Analysis 1). Second, the effects of five patterns of ROIs without increase the number of scanbodies (“AB,” “AC,” “AD,” “AE,” and “AF”), were investigated in order to control the effect of the number of scanbodies and the surface area of ROI on the measurement (Analysis 2). The effect of "impression methods" and "ROIs" as independent variables on the dimensional precision as evaluated by the averaged dimensional discrepancy for each condition was tested by the two-way analysis of variance (ANOVA), followed by Bonferroni adjusted probability tests as the post-hoc multiple comparisons. All 5
6 7 8 9 10 11 12 13 14 15 16 17 18 19 20 21 22 23 24 25 26 27 28 29 30 31 32 33 34 35 36 37 38 39 40 41 42 43 44 45 46 47 48 49 50 51 52 53 54 55 56 57 58
Clincal Oral Implants Research
statistical analyses were performed using SPSS version 22 (SPSS Inc., Chicago, IL, USA), and the level of significance was set at 0.05.
3. Results
Approximately 12,000 polygon points were obtained from the STL data of the ROI "ABCDEF"
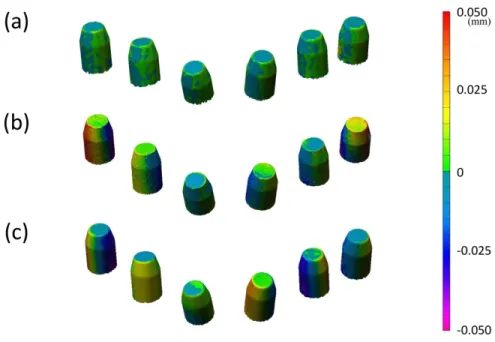
captured by "D810" and "CON." Similarly, 37,000 points were obtained using "TDS," 18,000 points using "TR2," 42,000 points using "OMN," and 33,000 points using "CCS." Figure 5 shows representative examples of color mapping of inter-measurement discrepancies between the STL data obtained from "D810," "TDS," and "CON." Visual inspection of the color mapping data demonstrated less discrepancy between repeated measurements using “D810”
than the other IOSs.
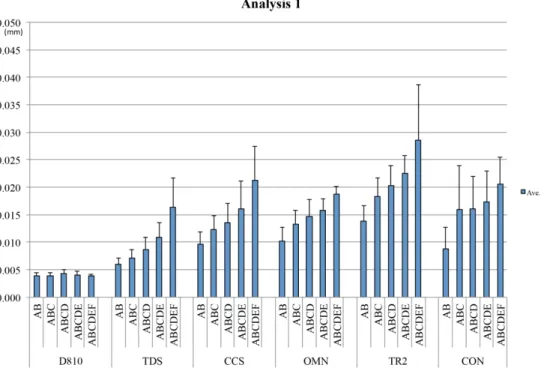
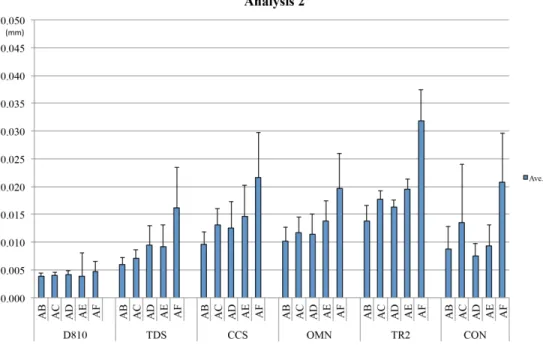
The results of the two-way ANOVA and multiple comparisons in Analysis 1 and Analysis 2 are shown in Tables 1 and 2, respectively. The measured values for each impression method in Analysis 1 and Analysis 2 are shown in Figs. 6 and 7, respectively. For both Analysis 1 and Analysis 2, the results of the two-way ANOVA revealed that the effect of "impression methods"
(F(5, 270) = 100.26, p < .0001 and F(5,270) = 44.67, p < .0001), the effect of "ROIs" (F (4, 270)
= 44.79, p < .0001 and F(4,270) = 32.07, p < .0001), and their interaction (F(20, 270) = 2.55, p
< .0004 and F(20,270) = 1.97, p < .0088) were statistically significant. The results of Tukey's multiple comparison tests revealed that the precision of “D810” was significantly higher than that of the other IOSs (Figs. 6, 7), which was consistent irrespective of the ROIs (Figs. 6, 7).
The precision of the digital impression by the IOSs tended to deteriorate as the ROIs expanded.
The same trend was found for the “CON,” and the precision levels of the ROIs "ABCDE" and 5
6 7 8 9 10 11 12 13 14 15 16 17 18 19 20 21 22 23 24 25 26 27 28 29 30 31 32 33 34 35 36 37 38 39 40 41 42 43 44 45 46 47 48 49 50 51 52 53 54 55 56 57 58
Clincal Oral Implants Research
"ABCDEF" were significantly lower than that of the ROI "AB" (Fig. 6). Moreover, for the ROI
"AB," all of the IOSs, as well as “CON,” showed excellent precision, which was comparable to
“D810.” Furthermore, "TDS" showed the same level of the precision as “D810” in the ROIs
"ABC" and "ABCD" (Table 1).
In Analysis 2, the same trends as Analysis 1 were found, where “D810” showed significantly higher precision, which was consistent irrespective of the ROIs. In contrast, the precision of all four IOSs and “CON” tended to deteriorate as the ROIs expanded (Table 2).
4. Discussions
4.1. Main findings
This study investigated the effects of impression methods and impression ranges on the dimensional precision on the generated STL dataset utilizing the edentulous maxilla model with dental implant analogs. On the basis of the results, we rejected the null hypothesis of this study, which was “impression method and the range of the impression do not affect the dimensional precision of the digital impression.” Specifically, the precision of the impressions obtained by the IOSs declined as the impression ranges expanded, while that of the dental laboratory scanner was not influenced by the range of the scan and was the highest among the scanners utilized in this study.
4.2. Trueness and precision of digital impression methods 4.2.1. Trueness and precision of digital impressions in general
A large number of studies have evaluated the dimensional trueness and precision of digital 5
6 7 8 9 10 11 12 13 14 15 16 17 18 19 20 21 22 23 24 25 26 27 28 29 30 31 32 33 34 35 36 37 38 39 40 41 42 43 44 45 46 47 48 49 50 51 52 53 54 55 56 57 58
Clincal Oral Implants Research
impressions. Five studies reported that digital impressions had the same level of trueness or precision as conventional impressions (Ender, Attin, Mehl, 2016; Papaspyridakos, et al., 2016;
Hayama, et al., 2018; Menini, et al., 2018; Nedelcu, et al., 2018), whereas five studies reported that the conventional impressions had better trueness or precision (Ender & Mehl 2013; Ajioka, Kihara, Odaira, Kobayashi, Kondo, 2016; Ender, et al., 2016; Kuhr, Schmidt, Rehmann, Wostmann, 2016; Alsharbaty, Alikhasi, Zarrati, Shamshiri, 2018), and two other studies
reported that digital impressions had better trueness or precision (Amin, et al., 2017; Kamimura, et al., 2017). These inconsistencies among the studies may be attributable to differences in the experimental settings, the range of the impression, data analysis methods, selection of the outcome data, or the capacity of the IOSs.
4.2.2. Full-arch digital impression for implant-supported prosthesis
Several studies that investigated full-arch digital impressions on an experimental model simulated the fabrication procedures for implant-supported superstructures for the edentulous jaw. They reported that digital impression methods had comparable trueness or precision with the conventional method (Papaspyridakos, et al., 2016; Menini, et al., 2018) or to had
significantly higher trueness (Amin, et al., 2017).
Ender et al. reported that the precision of the full-arch conventional impression of the natural dentition was better than or comparable to that of the digital impression. However, they also reported that both images captured by these two methods deteriorated at the distal region (Ender, et al., 2016). To complement this inaccuracy, several procedures such as verification index or soldering method are well established and utilized for conventional impressions. Since such 5
6 7 8 9 10 11 12 13 14 15 16 17 18 19 20 21 22 23 24 25 26 27 28 29 30 31 32 33 34 35 36 37 38 39 40 41 42 43 44 45 46 47 48 49 50 51 52 53 54 55 56 57 58
Clincal Oral Implants Research
techniques have not been established for digital impressions, it is still challenging to apply digital impressions to full-arch impressions, especially for a fabrication of screw- retained implant superstructures, which require the highest precision.
Regarding the effects of impression range, Imburgia et al. investigated the trueness and precision of digital impressions using the edentulous jaw model with six implants and the partially edentulous jaw model with three implants. They reported significantly higher trueness and precision of the captured images of the partially edentulous model than those of the full arch, suggesting that the digital impressions obtained by the IOS should be limited to partially edentulous cases (Imburgia, et al., 2017). In the study by Vandeweghe et al., the authors evaluated the trueness of 4 IOSs applied for implant impressions for the edentulous lower jaw with six implants. They found the largest discrepancies from the reference data captured by a highly accurate optical digitizer at the most posterior scanbodies, namely the scanbodies located at #36 and #46 (Vandeweghe, et al., 2017). Gimenez-Gonzalez et al., who investigated the full-arch digital impressions of fully edentulous maxilla with six implants scanned by four operators, also reported that the trueness of the scanned data deteriorated when the scan distance was longer (Gimenez-Gonzalez, et al., 2017).
Overall, the trueness and precision of digital impressions is reported to deteriorate with an increase in the scanned area, (van der Meer, et al., 2012; Su & Sun, 2015; Papaspyridakos, et al., 2016; Gimenez-Gonzalez, et al., 2017; Imburgia, et al., 2017; Vandeweghe, et al., 2017;
Ahlholm, et al., 2018; Nedelcu, et al., 2018; Treesh, et al., 2018), which is in agreement with the results of this study. Since the digital impression method cannot capture the whole dental image with a single scan, and scanned images of limited areas are connected and stitched to 5
6 7 8 9 10 11 12 13 14 15 16 17 18 19 20 21 22 23 24 25 26 27 28 29 30 31 32 33 34 35 36 37 38 39 40 41 42 43 44 45 46 47 48 49 50 51 52 53 54 55 56 57 58
Clincal Oral Implants Research
construct the whole image, the accumulation of errors increases as the range of the impression expands (Nedelcu & Persson, 2014; Su & Sun, 2015; Ender, et al., 2016; Kuhr, et al., 2016;
Gimenez-Gonzalez, et al., 2017; Vandeweghe, et al., 2017). On the other hand, dental laboratory scanners show higher precision regardless of the range of the impression because they can capture the entire range of the model in a single laser scan (Su & Sun, 2015; Sun, Lee, Choo, Hwang, Lee, 2018). Nedelcu reported that the dental laboratory scanner and the precise industrial scanner showed almost the same degree of trueness and precision, and the error was 0.010 mm or less (Nedelcu, et al., 2018).
The precision of the IOSs investigated in this study was comparable to that of the dental laboratory scanner in ROI "AB," which simulates a clinical situation where two implants were placed for the 3-unit fixed superstructures. It was also better or comparable when compared with the conventional method, suggesting that IOSs have clinically acceptable precision under this clinical situation. This result is in line with our previous in vivo study showing that the precision of the digital impression method was significantly higher than that of the conventional impression method (Kamimura, et al., 2017), as long as the range of the impression was limited to the molar region.
Interestingly, we also found significant differences in precision among the IOSs. More
specifically, the precision of "TDS" was comparable with the desktop scanner up to the ROI of four scanbodies, while that of “TR2” was significantly worse than that of the desktop scanner even when the ROI was limited to two scanbodies (Tables 1 and 2). Since statistical
significance does not always indicate clinical significance, these results should be interpreted carefully, and a conclusion cannot be drawn before other studies reproduce the same results.
5 6 7 8 9 10 11 12 13 14 15 16 17 18 19 20 21 22 23 24 25 26 27 28 29 30 31 32 33 34 35 36 37 38 39 40 41 42 43 44 45 46 47 48 49 50 51 52 53 54 55 56 57 58
Clincal Oral Implants Research
In this study, the number of scanbodies was increased with the expansion of the ROI, which was associated with the number of measurement points. In order to control their effect, we also conducted Analysis 2, in which the number of the scanbodies was constant (Figs. 6, 7). The associations were substantially unchanged after controlling this variable.
4.3. Study limitations
While the scan path recommended by the manufacturer differs depending upon the IOS, we standardized a scanning path (Fig. 2), which was consistent and different from the manufacturer’s recommendations. This may have affected image stitching and should be regarded as one of the study limitations. On the other hand, one previous study has reported that the impact of the scanning path on impression trueness is limited (Medina-Sotomayor, Pascual, Camps, 2018).
Scanning errors associated with image stitching tended to accumulate when the morphology of the scanned objects was flat or a plane such as a residual ridge (Flügge, et al., 2018), and the scanning trueness was reported to improve when some landmarks were added on the residual ridge (Kim, Amelya, Shin, Shim, 2017). Although this study tested various ROIs with the number of the scanbodies controlled in the second analysis, all of the datasets were derived from full-arch scanning of the reference model with six scanbodies. Therefore, scanbodies that were excluded from the ROIs might have contributed to the precision of the impression.
5. Conclusions
Within the limitations of this laboratory study, the precision of the digital impression 5
6 7 8 9 10 11 12 13 14 15 16 17 18 19 20 21 22 23 24 25 26 27 28 29 30 31 32 33 34 35 36 37 38 39 40 41 42 43 44 45 46 47 48 49 50 51 52 53 54 55 56 57 58
Clincal Oral Implants Research
deteriorated in association with the expansion of the scanned ranges. Therefore, digital impressions for implant treatment should be limited to small prostheses, such as a 3-unit supra-structure supported by two implants for the time being.
6. Acknowledgments
This work was supported by JSPS KAKENHI Grant Number 17K11764. The authors have no financial disclosures or conflicts of interest directly relevant to the content of this article.
5 6 7 8 9 10 11 12 13 14 15 16 17 18 19 20 21 22 23 24 25 26 27 28 29 30 31 32 33 34 35 36 37 38 39 40 41 42 43 44 45 46 47 48 49 50 51 52 53 54 55 56 57 58
Clincal Oral Implants Research
References
Ahlholm, P., Sipilä, K., Vallittu, P., Jakonen, M., & Kotiranta, U. (2018). Digital versus
conventional impressions in fixed prosthodontics: A review. Journal of Prosthodontics, 27, 35–41.
Ajioka, H., Kihara, H., Odaira, C., Kobayashi, T., & Kondo, H. (2016), Examination of the position accuracy of implant abutments reproduced by intra-oral optical impression. PLoS ONE, 11, 1–12.
Alsharbaty, M.H.M., Alikhasi, M., Zarrati, S., & Shamshiri, A.R. (2018). A clinical
comparative study of 3-dimensional accuracy between digital and conventional implant impression techniques. Journal of Prosthodontics, 00, 1–7.
Amin, S., Weber, H.P., Finkelman, M., El Rafie, K., Kudara, Y., & Papaspyridakos, P. (2017).
Digital vs. conventional full-arch implant impressions: a comparative study. Clinical Oral Implants Research, 28, 1360–1367.
Ender, A., Attin, T., & Mehl, A. (2016). In vivo precision of conventional and digital methods of obtaining complete-arch dental impressions. Journal of Prosthetic Dentistry, 115, 313–320.
Ender, A., & Mehl, A. (2013). Accuracy of complete-srch dental impressions: A new method of measuring trueness and precision. Journal of Prosthetic Dentistry, 109, 121–128.
Flügge, T., van der Meer, W.J., Gonzalez, B.G., Vach, K., Wismeijer, D., & Wang, P. (2018).
The accuracy of different dental impression techniques for implant-supported dental 5
6 7 8 9 10 11 12 13 14 15 16 17 18 19 20 21 22 23 24 25 26 27 28 29 30 31 32 33 34 35 36 37 38 39 40 41 42 43 44 45 46 47 48 49 50 51 52 53 54 55 56 57 58
Clincal Oral Implants Research
prostheses: A systematic review and meta-analysis. Clinical Oral Implants Research, 29, 374–392.
Gimenez-Gonzalez, B., Hassan, B., Özcan, M., & Pradíes, G. (2017). An in vitro study of factors influencing the performance of digital intraoral impressions operating on active wavefront sampling technology with multiple implants in the edentulous maxilla. Journal of Prosthodontics, 26, 650–655.
Hayama, H., Fueki, K., Wadachi, J., & Wakabayashi, N. (2018). Trueness and precision of digital impressions obtained using an intraoral scanner with different head size in the partially edentulous mandible. Journal of Prosthodontic Research, 62, 347–352.
Imburgia, M., Logozzo, S., Hauschild, U., Veronesi, G., Mangano, C., & Mangano, F.G. (2017).
Accuracy of four intraoral scanners in oral implantology: A comparative in vitro study.
BMC Oral Health, 17, 1–13.
Kamimura, E., Tanaka, S., Takaba, M., Tachi, K., & Baba, K. (2017). In vivo evaluation of inter-operator reproducibility of digital dental and conventional impression techniques.
PLoS ONE, 12, 1–12.
Kim, J.E., Amelya, A., Shin, Y., & Shim, J.S. (2017). Accuracy of intraoral digital impressions using an artificial landmark. Journal of Prosthetic Dentistry, 117, 755–761.
Kuhr, F., Schmidt, A., Rehmann, P., & Wöstmann, B. (2016). A new method for assessing the accuracy of full arch impressions in patients. Journal of Dentistry, 55, 68–74.
Medina-Sotomayor, P., Agustín Pascual, M., & Isabel Camps, A. (2018). Accuracy of four digital scanners according to scanning strategy in complete-arch impressions. PLoS ONE, 13, 1–14.
5 6 7 8 9 10 11 12 13 14 15 16 17 18 19 20 21 22 23 24 25 26 27 28 29 30 31 32 33 34 35 36 37 38 39 40 41 42 43 44 45 46 47 48 49 50 51 52 53 54 55 56 57 58
Clincal Oral Implants Research
van der Meer, W.J., Andriessen, F.S., Wismeijer, D., & Ren, Y. (2012). Application of intra-oral dental scanners in the digital workflow of implantology. PLoS ONE, 7, 1–8.
Menini, M., Setti, P., Pera, F., Pera, P., & Pesce, P. (2018). Accuracy of multi-unit implant impression: traditional techniques versus a digital procedure. Clinical Oral Investigations, 22, 1253–1262.
Nedelcu, R., Olsson, P., Nyström, I., Rydén, J., & Thor, A. (2018). Accuracy and precision of 3 intraoral scanners and accuracy of conventional impressions: A novel in vivo analysis method. Journal of Dentistry, 69, 110–118.
Nedelcu, R.G., & Persson, A.S.K. (2014). Scanning accuracy and precision in 4 intraoral scanners: An in vitro comparison based on 3-dimensional analysis. Journal of Prosthetic Dentistry, 112, 1461–1471.
Papaspyridakos, P., Gallucci, G.O., Chen, C.J., Hanssen, S., Naert, I., & Vandenberghe, B.
(2016). Digital versus conventional implant impressions for edentulous patients: Accuracy outcomes. Clinical Oral Implants Research, 27, 465–472.
Schepke, U., Meijer, H.J.A., Kerdijk, W., & Cune, M.S. (2015). Digital versus analog
complete-arch impressions for single-unit premolar implant crowns: Operating time and patient preference. Journal of Prosthetic Dentistry, 114, 403–406.e1.
Su, T., & Sun, J. (2015). Comparison of repeatability between intraoral digital scanner and extraoral digital scanner: An in-vitro study. Journal of prosthodontic research, 59, 236–42.
Sun, L.J., Lee, J.S., Choo, H.H., Hwang, H.S., & Lee, K.M. (2018). Reproducibility of an intraoral scanner: A comparison between in-vivo and ex-vivo scans. American Journal of Orthodontics and Dentofacial Orthopedics, 154, 305–310.
5 6 7 8 9 10 11 12 13 14 15 16 17 18 19 20 21 22 23 24 25 26 27 28 29 30 31 32 33 34 35 36 37 38 39 40 41 42 43 44 45 46 47 48 49 50 51 52 53 54 55 56 57 58
Clincal Oral Implants Research
Treesh, J.C., Liacouras, P.C., Taft, R.M., Brooks, D.I., Raiciulescu, S., Ellert, D.O., Grant, G.T.,
& Ye, L. (2018). Complete-arch accuracy of intraoral scanners. Journal of Prosthetic Dentistry, 120, 382–388.
Vandeweghe, S., Vervack, V., Dierens, M., & De Bruyn, H. (2017). Accuracy of digital
impressions of multiple dental implants: an in vitro study. Clinical Oral Implants Research, 28, 648–653.
Yuzbasioglu, E., Kurt, H., Turunc, R., & Bilir, H. (2014). Comparison of digital and
conventional impression techniques: Evaluation of patients’ perception, treatment comfort, effectiveness and clinical outcomes. BMC Oral Health, 14, 1–7.
Tables
Table. 1 - Results of Tukey's multiple comparison test in Analysis 1 (mm).
(Table 1 footnote)
The numbers in the cells in “Level” columns represent the precision level in each combination of ROI and impression method. Lower number indicate the higher level of precision level. Significant differences were found between the groups without shared numbers.
IMP, ROI Level Ave.(mm)
TR2,
ABCDEF 12 0.0286
TR2,
ABCDE 12 11 0.0226
CCS,
ABCDEF 11 10 0.0213
5 6 7 8 9 10 11 12 13 14 15 16 17 18 19 20 21 22 23 24 25 26 27 28 29 30 31 32 33 34 35 36 37 38 39 40 41 42 43 44 45 46 47 48 49 50 51 52 53 54 55 56 57 58
Clincal Oral Implants Research
CON,
ABCDEF 11 10 9 0.0206
TR2, ABCD 11 10 9 0.0203
OMN,
ABCDEF 11 10 9 8 0.0186
TR2, ABC 11 10 9 8 0.0183
CON,
ABCDE 11 10 9 8 7 0.0173
TDS,
ABCDEF 11 10 9 8 7 6 0.0164
CCS,
ABCDE 11 10 9 8 7 6 5 0.0162
CON, ABCD 11 10 9 8 7 6 5 0.0161
CON, ABC 11 10 9 8 7 6 5 0.016
OMN,
ABCDE 11 10 9 8 7 6 5 0.0158
OMN, ABCD 10 9 8 7 6 5 4 0.0147
TR2, AB 9 8 7 6 5 4 0.014
CCS, ABCD 8 7 6 5 4 3 0.0134
OMN, ABC 8 7 6 5 4 3 0.0132
CCS, ABC 8 7 6 5 4 3 2 0.0124
TDS,
ABCDE 7 6 5 4 3 2 0.011
OMN, AB 6 5 4 3 2 1 0.0103
CCS, AB 5 4 3 2 1 0.0095
CON, AB 4 3 2 1 0.0088
TDS, ABCD 4 3 2 1 0.0086
TDS, ABC 3 2 1 0.0069
TDS, AB 2 1 0.0058
D810,
ABCD 1 0.004
D810,
ABCDE 1 0.004
5 6 7 8 9 10 11 12 13 14 15 16 17 18 19 20 21 22 23 24 25 26 27 28 29 30 31 32 33 34 35 36 37 38 39 40 41 42 43 44 45 46 47 48 49 50 51 52 53 54 55 56 57 58
Clincal Oral Implants Research
D810,
ABCDEF 1 0.0039
D810, AB 1 0.0039
D810, ABC 1 0.0038
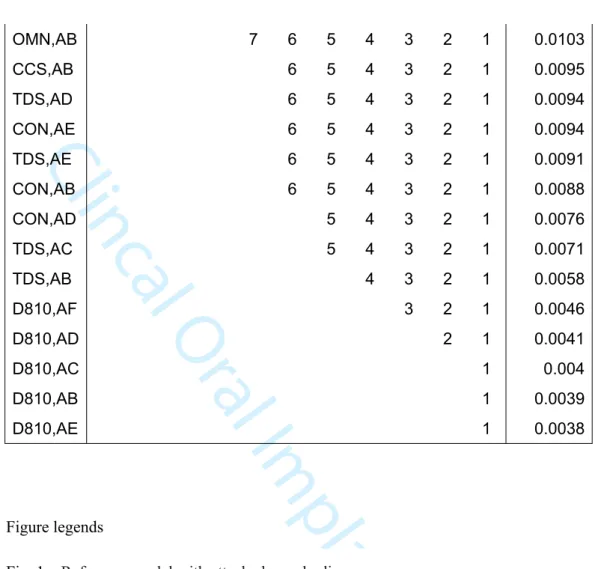
Table. 2 - Results of Tukey's multiple comparison test in Analysis 2 (mm).
(Table 2 footnote)
The "level" number in the table represent the level of a precision in each ROI of each impression method. "1" indicates the highest precision level, and 10 indicates the lowest precision level. Significant differences were found between the groups without shared numbers.
IMP,
ROI Level Ave.(mm)
TR2,AF 10 0.0317
CCS,AF 9 0.0218
CON,AF 9 8 0.0209
OMN,AF 9 8 7 0.0196
TR2,AE 9 8 7 0.0196
TR2,AC 9 8 7 6 0.0175
TR2,AD 9 8 7 6 5 0.0164
TDS,AF 9 8 7 6 5 0.0163
CCS,AE 9 8 7 6 5 4 0.0147
TR2,AB 9 8 7 6 5 4 0.014
OMN,AE 9 8 7 6 5 4 3 0.0138
CON,AC 9 8 7 6 5 4 3 2 0.0134
CCS,AC 9 8 7 6 5 4 3 2 1 0.013
CCS,AD 8 7 6 5 4 3 2 1 0.0124
OMN,AC 8 7 6 5 4 3 2 1 0.0118
5 6 7 8 9 10 11 12 13 14 15 16 17 18 19 20 21 22 23 24 25 26 27 28 29 30 31 32 33 34 35 36 37 38 39 40 41 42 43 44 45 46 47 48 49 50 51 52 53 54 55 56 57 58
Clincal Oral Implants Research
OMN,AB 7 6 5 4 3 2 1 0.0103
CCS,AB 6 5 4 3 2 1 0.0095
TDS,AD 6 5 4 3 2 1 0.0094
CON,AE 6 5 4 3 2 1 0.0094
TDS,AE 6 5 4 3 2 1 0.0091
CON,AB 6 5 4 3 2 1 0.0088
CON,AD 5 4 3 2 1 0.0076
TDS,AC 5 4 3 2 1 0.0071
TDS,AB 4 3 2 1 0.0058
D810,AF 3 2 1 0.0046
D810,AD 2 1 0.0041
D810,AC 1 0.004
D810,AB 1 0.0039
D810,AE 1 0.0038
Figure legends
Fig. 1 – Reference model with attached scan bodies
Fig. 2 – Scanning sequence.
(Fig. 2 footnote)
(a) Scan with IOS started from the linguo-occlusal surface of the scan body of #16: A. The lingual and the occlusal surface were continuously scanned until the scan body of #26: B, (b) Scanner turned around the scan body B from the lingual to the buccal side. (c) From the bucco-occlusal surface of the scan body B, the buccal and occlusal surfaces were scanned continuously until the scan body A. (d) Scanner turned around the scan body A from the buccal 5
6 7 8 9 10 11 12 13 14 15 16 17 18 19 20 21 22 23 24 25 26 27 28 29 30 31 32 33 34 35 36 37 38 39 40 41 42 43 44 45 46 47 48 49 50 51 52 53 54 55 56 57 58
Clincal Oral Implants Research
to the lingual side (e) Rescan was performed to complement the missing dataset at the first scan.
Fig. 3 – Flowchart of harvesting STL datasets with digital impression (using IOSs), dental laboratory scanner and conventional silicone impression.
(Fig. 3 footnote)
(a) Scanning with IOSs or a dental laboratory scanner was repeated five times for each scanner.
(b) Five conventional impressions with silicone impression materials were taken and working casts were fabricated. (c) Five working casts were scanned by a dental laboratory scanner and STL datasets were generated. (d) All STL datasets were trimmed and confined to the images of scan bodies.
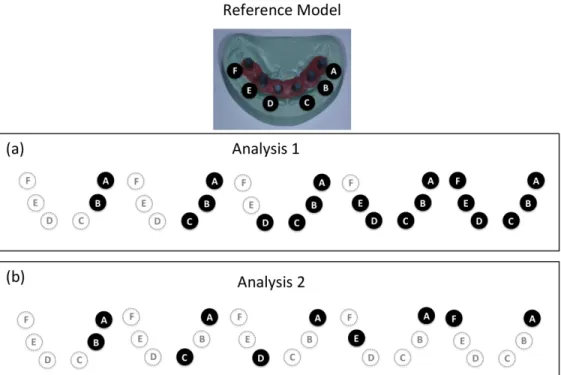
Fig. 4 – Illustrations of two different analyses (Analysis 1 and Analysis2) for evaluating the effects of ROIs on the precision of impression methods.
(Fig. 4 footnote)
(a) In the Analysis 1, we evaluated five patterns of ROIs ("AB", "ABC", "ABCD", "ABCDE", and "ABCDEF") with increase the number of scanbodies. (b) In the Analysis 2, we evaluated five patterns of ROIs ("AB", "AC", "AD", "AE", and "AF") without increase the number of scanbodies.
5 6 7 8 9 10 11 12 13 14 15 16 17 18 19 20 21 22 23 24 25 26 27 28 29 30 31 32 33 34 35 36 37 38 39 40 41 42 43 44 45 46 47 48 49 50 51 52 53 54 55 56 57 58
Clincal Oral Implants Research
Fig. 5 – Color-coded deviation maps produced by superimposing two STL datasets through the best-fit algorithm in each IOS for the ROI “ABCDEF” (a) D810, (b) TDS, (c) CON
Fig. 6 - Average discrepancy in each impression method for each ROI in Analysis 1 (mm).
Fig. 7 - Average discrepancy in each impression method for each ROI in Analysis 2 (mm).
5 6 7 8 9 10 11 12 13 14 15 16 17 18 19 20 21 22 23 24 25 26 27 28 29 30 31 32 33 34 35 36 37 38 39 40 41 42 43 44 45 46 47 48 49 50 51 52 53 54 55 56 57 58
Clincal Oral Implants Research
Fig. 1 – Reference model with attached scan bodies
5 6 7 8 9 10 11 12 13 14 15 16 17 18 19 20 21 22 23 24 25 26 27 28 29 30 31 32 33 34 35 36 37 38 39 40 41 42 43 44 45 46 47 48 49 50 51 52 53 54
Clincal Oral Implants Research
Fig. 2 – Scanning sequence.
(Fig. 2 footnote)
(a) Scan with IOS started from the linguo-occlusal surface of the scan body of #16: A. The lingual and the occlusal surface were continuously scanned until the scan body of #26: B, (b) Scanner turned around the scan body B from the lingual to the buccal side. (c) From the bucco-occlusal surface of the scan body B, the
buccal and occlusal surfaces were scanned continuously until the scan body A. (d) Scanner turned around the scan body A from the buccal to the lingual side (e) Rescan was performed to complement the missing
dataset at the first scan.
5 6 7 8 9 10 11 12 13 14 15 16 17 18 19 20 21 22 23 24 25 26 27 28 29 30 31 32 33 34 35 36 37 38 39 40 41 42 43 44 45 46 47 48 49 50 51 52 53 54
Clincal Oral Implants Research
Fig. 3 – Flowchart of harvesting STL datasets with digital impression (using IOSs), dental laboratory scanner and conventional silicone impression.
(Fig. 3 footnote)
(a) Scanning with IOSs or a dental laboratory scanner was repeated five times for each scanner. (b) Five conventional impressions with silicone impression materials were taken and working casts were fabricated.
(c) Five working casts were scanned by a dental laboratory scanner and STL datasets were generated. (d) All STL datasets were trimmed and confined to the images of scan bodies.
5 6 7 8 9 10 11 12 13 14 15 16 17 18 19 20 21 22 23 24 25 26 27 28 29 30 31 32 33 34 35 36 37 38 39 40 41 42 43 44 45 46 47 48 49 50 51 52 53 54
Clincal Oral Implants Research
Fig. 4 – Illustrations of two different analyses (Analysis 1 and Analysis2) for evaluating the effects of ROIs on the precision of impression methods.
(Fig. 4 footnote)
(a) In the Analysis 1, we evaluated five patterns of ROIs ("AB", "ABC", "ABCD", "ABCDE", and "ABCDEF") with increase the number of scanbodies. (b) In the Analysis 2, we evaluated five patterns of ROIs ("AB",
"AC", "AD", "AE", and "AF") without increase the number of scanbodies.
5 6 7 8 9 10 11 12 13 14 15 16 17 18 19 20 21 22 23 24 25 26 27 28 29 30 31 32 33 34 35 36 37 38 39 40 41 42 43 44 45 46 47 48 49 50 51 52 53 54
Clincal Oral Implants Research
Fig. 5 – Color-coded deviation maps produced by superimposing two STL datasets through the best-fit algorithm in each IOS for the ROI “ABCDEF” (a) D810, (b) TDS, (c) CON
5 6 7 8 9 10 11 12 13 14 15 16 17 18 19 20 21 22 23 24 25 26 27 28 29 30 31 32 33 34 35 36 37 38 39 40 41 42 43 44 45 46 47 48 49 50 51 52 53 54
Clincal Oral Implants Research
Fig. 6 - Average discrepancy in each impression method for each ROI in Analysis 1 (mm).
5 6 7 8 9 10 11 12 13 14 15 16 17 18 19 20 21 22 23 24 25 26 27 28 29 30 31 32 33 34 35 36 37 38 39 40 41 42 43 44 45 46 47 48 49 50 51 52 53 54
Clincal Oral Implants Research
Fig. 7 - Average discrepancy in each impression method for each ROI in Analysis 2 (mm).
5 6 7 8 9 10 11 12 13 14 15 16 17 18 19 20 21 22 23 24 25 26 27 28 29 30 31 32 33 34 35 36 37 38 39 40 41 42 43 44 45 46 47 48 49 50 51 52 53 54