Tech. Fac. Agr Kagawa
TENSAMMETRIC WAVE OF DIETHYLETHER
I N
SQUARE-WAVE POLAROGRAPHY
Yoshiaki
FUKUI,
Kazuo KUWAYAMAIn 1935, PROSKURNIN et al.(l: investigated the effect of surf ace-active substances on the differential capacity of electrodes. They found that in the presence of a surface-active substance the differencial capacity was m a ~ k e d l y lowered a t potentials around electrocapil- lary maximum and showed sharp peaks at either end of this region. On the other hand, t h e adsorption process in the alternating current (a .c.) polarogr aphy was first investigated by BREYER et al.
c 2 )
and Doss et a1. c 3 ) They found independently that the a.c.polarograms of surface- active substances resembled to the diff erencial capacity - potential curves obtained by PROSKURNIN for the sur face-active substances. From this fact, such polarographic waves were named "tensammetr ic wave" by BREYER et nl. ( 7 and distingished from the reduction waves.The materials investigated tensammetr ically are, as summarized by
BREYER
and NA U E R ' ~ ) several alcohols, pyridine, methyl cellulose and others. Recently MARUYAMA et al. (0 inv- estigated the tensammeric waves of dehydrocholic, cholic and deoxycholic acid in a . C. pol- arography.A preliminary investigation on ether was made by G U P ~ A who observed a nagative, but not a positive, tensammeric wave with ether in 0.1 M KC1 and in 0.1 M KI : the hei- ght of the wave was greater a t pH 10.2 than a t pH 5.6 and the summit potential shifted to more negative values with pH. The present report concerns with detailed investigation of the tensammetric behaviors of ether in square-wave polarography.
Experimental
Yanagimoto polarograph PA-202 was used in this experiment. The polarographic cell of t h e usual type was used and the mercury pool a t the bottom of the cell a s the anode. Elec- trocapillary measurements were made by the conventional drop-time technique") : the dro- pping mercury electrode was polarized a t a fixed potential and the time of 10 drops was measured using a stop watch, and then the time was plotted against potential. The oxygen disolved in ether solution was not removed in this experiment, because the tensammeric waves of ether solution disolved oxygen were well defined and were not affected by the disolved oxygen under the experimental condition. Unless otherwise stated, all the measur- ments were made in a water thermostat at 25+0.1°C.
Diethylether, methanol and ethanol used were purified by distillation and all other chemicals were of guaranteed grade.
Vol 21 (No.48) (1970) 179 Results and Discussion
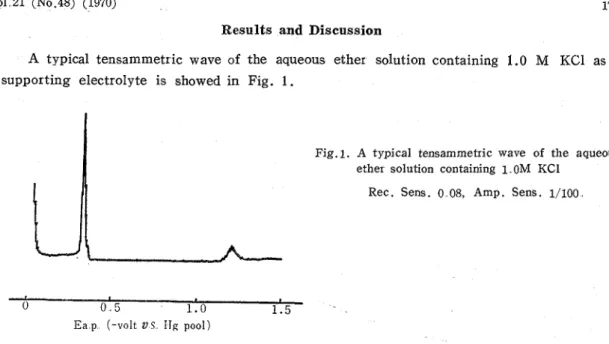
A typical tensammetric wave of the aqueous ether solution containing 1.0 M KC1 as supporting electrolyte is showed in Fig. 1.
Fig.1. A typical tensammetric wave of the aqueous ether solution containing 1 OM KC1
Rec. Sens.
o
08, Amp. Sens. 1/100--
0 0 5 1 . 0 1.5Ea p (-volt Z) C IIg pool)
Also in this polarogram, whatever Na2S04, NaClOa, KCl, KNOs, NH4C1 and HC1 were used as supporting electrolyte, the tensammetric wave obtained with ether showed very sharp peak. However, the potential of peak varied with the change of electrolytes a s shown in Table 1.
Table 1.. Tensammetric waves of ether in various supporting electrolytes Ether conc. 1 . 0 vol.. %, Rec. Sens. 0..08, Amp.. Sens. 1/100..
-
1 st. peak
I
2 nd peakSupporting electrolyte (1..O M)
Height Summit potential (cm) (V, vs. Hg pool)
Height Summit potential (cm> (V.. vs.Hg pool) HCl KC1 NHcC1 NazSO4 NaC104 KNOs NaOH - - . -- - - .- . -
The height of the first peak for the same ether concentration decreased by the change of the electrolyte in the order of Na2S01> KCI>NH4CI>HCI>KNO~>NaC104. This effect of the electrolyte was similar to that obtained by TSUJI in the tensammetric investigation of cyclohexanon(s). Moreover, the influence of anion of the electrolyte on the first peak- height of ether would be greater than that of cation. The theoretical studies on t h e influ- ence of anion were done by SENDA et a1. ( 9 )
1. Relation between the concentration of ether and the height of peak
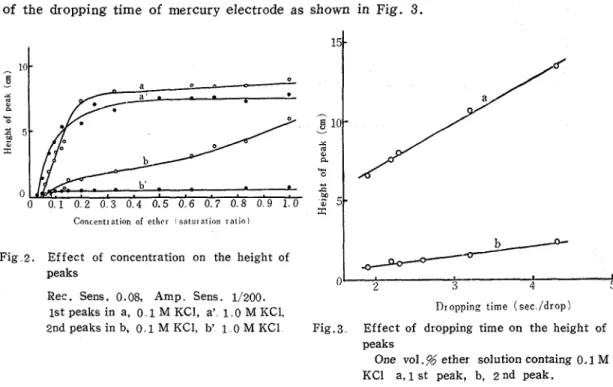
In Fig. 2 , the heights of the tensammetric wave of the aqueous ether solutions cotain- ing KC1 as supporting electrolyte were plotted against the concentration of ether.
180 Tech.. Bull. Fac. Agr
.
Kagawa Univ. The height of the first peak, both in 0.1 M KC1, and 1.0 M KC1, sharply increared in the dilute solution with the increase of concentration of ether t o a maximum and then maintained a constant value independent of the concentration. These curves indicated the shape of LANGMUIR'S adsorption-isotherm curve in the same manner as quinon reported by B R E Y E R ' ~ ~ ) . Therefore, ether seems to be adsorbed on the mer cur y-electrode surface in the state of monolyer. Beseides, the establishment of the adsorption equilibrium might be not so much rapid (I1) because the height of the first peak decreased with the decreaseof the dropping time of mercury electrode as shown in Fig. 3.
Concentration of e t h c ~ 1 ?.?turntion r a t i o )
>
a-Fig 2. Effect of concentration on the height of
peaks O
L
y
25
-
4 5 LRec. Sens. 0.08, Amp Sens. 1/200.
1st peaks in a, 0 1 M KCI, a' 1 0 M KC1, 1)ropping time ( s e c / d r o p ) 2nd peaks in b, 0 . 1 M KCl, b' 1 0 M KC1 Fig.3 Effect of dropping time on the height of
peaks
One vo1.g ether solution containg 0.1 M KC1 a, 1 st peak, b, 2 nd peak.
While the second peak--height continually increased with the increase of the concen- tration and did not reach to a constant value in case of the supporting electrolyte of 0.1 M KC1. On the other hand, in case of the 1.0 M KC1 the second peak-height of ether was almost constant in all the regions of the concentrations. The curves of the height-conce- ntration of the second peak were entirely different from that of the first peak.
Fig.4. Effect of concentration on the summit potential of peaks
Rec Sens 0.08, Amp.Sens 1/200.
-
I s t peak in a, 0 1 M KCl, a', 1.0 M KC1, 2 nd peak in b. 0 1 M KCl, bf, 1 0 M KC1 0 0 0 1 0 2 0 3 0 4 0 5 0 6 0 7 0 8 0 9 1 0 Concentration of ether ( s a t u r a t ~ o n r a t l o )Moreover, the changes in peak potenial with the concentration of ether were shown in Fig. 4. As the concentration decreased, the potentials of the first peak slightly shifted to
Vol 21 (No.48) (1970) 181 more positive values, whereas that of the second peak shifted to more negative values. Therefore, in the dilute solution, the distance between the two peaks became more smaller. This fact means that in the dilute solution the adsorption of ether on the mercury-electr
-
ode surface occurrs in a narrow potential region. These behaviors of ether in square-wave polarogr aphy were consistent with those of general tesammer ic wave in a. c. polarlogra- phy. ( 4 X12'2 . E f f e c t o t temperature
The tensammeric wave of the aqueous 1.0 vol.% ether solution containing three different electrolytes of 1.0 M KCI, KN03 and HC1 was measured at the different temperature of the range of 0" to 40°C.
As shown in Fig. 5 the height of the first peak rapidly decreased with the increase of temperature and almost disappeared a t 40°C, while the second peak-height, being small even at a low temperature, did not vary with temperature. Such a drastic decrease of the first peak-height would be expected from general adsorption theory.
Fig , 5 . Effect of temperature on the height of peaks
One vol % ether solution Rec Sens 0 08, Amp. Sens 1/200.. 1 s t peak in a , 1 0 M KC1, b, 1 0 M KN03, c, 1 OM HCl 2 n d peak in a' 1 0 M KCI, b1 1 0 M KNOs o+--~ 10 20 a 30 40 retnpel ature ( C i
Fig, 6 , Effect of temperature on the summit potential
One voi % ether solution. Rec Sens 0 08, Amp Sens 1/200
I s t peak in a, 1 0 M KCl, b, 1 0 M KN03, c, 1 OM HCI
2 nd peak in a' 1.0 M KCl, b l , 1 0 M KN03
However, the change in the summit potential (Fig.6) was not so wide as that in the peak-height. Moreover, the distance between the first and the second peaks in a same wave always keeped a certain value even under the higher temperature at which the wave was almost disappeared. Consequently, the potential region in which ether was adsorbed on the mercury electrode did not so vary with tempe:atur'e, But the adsorption oc-urred at the higher temperature would be weak and might be not so influenced on the capacity of electrodouble layer.
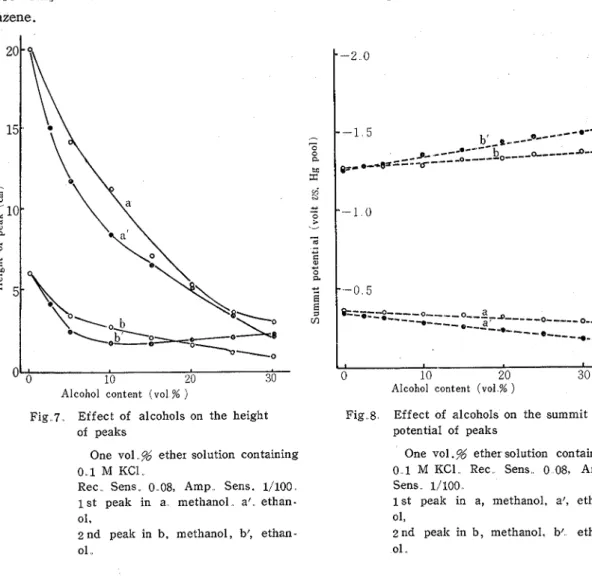
Fig. 7 . Effect of alcohols on the height 3. Effect s f alcohols
Effect of alcohols on tensammetric wave with ether was measured on t h e aqueous 1.0 v o 1 . s ether solution containing 0.1 M KC1 and the increasing amounts of methanol and ethanol. The obtained peak-heights and summit potentials of t h e wave were plotted against the contents of alcohol in Figs. 7 and 8. T h e peak-height sharply decreased with the increase of alcohol content and the peak disappeared when the alcohol content reached to 30%. No essential difference between methanol and ethanol in the effect was observed. Similar effects of methanol were reported by GUPTA et aZ.(13)(") They showed t h a t a change
in solvent from water to methanol decreased the magnitude of the tensammettic peak of bromothymol blue and also removed the influence of adsorption on polarogram of nitrobe- nzene. of peaks
-
-
a5
>3
+--
-
m-
+- C al-
a +- BOne vol..% ether solution containing 0 . 1 M KCl..
Rec. Sens. 0..08, Amp. Sens. 1/100. 1 s t peak in a methanol. a', ethan- ol.
2 n d peak in b, methanol, b: ethan- ol ,.
--2 0
--1 5
y-*
-,--- a*--,---*------*--
es- a-,zz+ -,--
-
o-.---b----~---~--
--I 0 --0 5 * - - o - - - - o - . - - - ~ - - a - ~ am-*----
---
---,--o-----
e--2--,--
--, a----*--
-
0 10 20 30Fig 8 Effect of alcohols on the summit potential of peaks
Alcohol c o n t e n t ("01 % ) Alcohol content ("01% )
One vol .9& ether solution containing 0 1 M KC1 Rec Sens 0 08, Amp. Sens 1/100
1 s t peak in a, methanol, at, ethan- ol,
2 nd peak in b, methanol, bf ethan- ol
On the other hand, as will be seen from Fig. 8, the distance between the first and the second summit potentials was enlarged with the increase of alcohol content. Consequently, in spite of the fall of the peak-height, the distance between the first and the second peak increased, when alcohol was added to ether solution.
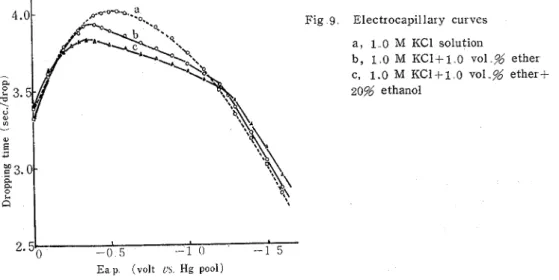
V01.21 (No 48) (1970) 183 ether solution containg 1.0 M KC1 in the absence and presence of ethanol. T h e obtained drop-time curves (electro-capillary curves) a r e shown Fig. 9. T h e curve of t h e 1.0 ~01.5%
Fig 9 Electrocapilla~ y curves a , 1 0 M KC1 solutioii
b, 1 0 M KCl+l
o
vol % ether c, 1.0 M KCI-t 1 0 vol % ether+
20% ethanol
L
2.50
-
-0 5-- 1 0 -1 5
E a p (volt 0, Hg pool)
ether solution containing 1.0 M KC1 showed t h a t ether was adsorbcd on t'le mercury elec- trode surface a t the range of -0.36 t o -1.21 volt vs. mercury pool. T h e curve of the 1.0 vol.% ether -- 1.0 M KC1 solution containing 20% ethanol also showed the adsorption which had t h e enlarged potental region ( - 0.35- - 1.28v.) Moreover, both the potentials of either end of the adsor ption-region of electr ocapillar y curves corresponded t o t h e summit potential of tensammeric peak of the ether solution.
Recently MARUYAMA et al.C6) suggested that the two surface-active substances, having
a comparable activity and showing a similar tensammetric peak a t near potential, could be adsorbed cooperatively on the mercury-electrode surface. From the suggestion and the ele- ctrocapillary curves, i t seemed t o be consideled that a s if alcohol had existed together with ether, t h e adsorption of ether on the meIcury electrode would not be removed com- pletely by alcohol and would occur weakly a t the potential region in which alcohol was adsorbed.
4 . E f f e c t of gate-nu mber
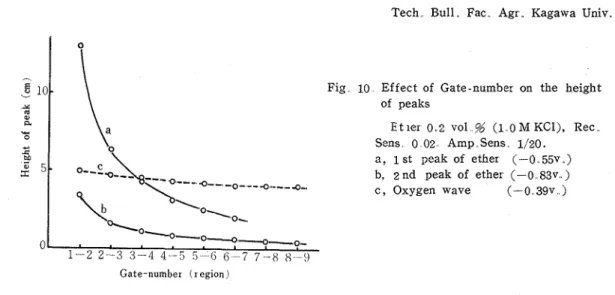
T h e gate equipted in t h e Yanagimoto polarograph PA 202 cuts off the non-faradaic cur - rent and passes the faradaic current t o recorder, so that it contributes t o rise t h e analytical sensibility of square-wave polarograms. This action i s controlled by the value of gate- number. Effect of change in the gate-number on the polarogram of t h e 0.2 vol. % ether solution containing 1.0 M KC1 was investigated. The peak-heights of the obtained polaro- grams plotted against t h e g a t e number in Fig. 10.
The height of the fir s t peak of ether decreased very rapidly with the enla~gement of the gate-number
.
From this curve, i t is apparent that the large amounts of currents causing the first peak flows immediatly after the conversion of the superimposed squa:e wave volt- age. Therefore, i t seemed that the first peak had the typical tensammetric nature. However,Fig 10 Effect of Gate-number on the height of peaks
E t ler 0 2 vol % (1 0 M KCl), Rec Sens 0 02 Amp Sens 1/20. a , I s t peak of ether (--0 55v )
b, 2 n d peak of ether (-0 83v ) c , Oxygen wave (- 0 39v )
Gate-number (region)
t h e second peak showed a small change with the gate-number.
Therefore, t h e second peak had a nature different froin a typical tensammetric wave. Moreover, an attempt was made to apply t h e gate-number on the analysis of tensammetric po1a:ogram of ani ill in.''^) The use of the gate-number would be useful methed for the examination of tensammetric waves.
Summary
Diethylether showed no reduction wave but showed the sha;p tensammetric wave due to its dipole in s.q. polarography. The tensammetric behaviors of ether were investigated a s follows:
Whatever Na2S04, KCI, NHdCI, HC1, KNOs, NaClO4 and were used a s supporting clectrolytc, the very sharp tensammetric wave was obtained and the height of the first pcak decreased in the order of the above mentioned materials. The curve of the first peak- height concentration showed the shape of LANGMUIR'S isotherm adsorption, and so ether would be adsorbed on the mercury electrode ssrface in the state of monolayer.
The height of first peak decreased rapidly with the increase of temperature and almost disappeared a t 40°C, while the second peak-heit, being small even at a low temperature, did not vary with temperature. T h e potential region in which ether was adsorbed on the mercury electrode would be not so varied with temperature.
T h e peak-height of ether decreased sharply with the increase of alcohol content and the peak disappeared when the content reached to 30%. From the measurments of potential region of adsorption and electrocapillary curves it seemed to be considered that the adsor - ption of ether on the mezcury electrode was not removed completely by alcohol and occu- rred weakly a t the potential region in which alcohol was adsorbed.
The change in peak-height caused by the change of gate-number showed t h a t the first peak was caused by non-faradaic current, while the second one was not merely composed of non -far adaic current
.
References
(1) PROSI~URNIN, M , FRUMKIN, A : Trans. Faraday Soc., 31, 110 (1935) (2) BREYER, B , HACONIAN, S. : Australtan T . Sci Pes , A5, 500 (1952)
Vol.. 21 (No, 48) (1970) 185 (3) Doss, K. S . G., KALYANASUNDARAM, A : Proc Indzan Acad. Scz., 35A, 27(1952).
(4) BREYER, B., NAUER, H. H. : Alternatzng Current Polarography and Tensammetry, Interscience, New York (1963).
(5) MARUYAMA, M , OKABE, Y. Nippon Kagaku Zassz
,
68. 435,876,1080(1967).(6) GUPIA, S L
.
Ziollozd -Z., 132, 21 (1953), GUPIA, S . L., AGARWAL, S. K D : Kollozd-Z.,163,136 (1959)
(7) KIMMEIE, F M , BARRADAS, R G. : Anal. Chem., 37, 1762 (1965).
(8) TSUJI, K., : Revtew o f Polaro. (Japan), 11, 233 (1964) (9) SENDA, M., TACHI, I. : Revzew o f Polaro., 10, 79 (1962)
(10) BREYER, B , BAUER, H H. : Australzan J . Chem, 8 , 467,472,480 (1955), (T FUJINAGA, MARUYAMA, Polarography, 1, 113 Nankodo (1962))
(11) JEHRING, H : Z P ~ Y S Chem , 225, 116 (1964)
(12) FUTINAGA, T., SAWAMOIO, Y : Kagaku. 1 9 , 1261 (1965).
(13) GUPTA, S . L., CHAIIERII, M. K, Sharnza, S K. : J Electroanal Chem., 7 , 8 1 (1964). (14) GUPIA, S L., SHARMA, S K., J Indzan Chem. Soc, 41, 668 (1964), (Chem Abstr. 62,7388
(1965)).
(15) FUKUI, Y , KAIAOKA, I. : Proceed. 21 th Cong Japan Chem. Soc. (1968)
~ ~ ~ I I / Z . - ~ I I / & @ ~ B $ - . ~ ~ 77 R @ L \ Z Z 7 c ; b ? & 5 3 k L \ d ~ , %D&'P&Dk&D$&,L\t 4 Y+.L\f 1. ,-&
&%-;.$. c D y Y . ? j - A , % t jl - ~ & D & @ J & % L < & Z 4 L k .
3 g j j g ~ :
Lr ,
NazS04, KCI, NH4C1, KNOs%dc U ; N a C 1 0 4 D ~ + h & 1 j j -C %, $$L\t Y + A , % 1, jl-..&sk
b h , ~ ~ % D % - . C ~ - ~ D & ~ & ~ Z ~ D I I @ @ T ~ & < ? L ~ ~ ,.Z --i;.]l/&$k%-,C k DH%@f&&LANGMUIR D@%%?g#i$!Dfp&%Lk -, L k 5 9 T, .z -F/VM,;k
& , & & D d ~ - . q h j T g K t 2 : @ g f k % j k , b h & ,,
~ E B D ~ W . K Q ; ~ - C , ~ - ~ ~ , - 9 s g 3 ~ % f i ~ u c 1 ~ t
<
<
9 , 4 0 ° c r ~ ~ k ~ r # & L k ,L ~ L L ,
% Z ~ - ~ M . I P ; B K @ L \ - C % ~ E S ; < ,
j i r ~ B 3 a ' B E k % R d : - ; , r @ b k a ~ , k . 5k~=-F/v~@%&f-&*Z &,@bJMM.&E4xh dc -> T$ B k L \ ..71v3-1v&$&finf
a
k , % - ~ c - ~ 9 D z % S M L ~ % C . a L < I & < & 9 , 7 1 1 . = 1 - ~ ~ ~ 3 0 % % h n e % . i Q K ~ & t k . . . z.-
y / ~ ~ @ ~ ~ ~ ~ g . e z ~ % g & $ i $ ! a ~ g a % ~ ; i ,
b, 7 / v ~ . - / v j s i % A n s i h e6,
. z . - ~ / v ~ % & - c n ~ s a ~ + ~ & j j l p & 3 i h k ~ , ~ , ~ ~ ~ ~ ~ - J ~ D R ~ Z ~ ~ % ~ T , 5 5 ~ , @ 2 & % z . L f b \ & L : % k b h a .3 h R , F ' / - f t . ~ f 1.
9
-Djio&Z$K,gate-number%$kT,%ihhR A 6 . & & @ 4 k % f l i @ . - t a ~ & & & L & Z ~ - k k .+
L
<,
z-
5 / v ~ % - . f . - . 9 M.non-faradaic@.&K&W L ,z1.f
-9
M@$iljknon-faradaic %'aEV T < b \ Z. L: &%&k. ( ~ & ~ k % % % Q 4 r n k b ( M $ I I ~ ~ % I o R I ~ H ) K T % % L ~ ) (Received December 23,1969)