Anomalous photovoltaic effect
in-conjugated ferroelectric liquid crystals
Atsushi Seki
September, 2017
1
Anomalous photovoltaic effect
in-conjugated ferroelectric liquid crystals
Atsushi Seki
September, 2017
Department of Advanced Material Sciences
School of Engineering
Kagawa University
2
The study described in this thesis was carried out
under the supervision of Professor Masahiro Funahashi
at Kagawa University from October, 2014 to September, 2017.
3
Table of contents
Chapter 1. General introduction 6
1.1. Philosophy of this thesis 6
1.2. Ferroelectric materials 8
1.3. Liquid crystals 28
1.4. Liquid-crystalline semiconductors 47
1.5. Ferroelectric liquid crystals 65
1.6. Multi-functional materials 72
1.7. Photovoltaic effect 72
1.8. Objective of this thesis 74
1.9. Outline of this thesis 76
1.10. References 77
Chapter 2. Bulk photovoltaic effects in ferroelectric liquid crystals based on
phenylterthiophene derivatives 95
2.1. Introduction 95
2.2. Experimental section 96
2.3. Results and discussion 104
2.4. Conclusion 110
2.5. References 111
Chapter 3. Bulk photovoltaic effects based on molecular chirality:
the influence of the enantiomer purity on the photocurrent response in
-conjugated ferroelectric liquid crystals 112
3.1. Introduction 112
3.2. Experimental section 115
3.3. Results and discussion 121
3.4. Conclusion 134
4
Chapter 4. Anomalous Photovoltaic Effect in Chiral Ordered Smectic Phases of
Phenylterthiophene Derivatives without Junctions: Immobilization of the
Polarized Structure by Surface Stabilization 138
4.1. Introduction 138
4.2. Experimental section 140
4.3. Results and discussion 142
4.4. Conclusion 152
4.5. References 152
Chapter 5. Conclusion of this thesis 153
5.1. Overall conclusion 153
5.2. Perspective 153
Accomplishments 156
5
6
Chapter 1
General introduction
1.1. Philosophy of this thesis
The term of “material” indicates “an element constituting a tissue expressing various functions”. Since ancient times, human beings have produced various “tools” and “equipment” to make their lives rich and comfortable. The primitive tools and dwelling were made of “stones”, “woods”, “plant fibers” and “soils”, which is derived from natural products. Along with the development of civilization and the progress of technology, human beings have come to process and manufacture “bronze”, “copper” and “iron”. These ancient metals and alloys are regarded as the first artificial materials. These inorganic materials can be obtained by simple smelting technique that metal ores are ignited with fagots and charcoals. Chemical reactions in these processes can be explained by “reduction reaction” of metal ores. Following the melting of metal ores under the ignition condition, nonmetallic elements such as oxygen, sulfur and hydrogen in the ores can be burned with natural fuel and removed out as oxidized gasses from the molten system. While the manufacturing technology by using the minerals, and processing technology of natural inorganic/organic matters had been developed from ancient, the establishment of organic synthetic materials technology was delayed to modern ages. In fact, the "medieval castle" in Japan consists of various facilities such as "moat", "stone wall", "tower", "hall" and the materials forming them are "earth", "timber", " "metal fittings" and so on. Facilities constructed with various materials are appropriately arranged and organized so that the castle can demonstrate its role to the utmost. Here, looking at the material, "earth" is a chemical mixture composed of coarse-grained minerals, colloidal mixtures, and organism-derived organic substances in various compositions. "Stones" are mixtures of inorganic minerals containing silicate as a main component and various minerals. On the other hand, "timbers" are based on organic polymer composed of polysaccharide such as cellulose and hemicellulose and lignin. All of these organic components are synthesized not by artificial but biochemical reactions. In this way, no organic synthetic materials had been used before “urea” was developed in 19th century.1
Even in present time, many natural materials are used for various “tools” and “equipment” because they are easy to obtain and also apply the conventional methods. However, natural materials such as “stones”, “timbers” and “plant fibers” have serious concerns in that they are not composed of a single and the same chemical species. In addition, they also have big difference in compositions, chemical and physical structures, and physical properties depending on the species, biological environments and production processes. The precise control of chemical compositions and organized structures in natural materials are impracticable in present because the precise conditions such as the formation processes and mechanisms of a lot of natural products are never completely
7
clarified and understood. Thus, production location, environments and collected portions of natural materials are critical issues in practical use. In contrast, the chemical species and whole compositions of artificial synthetic materials are obvious. Furthermore, the control of well-organized structure and chemical modification are also possible. Thus, various material systems can be designed and developed.
Depending on the function of interest, you can classify the materials in different ways. Based on the chemical elements constituting them, it can be classified into organic materials, inorganic materials and organic-inorganic composite materials.
Since each of these materials is diverse, its physical properties such as density, light and heat absorption characteristics, softening temperature, and other chemical properties (weather resistance including thermal stability and light stability) are different. Therefore, an appropriate material is selected based on the characteristic which is indispensable in the application.
My main scientific interests cover organic materials. This is because organic compounds can be designed in a wide variety of chemical structures and can be arranged in various ways by applying the reaction technique of organic synthetic chemistry.2 From this point of view, the combination of several components with possibilities of inducing different features can lead to the construction of functional molecules.3 Especially, low molecular weight organic compounds with stereo-regularity can be synthesized and isolated by common organic synthetic technique in contrast to conventional polymers obtained by radical reactions. Therefore, the structural control of self-assemblies based on single component system as well as the mixtures system with precise compositions can be achieved.
Through my study described in this thesis, it will be considered about the development of multi-functional materials centering on thermotropic LC materials as one of the significant self-assembled systems.4 As a model case, the material systems with “carrier transport” and “ferroelectric” properties will be discussed.
What I would like to described in this Ph.D. thesis is "the importance of understanding the various inter- and intra-molecular interactions", "the possibility of controlling a self-assembled structures by an application of those weak interactions in the appropriate balance for the required functions", "the realization of hierarchical and utilized functions along the nano-structurization strategy" and "the development of novel organic-based multifunctional material system by using the conventional technique of organic synthetic chemistry".
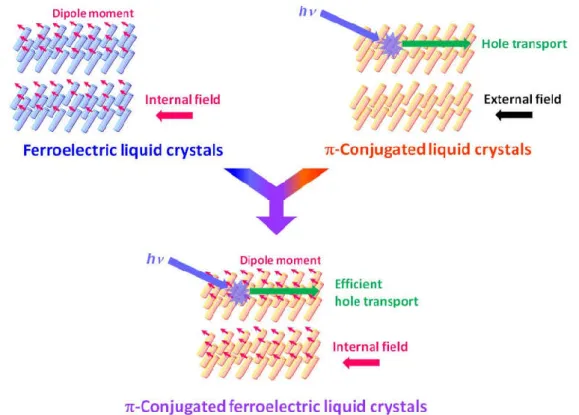
I believe that our -conjugated ferroelectric liquid-crystalline systems are important trajectory on materials science as well as liquid-crystalline science, due to the novel concept which is experimentally demonstrated the efficient carrier generation and transport assisted by ferroelectric internal field in the bulk (Figure 1-1).
8
Figure 1-1. Schematic illustrations of -conjugated ferroelectric liquid-crystalline system as an example of multi-functional materials.
1.2. Ferroelectric materials
51.2.1. Basic concept of ferroelectrics
The existence of spontaneous electric dipoles and their thermal dependence has been known since ancient times. In the 18th and 19th centuries, the quantitative characterization studies on this phenomenon were carried out. These studies have greatly led to the establishment of the perception that the physical effect based on thermal change of electric dipole moment is a "pyroelectric" effect.6 Furthermore, the phenomenon that electrical polarity is generated under the application of external stress, which is known as “piezoelectric” behaviors, was discovered by J. Curie and P. Curie in 1880 as a result of systematic study on “pyroelectricity”.7 The Curie brothers also revealed that charge development upon uniform thermal treatment are different from that upon non-uniform heating due to the thermal stress originated from the “pyroelectricity”. From the above description, the "pyroelectric" and “piezoelectric” materials are defined as matter in which the magnitude of the electric dipole moment can be changed by thermal and pressure stimuli, respectively. It is noted that “pyroelectric” materials are subset in “piezoelectric” materials.8
The term of “ferroelectricity” indicates a property posessing a sponataneous polarization which can be reversed by the external electric field.5, 9 This term got to use in the analogy to "ferromagneticity" which exhibiting a permanent magnetic moment because the “ferromagnetic” phenomenon had been recognized in scientific society before the discovery of "ferroelectricity". The
9
essential condition for the expression of "ferroelectricity" is a structure that allows uniaxial orientation of permanent dipole moments in the molecular aggregation state as well as dynamic behavior which can reverse a direction of the dipole moment. All “ferroelectric” materials also work as “pyroelectric” and “piezoelectric” materials (Figure 1-2).
Figure 1-2. Schematic illustrations of ferroelectric system.
In the ferroelectric systems, the polarization state is induced by an electrical poling treatment and the generated polarization state is retained even after removing the external bias. In practical, the ferroelectric polarization and charge accumulation behaviors are important properties as a function which can be applied to sensors, memory and integrated devices.
The hysteresis behaviors are observed in plots of polarization (polarization charge density) as a function of the external voltage (electric field) (Figure 1-3). The ferroelectric hysteresis loop can be experimentally obtained by Sawyer-Tower method. On each region of the loop displayed in Figure 1-3, the dipole distribution inside the aggregation structures is schematically explained as follows. Position (a) is the initial state, in which polarization is still not generated. At position (b) under the positive bias external field (+E1), the electric dipoles can be aligned to compensate for the external
stimulus. As a result, the polarization state (internal electric field) is generated in the bulk. The situation after the bias is returned to zero from state (b) corresponds to position (c), where the polarization state with the value of +Pr is maintained even under zero bias. At position (d) under the
negative field (+E1), the electric dipoles should be aligned in reversed direction to the case of position
(b). At position (e), which corresponds to the state after removed the negative bias, the opposite polarization state with the value of -Pr is induced. On the basis of such behaviors, various devices
based on ferroelectrics such as ferroelectric random access memory (FeRAM) can demonstrate their functions. For instance, the FeRAM system is incorporated in a circuit using a large number of electrodes, records binary information as local polarization, and reads and writes by using an electrical signal (voltage, current). Physical values such as coercive electric field, residual polarization, and spontaneous polarization can be estimated from the hysteresis loop. The coercive electric field
10
(+Ec, -Ec), which is the electric field when the polarization becomes zero, corresponds to the
intersection point of E axis and polarization plot. The intersection and extrapolation points of polarization plot and P axis indicate the remanent polarization (+Pr, -Pr) and the spontaneous
polarization (+Ps, -Ps), respectively.
(a) (b)
Figure 1-3. Schematic illustrations of (a) application profiles on external electric field, and (b) typical ferroelectric hysteresis loop.
Some analogous substances of ferroelectric materials exhibit double dielectric hysteresis behaviors (Figure 1-4). This phenomenon is defined as “anti-ferroelectricity”. In the anti-ferroelectric system, no spontaneous polarization is generated on zero bias. Under the application of electric field above a certain threshold value, the ferroelectric-like dielectric behaviors are observed and two hysteresis loops according to the positive and negative electric field are induced.
Figure 1-4. The typical anti-ferroelectric double hysteresis loop.
As an extremely rare phenomenon, "ferrielectricity" which displays triple dielectric hysteresis behaviors is also found. In the ferrielectric system, three ferroelectric-like loops are obsereved in low
11
electric field range as well as high electric field ranges in positive and negative regions (Figure 1-5). Under the application of electric field above a certain threshold value, the ferroelectric-like behaviors are observed and two hysteresis loops are induced in the positive and negative field regions.
Figure 1-5. The typical ferrielectric triple hysteresis loop.
Temperature-dependence of dielectric constant in ferroelectrics is explained by the Ferroelectric Curie-Weiss law. The Curie-Weiss law expresses the relation between the absolute temperature (T) and the relative dielectric constant of ferroelectrics (r) with using specific coefficient (C) and
temperature (TC) (Equation 1-1).
=
[Equation 1-1]The threshold temperature Tc is called as “Curie temperature”, at which the denominator of
equation 1-1 is zero and relative dielectric constant diverges. The Curie temperature indicates the phase transition point from ferroelectric phase to another non-ferroelectric (paraelectric) phase. In the simplest ferroelectric system exhibiting only a ferroelectric-paraelectric transition, the ferroelectric phase lies in low-temperature side to the paraelectric phase in which no spontaneous polarization is generated. In this ferroelectric system, ferroelectric behaviors can be observed below the Curie temperature. However, the ferroelectricity drastically dissappered above the Curie temperature (after the phase transition).
The typical plot of relative dielectric constant as a function of absolute temperature (T) is as shown in Figure1-6. For the ferroelectric-paraelectric phase transition, the temperature-dependences of the relative permittivity, electrosensitivity, and polarization are different between the first and second order phase transitions. In the case of the first order ferroelectric-paraelectric transition, relative dielectric constant discontinuously jumps up at the Curie temperature (Figure 1-6a). The
12
relative dielectric constant is maximized on the Curie point and decayed in higher temperature above it. In case of the second order ferroelectric-paraelectric transition, relative dielectric constant is diverged at the Curie temperature (Figure 1-6b).
(a) (b)
Figure 1-6. The typical plots of relative dielectric constant as a function of the temperature in cases of (a) the first order ferroelectric-paraelectric transition, and (b) second order ferroelectric-paraelectric transition.
Here, the reciprocal of relative dielectric constant are focused on. In general, the inverse for relative dielectric constant ( r-1) is converted into the form with reciprocal of electrosensitivity ( -1).
The correlation between dielectric polarization vector (P) and external electric field vector (E) is expressed as Equation 1-2 with coefficient of electrosensitivity () and permittivity of vacuum ( 0).
=
( > 0)
[Equation 1-2]In the basic physics of dielectrics system, the correlation between vector of electric flux density (D) and external electric field vector is defined as Equation 1-3.
=
+
=
[Equation 1-3]From Equations 1-2 and 1-3, relative dielectric constant can be described as Equation 1-4 with using the coefficient of electrosensitivity.
= 1 + ( > 0)
[Equation 1-4]Therefore, the inverse for relative dielectric constant can be expressed with the reciprocal of electrosensitivity as Equation 1-5.
13
= (1 + ) (1 +
> 1)
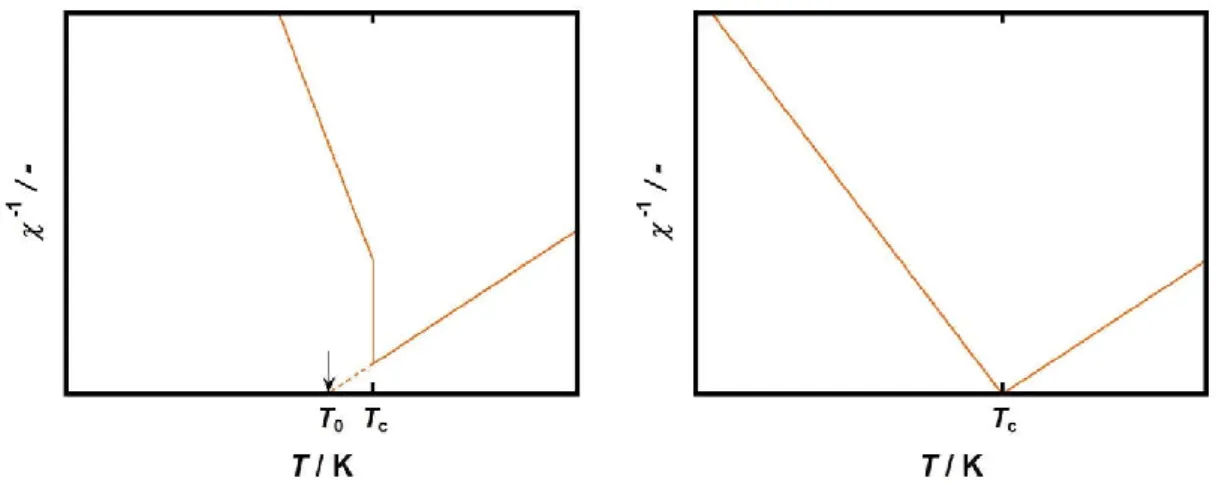
[Equation 1-5]The typical plot of reciprocal of electrosensitivity as a function of temperature is as shown in Figure 1-7. In the ferroelectric system based on the first order phase transition at the Curie temperature, the drastic and discontinuous change is observed at the Curie temperature (Figure 1-7a). In this case, the reciprocal of electrosensitivity is linearly changed in ferroelectric and paraelectric phases. The intersection point of plots does not coincide with the Curie point. Extrapolation point on the temperature axis (T0) of the plot contributing to the paraelectric phase
indicates the temperature where the free energy of the system becomes apparently zero. In contrast, the reciprocal of electrosensitivity continuously changes in the ferroelectrics exhibiting the second order phase transition at the Curie temperature (Figure 1-7b).
Figure 1-7. Temperature dependence of reciprocal of electrosensitivity (a) in the first-order transition system, and (b) in the second-order transition system.
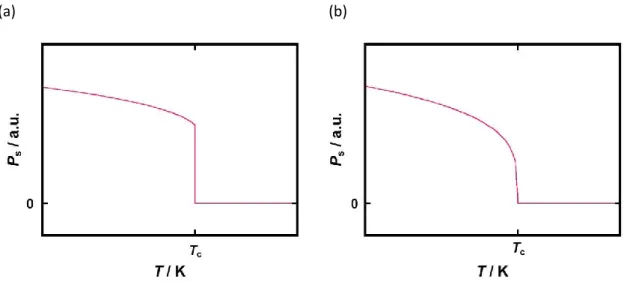
There is the same difference in the temperature-dependence of spontaneous polarization between the first-order transition system and the second-order transition system (Figure 1-8).
In the first-order transition system, the spontaneous polarization discontinuously and abruptly drops on the Curie temperature (Figure 1-8a). In contrast, continuous and gentle attenuation behavior on spontaneous polarization is observed in the second-order transition system (Figure 1-8b).
14
(a) (b)
Figure 1-8. Temperature dependence of spontaneous polarization (a) in the first-order transition system, and (b) in the second-order transition system.
The above discussion on dielectric constant is in static condition. It is noted that their dielectric properties depends on frequency of the external AC bias due to the origin of the polarization. Dielectric dispersion phenomenon is observed in common with all these polarizations. The electric dipole moment is generated by “orientation polarization”, “ion polarization” and “electronic polarization”.
“Orientation polarization” can be produced in polar molecular system with permanent dipole moment. To be brief, this phenomenon is caused by the uniaxial orientation of permanent dipole moment under the application of external bias. In polar molecular system, local polarization (in molecular scale) is formed in the initial stage without external electric field, because the electronic density in a molecule is biased by contribution of electronegativity. Although “ion polarization” and “electronic polarization” are considered as the result of “induced dipole” by the external stimulus, therefore, “orientation polarization” is different from those polarizations. The contribution of external electric field is only the induction of the dipole reorientation behavior to compensate for the external stimulus. In the initial state (without external bias), the direction of local dipole moments is random and thus the sum total of local polarization results in zero. Under the application of the appropriate electric field, the sum total of local polarization has some values by the uniaxial orientation of dipoles.
“Ion polarization” can be induced by displacements of cations and anions in the ionic complex when the external electric field is applied. The dispacement behavior of ions depends on the electric field intensity.
“Electronic polarization” can be induced by deformation of the molecular (atomic) orbitals as well as displacement of nuclei.
15
It should be noted that the actual polarization phenomenon is caused by cooperation of these three polarizations. Therefore, the polarization of the whole system is physically treated as the sum of the contributions of all these polarizations.
Here, the situation that the external electric field is applied to any dielectric material will be considered. The correlation between dipole moment (m) of the material and external bias electric field (E) is expressed by the following equation (Equation 1-6) with polarizability factor ().
=
[Equation 1-6]Polarizability factor of ion polarization ( i) and that of electronic polarization ( e) are defined in
Equation 1-7, 1-8 as analogy of Equation 1-6, respectively. The factors indicated by mi and me are
where the moments corresponding to the ionic dipole and electronic dipole, respectively.
=
[Equation 1-7]
=
[Equation 1-8]By using a factor of permanent dipole moment (mp), polarizability factor of orientation
polarization (p) are described as Equation 1-9 based on classical statistical mechanics.
=
[Equation 1-9]In particular to the polar molecular system, therefore, the overall polarizability factor () can be expressed as Equation 1-10.
=
+
+
[Equation 1-10]The dynamics of molecules, atoms and electrons is contributed to frequency dependence of polarizability factor and dielectric constant. In the case of considering the frequency dependence of “induced polarization”, it can be roughly explained by a harmonic oscillator model.
The phenomenon that dielectric constant depends on the frequency of external bias is considered as “dielectric dispersion”. The AC external electric field as a function of time (t) can be defined as Equation 1-11 with using imaginary unit (i) and angular frequency ().
=
exp(
) ( = √−1)
[Equation 1-11]The frequency dependence of electric flux density is defined as Equation1-12 by considering the phase shift ().
16
Following Equation 1-3 which describes the static condition, the linear combination between Equation 1-11 and Equation 1-12 is formally defined as Equation 1-13 with using complex dielectric constant ( r*).
=
∗ [Equation 1-13]The definition equation of complex dielectric constant is Equation 1-14.
∗
=
−
=
cos −
sin
[Equation 1-14]In physical, ’’ and tan indicate energy loss when AC electric field is applied to the dielectric. The dielectric is generally considered as an equivalent circuit composed of electrostatic capacity (Cp)
and the resistance (Rp). The relation between these factors can be expressed by Equation 1-15.
= tan =
[Equation 1-15]Dielectric dispersion is explained by two types of mechanism. In the case of orientation polarization, relaxation-type dispersion is observed. In this relaxation-type dispersion, dielectric loss causes due to the delay of the dipole rotation dynamics to the external electric field. On the other hand, resonance-type dispersion is observed for induced (ionic and electronic) polarization. The resonance-type dispersion is considered as elastic vibration system with decay.
To explain the relaxation-type dispersion, the simple one dimensional system which possesses thermodynamic energy potential curve in solid state as shown in Figure 1-9 will be considered. As an assumption, the following conditions shall be applicable to this thermodynamic model. The orientation vector of permanent dipole moment will be parallel or anti-parallel to the horizontal axis in this simplified system. The thermodynamic energy potential barrier (Ua) will be located between
two energy potential minimums and the permanent dipole will be vibrating with thermal frequency (0/2).
17
In this model, the Debye dispersion formula described as following equations (Equation 1-15, 1-16) is derived by the Debye theory on dielectric dispersion with using the relaxation time ().
( ) − (∞) =
( ) ( ) [Equation 1-15]( ) =
{ ( ) ( )} [Equation 1-16]These two equations describe the correlation between the complex dielectric constant and the relaxation time. The plot for these equations as functions of is as shown in Figure 1-10. The real part ’ is stepwise decreased along with the increase of external electric field frequency. This change behavior briefly shows that the dipole inversion cannot follow the speed of electric field change gradually. In the small ()-1 region, the dipole inversion can follow the electric field change. In contrast, however, the dipole cannot reverse the direction in the region of large enough ()-1. The imaginary part ’’ is maximized in the point where is = -1. This model describes the system which has only single relaxation time. It is noted that there is a distribution in relaxation time in the actual system.
Figure 1-10. Theoretical plots for Debye dispersion formula.
The resonance-type dispersion is considered as the system composed of multicomponent oscillators. In this case, real part ’ and imaginary part ’’ can be expressed as following with using damping coefficient () (Equation 1-17, 1-18).
( ) = (∞) +
{ ( ) ( )} ( )( ) [Equation 1-17]
( ) =
{ ( ) ( )}
18
The plot for real and imaginary parts of complex dielectric constant as functions of the frequency is as shown in Figure 1-11. The real part ’ gets zero on the point where is = 0. On the other
hand, the imaginary part ’’ is maximized on the point where is = 0.
Figure 1-11 Theoretical plots of complex dielectric constant as functions of the frequency for resonance-type dispersion.
The plot for frequency dependence of complex dielectric constant under the contribution of orientation polarization and induced polarization is shown in Figure 1-12.It should be noted that the characteristic frequencies of corresponding dielectric dispersion behaviors are different maginitude and depends on the type of polarization.
19
1.2.2. Brief history of ferroelectrics
10Ferroelectricity was first discovered by study on “Rochelle salt” reported by J. Valasek in 1920.11 He investigated the dielectric properties of “Rochelle salt” from 1919 under the supervision of Professor W. F. G. Swann. Then, he observed the uncommon dielectric hysteresis behaviors, that is ferroelectric hiterersis, in “Rochelle salt”. Furthermore, his deep and systematic study revealed the temperature dependence of piezoelectric activity and phase transition behaviors in “Rochelle salt”. Valasek's study was undoubtedly inscribed as a vital milestone in the history of ferroelectricity and ferroelectric materials. Following the first experimental study of the ferroelectric salts, P. Scherrer and G. Bush clarified the ferroelectricity of KH2PO4 which exhibits high average dielectric constant.
Through their study, KH2PO4 shows low critical temperature about 123 K.12 Up to the present, KH2PO4
has been a model and substance in the ferroelectric science.
A little late from the study of ferroelectric salts, ferroelectric ceramics system was found in 1940’s by some independent groups in United States and Russia.13, 14 After that, the spread and development of ferroelectric ceramics led to the construction of doped ferroelectric ceramics systems such as Pb(Zr,Ti)O3 (PZT)15 and (Ba,Sr)TiO3 (BST).16 As the industrial applications, some
inorganic ferroelectric materials have been used for ceramics capacitors and ferroelectric random access memory (FeRAM) etc. in the present.10
The interests of ferroelectric study after 1950’s can be roughly classified as two trends. One trend is perovskite-based ferroelectrics and another one is organic ferroelectric materials. In the organic system, the ferroelectric behaviors of thiourea were discovered in 1959.17 Ferroelectric liquid crystals, which is described in detail on the latter section 1.5., have been developed in 1975.18 After a while, R. G. Kepler and coworker reported the ferroelectric behavior in poly(vinylidenefluoride) (PVDF) as the first example of ferroelectric polymers.19a Almost at the same time, T. Furukawa and coworkers deeply investigated the ferroelectricity in PVDF19b and copolymer of vinylidenefluoride and trifluoroethylene (P(VDF-TrFE)). 19c Compared with ferroelectric ceramics, the reports on ferroelectric polymers are not so much, but nylon (polyamide)-based polymers as well as PVDF-based polymer systems also exhibit ferroelectric properties.20 Focusing on the influence of hydrogen bonds to ferroelectric nature, Y. Tokura and coworkers developed the ferroelectrics based on supramolecular complex and have investigated the issues systematically.21
1.2.3. Classification of ferroelectrics
Ferroelectric materials are roughly classified into “displacement-type” and “order–disorder-type” depending on the difference in generation mechanism of spontaneous polarization. The well-known inorganic ferroelectric ceramics such as BaTiO3 and PZT is typical “displacement-type” materials. In
20
1.2.3.1. Conventional displacement-type ferroelectrics
Most of the inorganic ferroelectric ceramics are belonging to this type. In this system, the symmetry breaking originated from distorted structures by the displacement of heavy metal and non-metalic elements results in the ferroelectric nature. In general, this displacement-type ferroelectrics exhibit the first-order ferroelectric-paraelectric phase transition behavior.Therefore, relative permittivity, electrosensitivity and spontaneous polarization are discontinuously changed on the Curie temperature. Most of ferroelectric ceramics have perovskite or similar structures in their crystalline states. The displacement behavior in the ferroelectric crystalline phase has anisotropy. The direction of spontaneous polarization is parallel to the displacement axis corresponding to crystal structures of the ferroelectric phase.Considering the crystal structure of the ferroelectric phase, the required crystal systems for exhibiting the ferroelectricity is allowed to generate the spontaneous polarization and to be stable states.
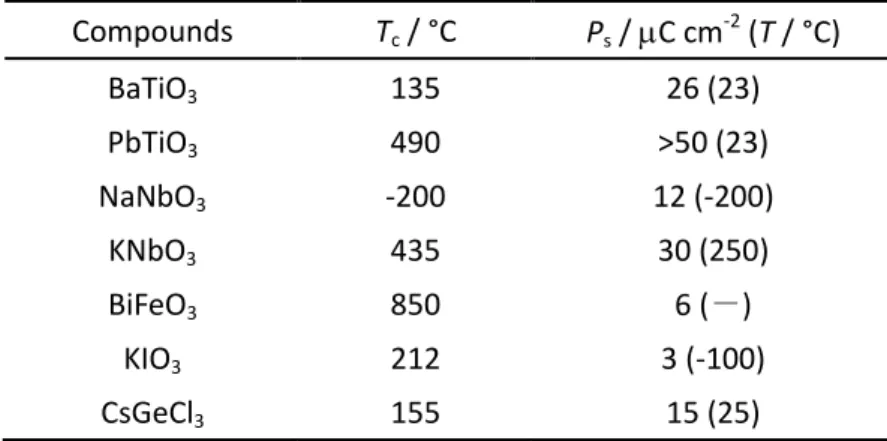
Typical ferroelectric perovskites are BaTiO3, PbTiO3, KNbO3 and BiFeO3. The representative
ferroelectric parameters for these ferroelectrics are summarized in Table 1-1.
Table 1-1 Ferroelectric parameters for typical ferroelectric ternary transition metal oxides.5, 23
Perovskite-type compounds are ternary transition metal oxides represented by the general chemical formula AMO3 composed of the central transition metal species M, the dissimilar metal
species A and oxygen atoms. The typical crystal structure is as shown in figure 1-13. Compounds Tc / °C Ps / C cm-2 (T / °C) BaTiO3 PbTiO3 NaNbO3 KNbO3 BiFeO3 KIO3 CsGeCl3 135 490 -200 435 850 212 155 26 (23) >50 (23) 12 (-200) 30 (250) 6 (-) 3 (-100) 15 (25)
21
Figure 1-13 A schematic illustlation of typical crystal structure for perovskite-type metal oxides.
After the discovery of ferroelectricity in BaTiO3, analogous multi-element transition metal oxides
extensively were developed and investigated their polarization behaviors. The deep studies revealed that not all of the perovskite-type metal oxides exhibit ferroelectricity. Furthermore, paraelectric perovskites such as KTaO3 and SrTiO3 or antiferroelectric perovskites such as PbZrO3 are found
through those investigations. Since the design of ferroelectric perovskites is not limited only to the ternary system, multicomponent ferroelectrics can be also designed and synthesized in which A or M sites are partially substituted by different metal species. Up to now, a lot of partially-substituted ferroelectrics comprised of various metal elements with different compositions have been developed. PZT is the most typical this type of materials. Their ferroelectric parameters depend on the Zr substitution ratio of Ti sites. Typical ferroelectric parameters for partially-substituted ferroelectrics are summarized in Table 1-2.
Table 1-2 Ferroelectric parameters for partially-substituted perovskite-type ferroelectrics.5, 23, 24
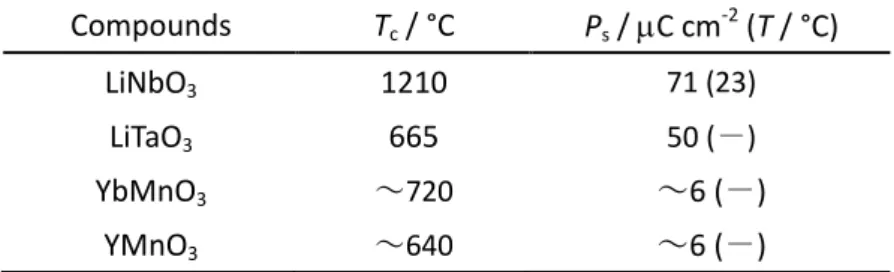
Some ternary transition metal oxides with similar structures to perovskite such as LiNbO3 and
LiTaO3 also exhibit ferroelectricity. Their physical properties are listed up in Table 1-3.
Compounds Tc / °C Ps / C cm-2 (T / °C) (K0.5Bi0.5)TiO3 (Na0.5Bi0.5)TiO3 Pb(Sc0.5Nb0.5)O3 Pb(Zn0.33Nb0.67)O3 Pb(Cd0.33Nb0.67)O3 Pb(Zr0.52Ti0.48)O3 Pb(Zr0.25Ti0.75)O3 270 200 90 140 270 386 ~450 - 8 (116) 4 (18) 24 (25) 0.65 (25) ~30 (r.t.) >3 (-)
22
Table 1-3 Ferroelectric parameters for metal oxides with similar structures to perovskite.5, 23
The exhibition of ferroelectricity depends on a stability of the polarized structure. The polar vector (the vector of spontaneous polarization) is discussed from the symmetry of the crystal structure. Ferroelectric phenomenon is one of the results from symmetry breaking. In the case of cubic crystal structures where every lattice constants are equivalent, ferroelectricity can not developed. In the other six crystal structure systems except for cubic structures out of the seven crystal systems, some structures permit the existence of polarization vector. Considering the crystal point group, the polar vector can be allowed in ten point groups among all thirty-two point groups. These ten structures are regarded as polar point groups. The characteristics of polar crystal structures are summarized in Table 1-4.
Table 1-4 Classification of polar crystal systems.5b
In some ferroelectrics, sequential ferroelectric-ferroelectric phase transitions are observed. The most typical ferroelectric perovskite BaTiO3 exhibits three phase transitions which come from
Compounds Tc / °C Ps / C cm-2 (T / °C) LiNbO3 LiTaO3 YbMnO3 YMnO3 1210 665 ~720 ~640 71 (23) 50 (-) ~6 (-) ~6 (-)
Crystal systems Crystal classes Point group Polar vector
component Tetragonal Tetragonal Hexagonal Hexagonal Trigonal Trigonal Orthorhombic Monoclinic Monoclinic Triclinic Ditetragonal pyramidal Tetragonal pyramidal Dihexagonal pyramidal Hexagonal pyramidal
Ditrigonal pyramidal rhombohedral hemimorphic Pyramidal rhombohedral tetragonal
Pyramidal Domatic Sphenoidal Pinacoidal C4v (4mm) C4 (4) C6v (6mm) C6 (6) C3v (3m) C3 (3) C2v (mm2) CS (m) C2 (2) C1 (1 ― ) (0, 0, z) (0, 0, z) (0, 0, z) (0, 0, z) (0, 0, z) (0, 0, z) (0, 0, z) (x, 0, z) (0, y, 0) (x, y, z)
23
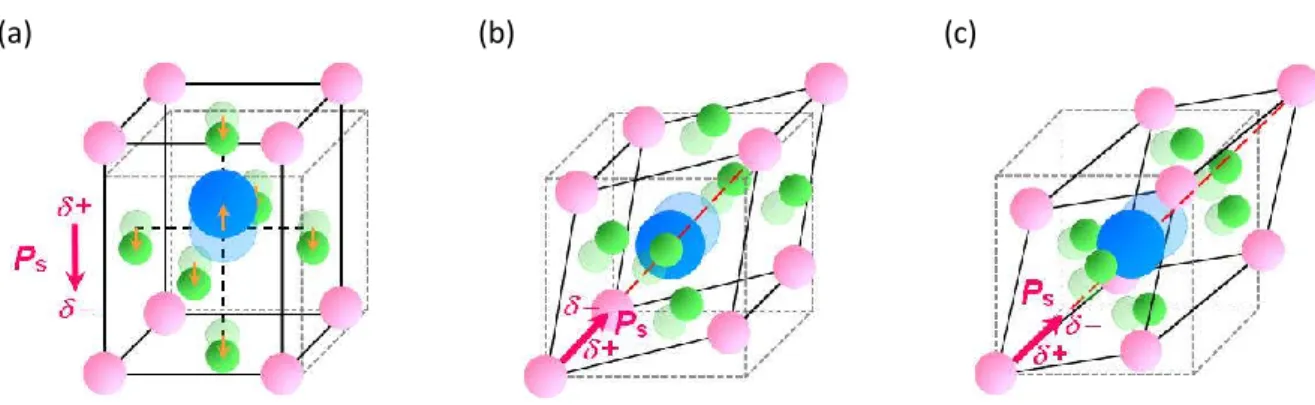
paraelectric cubic – ferroelectric tetragonal, ferroelectric tetragonal – ferroelectric orthorhombic and ferroelectric orthorhombic – ferroelectric trigonal transitions. All these transitions are first-order type. All these ferroelectric crystal structure and direction of sponataneous polarization are shown in Figure 1-14.
(a) (b) (c)
Figure 1-14 Schematic illustlations of crystal stuructures and polarization direction for BaTiO3 in
(a) ferroelectric tetragonal, (b) ferroelectric orthorhombic, and (c) ferroelectric trigonal phases.
1.2.3.2. Conventional order-disorder-type ferroelectrics
Most of organic ferroelectrics and ferroelectric salts are included to the “order-disorder-type” ferroelectrics. In this type of ferroelectrics, uniaxial arrangement of dipole moments instead of displacement generates spontaneous polarization. The order-disorder-type ferroelectrics generally exhibit the second-order ferroelectric-paraelectric phase transition behavior.** Thus, relative permittivity, electrosensitivity and spontaneous polarization are continuously changed on the Curie temperature.
The typical order-disorder-type ferroelectrics are alkali metal nitrites. The Curie temperature and spontaneous polarization for ferroelectric metal nitrites are summarized in Table 1-5.
Table 1-5 Ferroelectric parameters for alkali metal nitrites.5, 23
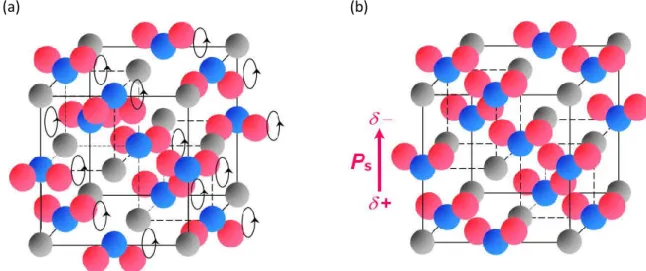
Typical crystal structures of order-disorder-type ferroelectric salts in ordered (ferroelectric) phase and disordered phase are shown in Figure 1-15.
Compounds Tc / °C Ps / C cm-2 (T / °C) NaNO2 KNO2 AgNa(NO2)2 163 47 38 8 (100) 2.8 (25) 1.5 (37)
24
(a) (b)
Figure 1-15 Schematic illustlations of crystal stuructures and polarization direction for order-disoreder-type ferroelectric salts in (a) disordered phase, and (b) ferroelectric ordered phase.
“Rochelle salt” and related tartrate salts are also representative “order-disorder-type” ferroelectrics. The physical properties are summarized in Table 1-6.
Table 1-6 Ferroelectric parameters for tartrate salts.5, 23
“Rochelle salt” has specifically two phase transition points (Tc). In the temperature range from
-18 °C to 24 °C, “Rochelle salt” forms ferroelectric monoclinic sphenoidal C2 (2) crystal structures. The
high-temperature disordered crystalline phase is piezoelectric orthorhombic D2 (222) phase. The
orthorhombic crystal melts at 70-80 °C. The crystalline phase below -18 °C is considered as re-entrant orthorhombic phase. The orientation of hydroxyl groups could be essential to the ferroelectric nature. From the comparison of the ferroelectricities with deuterated substituted salts, it is conceivable that hydrogen bonding contributes to the ferroelectric nature.
Some glicine derivatives belong to order-disorder-type ferroelectrics. The physical properties are summarized in Table 1-7.
Compounds Tc / °C Ps / C cm-2 (T / °C)
Rochelle salt (NaOCOCH(OH)CH(OH)COOK · 4H2O)
NaOCOCH(OH)CH(OH)COONH4 · 4H2O LiOCOCH(OH)CH(OH)COONH4 · H2O LiOCOCH(OH)CH(OH)COOTl · H2O -18, 24 -164 -167 -263 0.25 (5) 0.21 (-181) 0.22 (-178) 0.14 (-272)
25
Table 1-7 Ferroelectric parameters for glycine derivatives.5, 23
Glycine is the simplest amino acid which composing the polypeptide in the living body. Glycine and its derivative can form the hydrogen bonding network in the self-assembled structure. The orientation of polar groups is effective to appearance of ferroelectricy. Hydrogen bonding network can also affect to the ferroelectric properties.
Dihydrogenphosphate and dihydrogenarsenate salts also have the formability of hydrogen bond. The representative ferroelectric dihydrogenphosphate and dihydrogenarsenate salts are listed up in Table 1-8. The transition temperature and spontaneous polarization are also described in the same table.
Table 1-8 Ferroelectric parameters for dihydrogenphosphate and dihydrogenarsenate salts.5, 23
The deuterated substitution of salts affects to their ferroelectricity by the change of hydrogen bonding environment. The transition temperature and spontaneous polarization of ferroelectric deuterated salts are displayed in the Table 1-9. These experimental facts indicate that the hydrogen bonding network affects to the ferroelectric nature. In particular, the phase transition temperature rise about 100 K by deuterium substitution in KH2PO4 system of which three-dimensional hydrogen
bonding network is formed in the crystalline state. Regarding the mechanism of ferroelectricity development in this system, some models (Slater model,25 proton tunneling model,26 over-damped phonon model,27 coupled proton-optic-mode model,28 two coupled oscillators model,29 PO4
order-disorder model,30 coupled proton-internal vibration model,31 asymmetric potential model,32 proton-polaron model33 etc.) have been proposed. However, all models have some drawbacks in Compounds Chemical Formula Tc / °C Ps / C cm-2 (T / °C)
Triglycine sulphate Triglycine selenate Triglycine fluoberyllate
Diglycine nitrate Glycine silver nitrate
(NH2CH2COOH)3· H2SO4 (NH2CH2COOH)3· H2SeO4 (NH2CH2COOH)3· H2BeF4 (NH2CH2COOH)2· HNO3 NH2CH2COOH· AgNO3 49 22 75 -67 -55 2.8 (20) 3.2 (10) 3.2 (20) 1.5 (-190) 0.6 (-170) Compounds Tc / °C Ps / C cm-2 (T / °C) KH2PO4 RbH2PO4 KH2AsO4 -150 -126 -176 4.75 (-177) 5.6 (-183) 5.0 (-195)
26
inconsistensy to experimental facts, such as explanation by proton tunneling model in which KH2PO4
system is treated as displacement-type ferroelectrics. Therefore, the clarification of the mechanism remains still big issues.
It is noteworthy that more pronounced isotope effect called "deuterium displacement induced phase transition" has been found in O-H-O hydrogen bonds (zero-dimensional hydrogen bonding) system, which is isolated from creating hydrogen bonding network.34
Table 1-9 Ferroelectric parameters for deuterated salts.5, 23
1.2.4. Ferroelectric self-assemblies
Ferroelectric property in polymer system was found in 1980 for the first time.19 The ferroelectricity in PVDF and P(VDF-TrFE) is generated from elctric-field-responsive molecular dipoles originated from fluoro groups.35 The ferroelectric behaviour are also found in Nylon system. In the Nylonsystem, the orientation of amide groups is a key to the ferroelectriciy.36 All these ferroelectric polymers are classified into order-disorder-type ferroelectrics.37
FLC materials also are one kind of ferroelectric self-assemblies. The detailed explanation is decribed in later section.
The background study on supramolecular ferroelectrics were carried out by scientific interests on ferroelectric salts forming the hydrogen bonding network.38 The
ferroelericity originated from positional shift (displacement) of hydrogen atoms was found in the crystal of 1,4- diazabicyclo[2,2,2]octane perchlorate (dabco-HClO4) and
1,4-diazabicyclo[2,2,2]octane perrhenate (dabco-HReO4) salts
(Figure 1-16). In these dabco salts, one-dimensional intermolecular hydrogen bonds between the same species (dabco units) are essential to the exhibitance of ferroelectricity.38b, c In these ferroelectric dabco salts, one-dimensional intermolecular hydrogen bonds between the same species (dabco units) are
essential to the ferroelectric nature. Figure 1-16 One-dimensional hydrogen bonding network in ferroelectric dabco salts.
Compounds Tc / °C Ps / C cm-2 (T / °C) NaOCOCD(OD)CD(OD)COOK · 4D2O (ND2CD2COOD)3· D2SO4 (ND2CD2COOD)3· D2BeF4 KD2PO4 -22, 35 60 77 -60 0.35 (6) 3.2 (-60) - 4.83 (-93)
27
From the viewpoint of components for forming intermolecular networks, two types of hydrogen bonds can be considered. One is homo-type intermolecular network, in which hydrogen bonds are formed between the same chemical species. The other is hetero-type intermolecular network, in which hydrogen bonds are formed between diferrent species. The ferroelectric hydrogen-bonded complex salts are based on the later hetero-type intermolecular hydrogen bond networks. S. Horiuchi and coworkers are developed ferroelectric supramolecular two-conpornent crystal based on chloranilic acid and phenazine in 2005.39 Also, the analogous ferroelectric co-crytal system are developed by using bromanilic acid, iodanilic acid, and fluoranilic acid as acidic component with phenazine or 5, 5’-dimethyl-2, 2’-bipyridine as basic component.40 The ferroelectric nature originated from dynamic shuttling of protons is found in the co-crystal of 2,3,5,6-tetra(2-pyridinyl)pyrazine with chloranilic acid and related acids.41
The single component suparamolecular ferroelectric system based on proton transfer was first developed in 2010. The supramolecular assemblies of cloconic acid exhibited tha large spontaneous polarization due to the proton transfer by the enol-ketone tautomerism.42 The ferroelectric behaviors originated from tautomerism inspire the recent ferroelectric investigations.
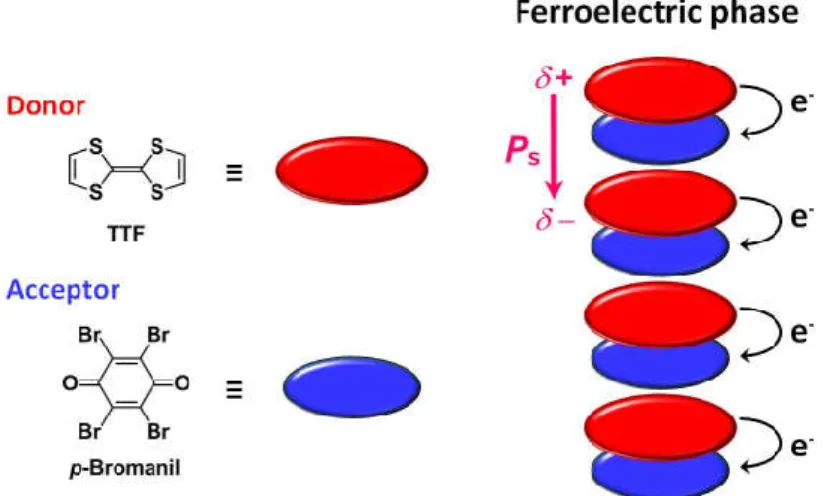
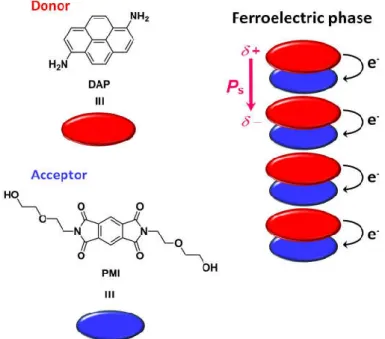
External-stimulus-induced ferroelectric nature in charge-transfer (CT) complexes has been investigated since 1980’s.43 Many study on ferroelectric neutral-ionic phase transition in CT complexes was carried out.38a, 44 However, the leakage current and the difficulty of preparing high quality large-scaled single crystal prevented from obtaining ferroelectric hysteresis loop as clear evidence.45 The ferroelectric hysteresis loops of CT complexes was obtained for the first time by the study on tetrathiafulvalene (TTF)-(p-bromanil) complex in 2010 (Figure 1-17).46 For the related complexes TTF-(p-chloranil) and TTF-(2-bromo-3,5,6-trichloro-p-benzoquinone), clear ferroelectric hysteresis loops were also obtained.47 Some ferroelectric CT complexes such as TTF-pyromellitic diimine derivative (PMI) and 1,6-diaminopyrene (DAP)-PMI were recently developed as inspired by these successful achievements (Figure 1-18).48
Figure 1-17 Schematic illustlations of self-aasembled structure and polarization direction for CT complex TTF-(p-bromanil) in the ferroelectric phase.
28
Figure 1-18 Schematic illustlations of self-aasembled structure and polarization direction for CT complex DAP-PMI in the ferroelectric phase.
Furthermore, ferroelectric supramolecular systems (metal-organic framework and physical xero-gel etc.), which concerted plural intermolecular interactions such as hydrogen bond, CT interaction and coordination interaction are developed.49, 50
1.3. Liquid crystals
511.3.1. Basic concept of liquid crystals
52The term of “Liquid crystal” indicates “a material which forms dynamic ordered structures”. This English term has been widely used as a translation of German word “Flüssige Krystalle” which had named in the early stage of liquid crystal study.53 Liquid-crystalline (LC) phase is a mesophase which lies between crystalline and liquid phases. LC systems generally have molecular orientation order in the mesophase. It should be noted that the molecular aggregation system which has only positional order and not orientation order is “plastic crystal” system. In the most of LC phases, the anisotropic environment is generated due to the LC structures comprised of molecules with a large aspect ratio. The anisotropic LC molecular structures are reflected to the optical, magnetic and electric anisotropies.
The LC properties are generally characterized with using polarizing optical microscopy (POM), powder X-ray diffraction measurement (XRD) and differential scanning calorimetry (DSC).
POM observation is usually carried out under the crossed nicols. The plane of polarization rotates by birefringence, when the polarized light passes through the liquid crystal medium. Since the polarized component of transmitted light which is parallel to the analyzer can pass it, the optical
29
patterns reflecting the LC morecular ordered structure with some defects can be observed. The optical patterns provide some significant information for the assignment of LC phase.
In XRD, diffraction patterns corresponding to the periodicity of the electron density distribution is obtained. Layer, cubic or cylindrical LC structures give some diffraction peaks corresponding the lattice constants in the LC phases. Since dynamic LC ordered structures is more disordered than crystalline structures, the diffraction peaks in the LC phase are usually weakened and broadened.
DSC thermograms provide the thermodynamic parameters such as transition temperature, transition enthalpies and enthalpies. For the LC compounds, plural phase transition peaks are usually observed on the plots.
1.3.1. History of liquid crystals
52Thermotropic LC phase was first discovered by F. Reinitzer who was an Austrian botanist through the study on phase transition behaviors of benzoate derivatives in 1888.54 He observed strange melting behaviors in cholesteryl benzoate on heating process. The stepwise melting behaviors of the cholesterol derivative suggested the apperanace of a mesophase between crystalline (solid) and isotropic liquid phases. The crystalline solid of cholesteryl benzoate changed around 145 °C to the cloudy fluids, which is liquid-crystalline state, and then transited to the clear molten state around 180 °C.53-55 F. Renitzer got interested in the unique cloudy fluids state, and he asked O. Lehman who was a German physicist to scrutinize the properties of the mysterious fluids. O. Lehman clarified by polarizing optical microscopy that the strange fluids show birefringence (optical anisotropy) and named the fluids (fluidy state) as “Flüssige Krystalle” in German.53 As described above, the recorded history of the "thermotropic liquid crystals" began with fundamental research by two scientists in 19th century.
The brief history of liquid crystals is summarized below.
1854: Discovery of myelin sheath based on lyotropic LC system56
1888: Discovery of anomalous phase transition behavior in cholasteryl benzoate54 1904: Publication of “Flüssige Krystalle”53
1911: Publication on optical characteristics of twisted nematic arrangement for LC compounds57 1927: The study on the influence of electric and magnetic fields on LC structures58
1949: Suggestion of Onsager’s hard-rod model59
1959: Establishment of Maier-Saupe theory of liquid crystals60
1963: Development of regular domain patterns in nematic liquid crystals under the application of electric field61
1965: Development of LC polyamide Kevlar® by DuPont Co., Ltd. 62 1968: Development of the first LC display by RCA Laboratory63
30
1968: Discovery of guest-host effect with dichroic dye64
1971: Establishment of drive principles based on "twisted nematic mode" for liquid crystal displays (LCDs)65
1973: Synthesis of 4-pentyl-4’-cyanobiphenyl (5CB) for the application of displays66
1973: Placing on the market of portable calculator equipped with LCD based on dynamic scattering mode
1975: Discovery of ferroelectric liquid crystals18 1977: Discovery of discotic liquid crystals67
1986: Commercialization of color liquid crystal televisions based on TFT-LCD by Matsushita Electric Industrial Co., Ltd.
1994: Commercialization of FLC display by Canon Co., Ltd.
1.3.2. Classification of LC phases
51, 68Liquid crystals are roughly classified into two types by the factor which induces dynamic properties. One is a temperature transition type as "thermotropic liquid crystal system", and the other is a concentration transition type as "lyotropic liquid crystal system". In the thermotropic LC system, the thermal fluctuation of molecules, which disturbs the crystalline packing and weakens the intermolecular interaction, induces the LC phase. Molecular arrangement and molecular orientation (degrees of structural order) depend on the degree of contribution of thermal fluctuation. As the result, various liquid crystal structures are formed. In the lyotropic LC system, the solvation behavior as alternative of thermal fluctuation inhibits the crystalline packing and weakens the intermolecular interaction for appearance of mesomorphism.
1.3.2.1. Lyotropic LC system68a, 69
Lyotropic LC system is usually composed of amphiphilic molecules such as “soap” with solvents. In the lyotropic LC system, LC molecules exhibit mesophase in a certain concentration range. In general, a solution of lyotropic LC molecules shows isotropic phase in low concentration range below the critical concentration. In high concentration region exceeding the critical concentration, the biphasic state (the coexistence of optically anisotropic and isotropic phases) is appeared. In further higher concentration region, the entire system shows a single liquid crystal phase. In this type of liquid crystal, the solvation environment strongly depends on the concentration. Here, typical lyotropic binary mixture system with amphiphilic molecule and water will be described as an example. Under the condition that the amphiphile concentration exceeds the critical micelle concentration, micelles are formed through the self-organization of each hydrophobic moiety by the hydrophobic interaction. The micelle concentration increases along the increase of the solute concentartion. As the micelle concentration increases, each micell rearranges the aggregation structure and forms lyotropic LC
31
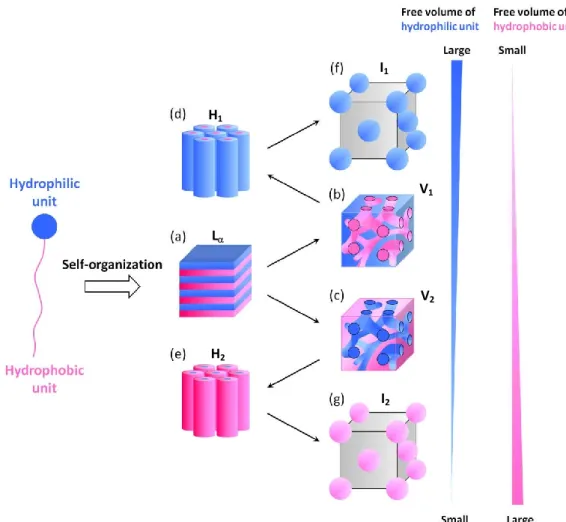
structure with solvent molecules. The lyotropic self-assembled LC structures are strongly affected by the free volume ratio between hydrophilic part, hydrophobic part and solvating solvent molecules. In the case where there is no big difference in the three-dimensional spreads of free space between non-polar and polar parts, lyotropic LC molecules exhibits lamella (L) phase with a layer
structure(Figure 1-19a). When the diference between each three-dimensional spreads of free space is gradually increased, lyotropic LC structures change to normal bicontinuous cubic (V1), reversed
bicontinuous cubic (V2), normal hexagonal (H1), reversed hexagonal (H2), normal cubic (I1) and
reversed cubic (I2) structures. In V1 and V2 phases, the slight difference of free volumes between
hydrophilic and hydrophobic parts induces the curvature into the layer ordering and forms the bicontinuous cubic structures with double gyroid interface (Figure 1-19b, c). In the case of increasing difference of free volumes of two parts, closely packed hexagonal cylinder structures are formed and assembled into the the H1 and H2 phases (Figure 1-19d, e). When there is an extreme bias in their
free volumes, I1 or I2 phases are induced. In I1 and I2 phases, small aggregates of LC molecules have
cubic lattice arrangement (Figure 1-19f, g). The lyotropic LC structures are similar to those of thermotropic LC system.
Figure 1-19. Schematic iilustartions of self-assembled structures in lyotropic LC system.
H1 I1 V1 L H2 I2 V2
32
In some cases, molecules bearing a rigid central aromatic core working as dye unit (chromophore) or biofunctional unit with flexible side chains can form LC ordered structure with assistance of sovent molecules. Such LC system is called "chromonic liquid crystal".51a, 70 In chromonic systems, the aggregation of core unit induces the formation of mesophases.71 The typical chromonic LC materials are as shown in Figure 1-20.72
Figure 1-20. Chemical structures of representative chromonic LC compounds.72
As can be easily assumed from the fact that the first discovery of lyotropic LC structures was in myelin sheath,56 the lyotropic LC system can be found in living body system. Lipid bilayer membranes
(cell membranes), polypeptides, nerve tissues and bacteriophages are biomaterials based on the lyotropic LC system. These hierarchical LC self-assembled structures play important roles in the biological functions.73
1.3.2.2. Thermotropic LC system51
Unlike lyotropic systems, thermotropic LC systems are possible to exhibit mesophases without the support of solvents. In general, thermotropic LC molecules have flexible chains and a rigid core. Rigid cores are usually comprised of aromatic moieties and determine the optical and electronic property of the LC self-assemblies. In contrast, flexible units are associated with the softness and flexibility of the assemblies. The self-assembled structure in the LC phase reflects molecular shapes and structures of thermotropic LC compounds. The free volumes of flexible side chains have strong dependence on temeperature. The balance of free volumes between rigid core and flexible unit is very important for exhibiting the thermotropic LC properties.
A) Calamitic liquid crystal system
From the viewpoint of conventional liquid crystal science, molecules with a large aspect ratio of molecular structure tend to exhibit mesomorphic properties. In particular, rod-like molecular structures are typical mesogen skeleton which has been widely studied. “Calamitic” liquid crystal is the self-assembled system comprised of rod-like molecules.
33
Nematic phase
Nematic (N) phase is the simplest and most fluidic state in calamitic LC system. LC molecules in N phase do not have a three-dimensional positional order, but only orientational order (Figure 1-21).
In the N phase composed of rod-like molecules with large aspect ratio, characteristic phenomena are generated. The N LC materials exhibit optical, electrical and magnetic anisotropy due to the anisotropic electron density distribution formed on rod-like molecules. The N phase can be regarded as a low viscous LC phase, because the attraction terms of intermolecular interactions in N phase are generally smaller than those in other LC phases. As the offset behavior of the external field due to the polarization produced by permanent or induced dipoles, therefore, LC molecules in N phase respond to the electric field and the molecular reorientation behavior are induced. This field-induced reorientation behavior in the N LC system is utilized for the conventional drive principle of liquid crystal display, which is the most typical and successful application of liquid-crystalline system. In addition, the N LC material is the most suitable LC system for control of molecular orientation. This is because structural defects other than dislocations (point defect) cannot generate in N phase and monodomain N LC structure can be formed by the uniaxial alignment of LC molecules. In fact, the methods to control molecular orientation in N phase by rubbing techinique have been established.74 The horizontal and vertical alignment films composed of polymers such as polyvinyl alcohols and polyimides are widely utilized. Furthermore, uniaxially aligned monodomain structure of N LC materials can be formed by a rubbing technique for producing uniaxial grooves on substrates. Up to now, deep investigations on orientation control of LC molecules have been made it possible to control the precise orientation angle of LC molecules. Photo-alignment technique applying the photoisomerization behavior of azobenzene has also been established.75
34
Typical N LC molecules are shown in Figure 1-22.66, 76
Figure 1-22. Chemical structures of representative N LC compounds.66, 76
As is described former, the structural defects that can exist in the N phase are only dislocations. The feature of the defect formation is reflected to the optical textures under crossed nichol. The typical optical patterns in nematic phase are “Schrielen” textures (Figure 1-23). Although the schrielen textures are also observed in the homeotropic region of a smectic phase, only 4-brush-type can be found for the smectic phase. The coexistence of 2-brush-type and 4-brush-type schrielen patterans is strong evidence on the identification of nematic phase.
Figure 1-23. Typical “Schrielen” texture in N LC phase.77
Smectic phases
Smectic phases are another type of the calamitic LC phases and have higher structural orders than N phase. Although LC molecules in N phase have only orientation order, LC molecules in smectic phases have positional orders and form the layer structures. Smectic phases are classified more finely according to existence of intralayer positional order and relationship between layer normal and molecular orientation direction. The structural features of each smectic phase are shown in Figure 1-24 below.
35
Figure 1-24. Classification of smectic LC phases.
The smectic LC materials also exhibit optical, electrical and magnetic anisotropy originated from the anisotropic electron density distribution of rod-like molecules. Smectic phases are generally regarded as more viscous phase than N phase, because smectic LC molecules are bounded by strong intermolecular interactions than N LC molecules.
Typical smectic LC molecules are shown in Figure 1-25. 76a, 78
Figure 1-25. Chemical structures of representative smectic LC compounds (SmA: smectic A, SmB: smectic B, SmC: smectic C, SmE: smectic E, SmF: Smectic F).76a, 78
36
Chiral nematic and chiral smectic phases79, 80, 81
Typical N and smectic phases are achiral calamitic LC system. As the introduction of molecular chirality to calamitic LC molecules brings to the drastically structural change described below, LC system with the chirality is distinguished with the achiral system and considered as independent chiral LC system. Molecular chirality usually induces the formation of helical structures, due to minimization of elastic free energy in the system. The helical structure and helical axis reflect the absolute configuration of the molecules labeled (R) or (S). The helical nature based on molecular chirality is important for functions such as chiral molecular recognition.82 Even when helical structures are not formed, furthermore, molecular chirality breaks the symmetry of a system, which generates the characteristic phenomena such as ferroelectricity.18, 81h, 83
Chiral LC phases can be induced by the introduction of molecular chirality to the LC system. The Induction of chiral LC phases is generally achieved by a doping of chiral addidtives into LC materials. Chiral LC phases also can be found in single component LC molecues with molecular chirality.
When a chiral side chain is introduced to the LC molecule which has a tendency to exhibit N phase, it twists around the axis perpendicular to the molecular long axis (director), resulting in the formation of a helical structure spontaneously (Figure 1-26a). This twisted nematic phase is called as a chiral nematic (N*) or a cholesteric phase. (The name of cholestric phase is derived from the fact that this phase was first discovered for cholesteryl esters.) In the N* phase, specific selective reflection is observed. The characteristic phenomenon is originated from the helical structure of the N* phase and the helical pitch depends on the temperature of the LC system. Therefore, it has been demonstrated for the application to the thermal sensor.84 Moreover, the design of the luminescent LC materials offers circularly polarized light (CPL) emitting devices85 and organic lasing media.86
In smectic phases, chiral side chains often generate a helical axis along the layer normal. In SmC-type LC phase where the director tilts to the layer normal, the director changes periodically along the layer normal (Figure 1-26b). This tilted Sm phase with chirality is defined as a chiral smectic C (SmC*) phase. This phase often exhibits ferroelectricity and the application to high speed displays was attempted.87
(a) (b)
37
Typical chiral LC molecules are shown in Figures 1-2753, 54,88 and 1-28.18,89
Figure 1-27. Chemical structures of representative N* LC compounds.53, 54, 88
Figure 1-28. Chemical structures of representative chiral smectic LC compounds.18, 89
B) Discotic liquid crystal system
In addition to typical calamitic LC system composed of rod-like molecules, disc-like molecules also are well-known as a mesogenic core. “Discotic” liquid crystal is the self-assembled system comprised of such disk-shaped molecules.90
Discotic nematic and columnar nematic phases 90
Discotic nematic (ND) phase is the most disordered LC state in discotic LC system. ND phase
corresponds to N phase in the calamitic LC system. LC molecules in ND phase have only orientation
order but no positional order (Figure 1-29a).91
On the hand, columnar nematic (NC) phase is slightly more structured LC phase than ND phase. LC
molecules in NC phase form only small columnar aggregates of which orientational order but not
higher positional-order (Figure 1-29b).92
These ND and NC LC materials composed of disk-shaped molecules also show optical, electrical
and magnetic anisotropic nature. Representative molecules exhibiting these LC phases are shown in Figure 1-30 93 and 1-31.94
(a) (b)
38
Figure 1-30. Chemical structures of representative ND LC compounds.93
Figure 1-31. Chemical structures of representative NC LC compounds.94
Columnar phases 95
Most of disc-like LC molecules exhibit the columnar (Col) phase. Representative Col LC compounds are shown in Figure 1-32.67, 96 Discotic columnar LC molecules have position orders of cylindrical assemblies. The fine classification of columnar phases is essentially based on the position orders (packing styles). The structural features of each columnar phase are shown in Figure 1-33 below.
39
Figure 1-32. Chemical structures of representative Col LC compounds.67, 96
Figure 1-33. Schematic illustrations of self-assembled structures in columnar phases.
C) Other liquid crystal system
Micellar cubic phase 97
Micellar cubic (Cub) phase has an isotropic LC structure in which nanometer scale aggregates are arranged in a cubic lattice (Figure 1-34). When LC molecules have large difference of the free volumes between mesogenic core and dynamic side chains, a large curvature should be generated. Therefore, LC molecules do not behave as rods nor disks in the LC phase. In case of forming the Cub LC structure, small spherical aggregates arranged in a cubic lattice are constructed by several LC molecules with extreme free volume bias between rigid and flexible units. A variety of Cub LC structures can be distinguished by the application of space groups in crystallography to the periodic array of small