APPENDIX 1
OVERVIEW OF THE GLOBAL CHANGE
OBSERVATION MISSION (GCOM)
1-2
1. Introduction
Comprehensive observation, understanding, assessment, and prediction of global climate change are common and important issues for all mankind. This is also identified as one of the important socio-economic benefits by the 10-year implementation plan for Earth Observation that was adopted by the Third Earth Observation Summit to achieve the Global Earth Observation System of Systems (GEOSS). International efforts to comprehensively monitor the Earth by integrating various satellites, in-situ measurements, and models are gaining importance. As a contribution to this activity, the Japan Aerospace Exploration Agency (JAXA) plans to develop the Global Change Observation Mission (GCOM). GCOM will take over the mission of the Advanced Earth Observing Satellite-II (ADEOS-II) and develop into long-term monitoring of the Earth.
As mentioned in the fourth assessment report of the Intergovernmental Panel on Climate Change (IPCC), warming of the climate system is unequivocal as is now evident from observations of increases in global average air and ocean temperatures and widespread melting of snow and ice. However, climate change signals are generally small and modulated by natural variability, and are not necessarily uniform over the Earth. Therefore, the observing system of the climate variability should be stable, and should cover a long term over the entire Earth.
To satisfy these needs, GCOM consists of two medium-size, polar-orbiting satellite series and multiple generations (e.g., three generations) with one-year overlaps between consecutive generations for inter-calibration. The two satellite series are GCOM-W (Water) and GCOM-C (Climate). Two instruments were selected to cover a wide range of geophysical parameters: the Advanced Microwave Scanning Radiometer-2 (AMSR2) on GCOM-W and the Second-generation Global Imager (SGLI) on GCOM-C. The AMSR2 instrument will perform observations related to the global water and energy cycle, while the SGLI will conduct surface and atmospheric measurements related to the carbon cycle and radiation budget. This chapter presents an overview of the mission objectives, observing systems, and data products of GCOM.
2. Mission Objectives
The major objectives of GCOM can be summarized as follows.
- Establish and demonstrate a global, long-term Earth-observing system for understanding climate variability and the water-energy cycle.
- Enhance the capability of climate prediction and provide information to policy makers through process studies and model improvements in concert with climate model research institutions. - Construct a comprehensive data system integrating GCOM products, other satellite data, and in-situ
measurements.
- Contribute to operational users including weather forecasting, fishery, and maritime agencies by providing near-real-time data.
- Investigate and develop advanced products valuable for understanding of climate change and water cycle studies.
Detailed explanations of the objectives are as follows.
(1) Understanding global environment changes
A) Establish and demonstrate a global, long-term Earth-observing system that is able to observe valuable geophysical parameters for understanding global climate variability and
water cycle mechanisms.
B) Contribute to improving climate prediction models by providing accurate values of model parameters.
C) Clarify sinks and sources of greenhouse gases.
D) Contribute to validating and improving climate prediction models by forming a collaborative framework with climate model institutions and providing long-term geophysical datasets to them.
E) Detect trends of global environment changes (e.g., global warming, vegetation changes, desertification, variation of atmospheric constituents, wide area air pollution, and depletion of ozone layers) from long-term variability of geophysical parameters by extracting short-term (three- to six-year) natural variability.
F) Advance process studies of Earth environmental changes using observation data.
G) Estimate radiative forcing, energy and carbon fluxes, and albedo by combining satellite geophysical parameters, ground in-situ measurements, and models.
H) Advance the understanding of the Earth’s system through the activities above. I) Contribute to an international environmental strategy utilizing the results above.
(2) Direct contribution to improving people’s lives
A) Improvement of weather forecast accuracy (particularly typhoon track prediction, localized severe rain, etc.).
B) Improvement of forecast accuracy for unusual weather and climate. C) Improvement of water-route and maritime information.
D) Provision of fishery information. E) Efficient coastal monitoring.
F) Improved yield prediction of agricultural products.
G) Monitoring and forecasting air pollution including yellow dust.
H) Observation of volcanic smoke and prediction of the extent of the impact. I) Detection of forest fires.
3. Observing Systems 3.1. Overall concept
As mentioned in the previous section, the entire GCOM will consist of two satellite series spanning three generations. However, a budget will be approved for each satellite. Currently, only the GCOM-W satellite has been launched as the first satellite in the GCOM series. Both GCOM-W and GCOM-C satellites will be medium-size platforms that are smaller than the ADEOS-II satellite. This is to reduce the risk associated with large platforms having valuable and multiple observing instruments. Also, since the ADEOS-II problem was related to the solar paddle, a dual solar-paddle design was adopted for both satellites. To assure data continuity and consistent calibration, follow-on satellites will be launched so as to overlap the preceding satellite by one year. The concept is summarized in Fig. 1.
GCOM-C GCOM-C2 GCOM-W GCOM-W2 GCOM-W3 Launch 1-year May 18 2012
1-4
3.2. GCOM-W and AMSR2 instrument
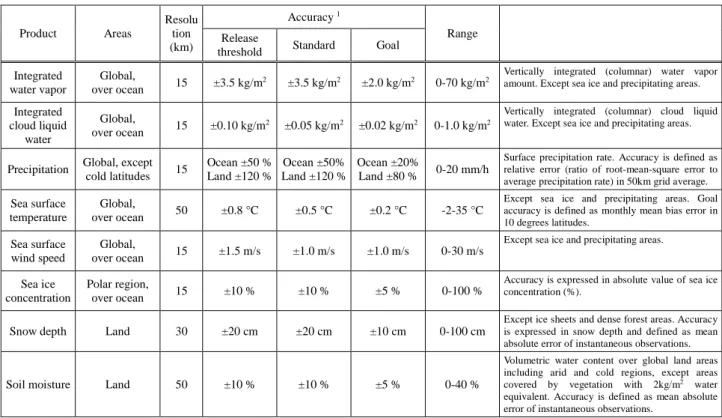
Figure 2 presents an overview of the GCOM-W satellite; its major characteristics are listed in Table 1. GCOM-W will carry AMSR2 as the sole onboard mission instrument. The satellite will orbit at an altitude of about 700km and will have an ascending node local time of 13:30, to maintain consistency with Aqua/AMSR-E observations.
Figure 2: Overview of GCOM-W Satellite
Table 1: Major Characteristicsof GCOM-WSatellite
Instrument Advanced Microwave Scanning Radiometer-2 (AMSR2) Orbit Sun-synchronous orbit
Altitude: 700km (over the equator) Size 5.1m (X) * 17.5m (Y) * 3.4m (Z) (on-orbit)
Mass 1991kg
Power More than 3880W (EOL) Launch May 18, 2012 by H-IIA Rocket Design Life 5 years
Status Phase-D
Figure 1 presents an overview of the AMSR2 instrument in two different conditions. Also, basic characteristics including center frequency, bandwidth, polarization, instantaneous field of view (FOV), and sampling interval are indicated in Table 2. The basic concept is almost identical to that of AMSR-E: a conical scanning system with a large offset parabolic antenna, feed horn cluster to realize multi-frequency observation, external calibration with two temperature standards, and total-power radiometer systems. The 2.0m diameter antenna, which is larger than that of AMSR-E, provides better spatial resolution at the same orbit altitude of around 700km. The antenna will be developed based on the experience gained from the 2.0m diameter antenna for ADEOS-II AMSR except the deployment mechanism. For the C-band receiver, we adopted additional 7.3GHz channels for possible mitigation of radio-frequency interference. An incidence angle of 55 degrees (over the equator) was selected to maintain consistency with AMSR-E. The swath width of 1450km and the selected satellite orbit will provide almost complete coverage of the entire Earth’s surface within two days independently for ascending and descending observations.
Figure 3: Sensor Unit of AMSR2 Instrument in Deployed (left) and Stowed (right) Conditions.
Table 2: Major Characteristics ofAMSR2Instrument
Parameter Performance and characteristics
Center Frequency (GHz) 6.925/7.3 10.65 18.7 23.8 36.5 89.0
Bandwidth (MHz) 350 100 200 400 1000 3000
Polarization Vertical and Horizontal polarization
NE∆T (K) 1 < 0.34/0.43 < 0.70 < 0.70 < 0.60 < 0.70 < 1.20/1.40 2
Dynamic range (K) 2.7 to 340
Nominal incidence angle (deg.) 55.0 55.0/54.5 2
Beam width (deg.) 1.8 1.2 0.65 0.75 0.35 0.15
IFOV (km) Cross-track x along-track 35x62 24x42 14x22 15x26 7x12 3x5
Approximate sampling interval (km) 10 5
Swath width (km) > 1450
Digital quantization (bits) 12
Scan rate (rpm) 40
3.3. GCOM-C and SGLI instrument
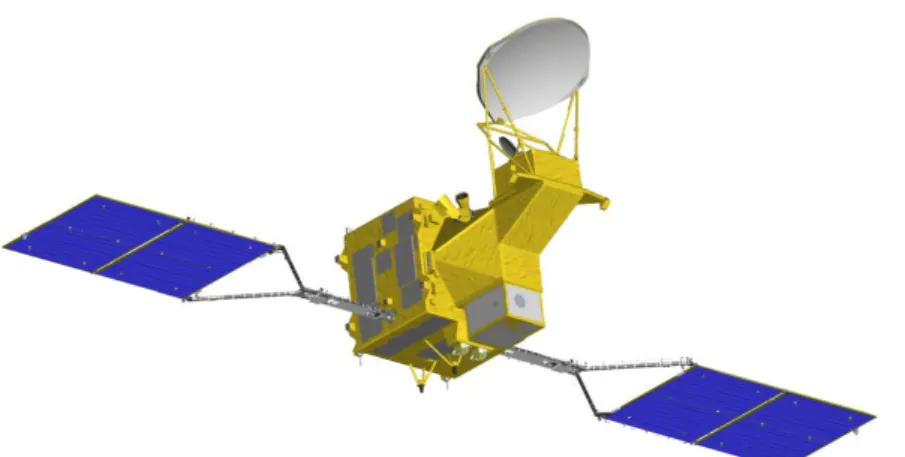
Figure 4 gives an overview of the GCOM-C satellite; its major characteristics are listed in Table 3. GCOM-C will carry SGLI as the sole mission onboard instrument. The satellite will orbit at an altitude of about 800km; the descending node local time will be 10:30, to maintain a wide observation swath and reduce cloud interference over land.
1-6
Figure 4: Overview of GCOM-C Satellite
Table 3: MajorCharacteristicsofGCOM-CSatellite
Instrument Second-generation Global Imager (SGLI) Orbit Sun-synchronous orbit
Altitude: 798km (over the equator) Size 4.6m (X) * 16.3m (Y) * 2.8m (Z) (on orbit)
Mass 2093kg
Power More than 4000W (EOL) Launch JFY2016 by H-IIA Rocket Design Life 5 years
Status Phase-C
The SGLI instrument has two major new features: 250m spatial resolution for most of the visible channels and polarization/multidirectional observation capabilities. The 250m resolution will provide enhanced observation capability over land and coastal areas where the influences of human activity are most obvious. The polarization and multidirectional observations will enable us to retrieve aerosol information over land. Precise observation of global aerosol distribution is a key for improving climate prediction models.
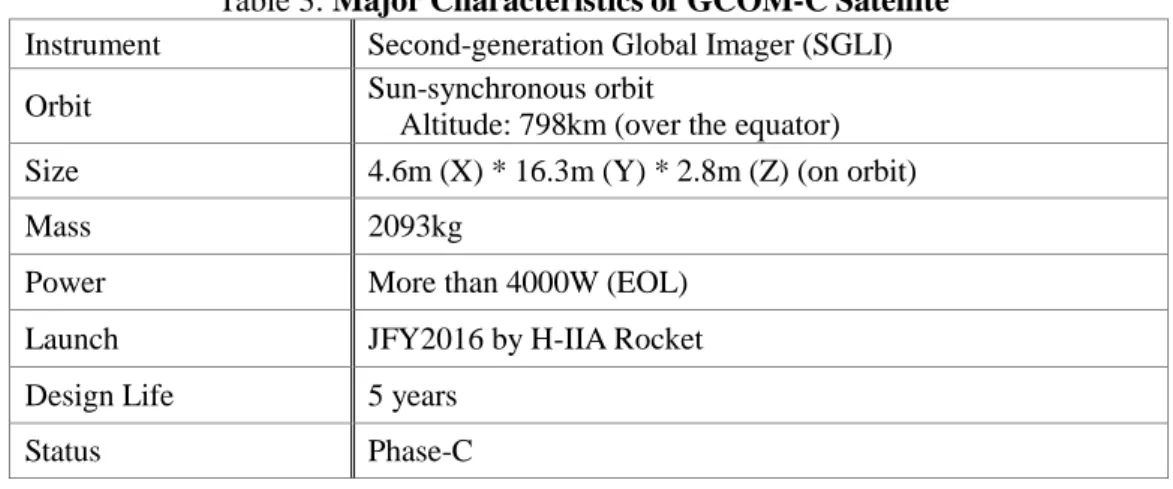
SGLI consists of two major components: the Infrared Scanner (IRS) and the Visible and Near-infrared Radiometer (VNR). An overview of the SGLI instrument is shown in Fig. 5 for the entire radiometer layout, IRS, and VNR components. Also, requirements for sensor performance are listed in Tables 4 and 5. VNR can be further divided into two components: VNR-Non Polarized (VNR-NP) and VNR-Polarized (VNR-P). VNR-NP and VNR-P are the 11-channel multi-band radiometer and the polarimeter with three polarization angles (0, 60, and 120 degrees). VNR-P has a tilting function to meet the scatter angle requirement from aerosol observation. The IRS is an infrared radiometer covering wavelengths from 1μm to 12μm. It consists of short infrared (SWI; 1.05 to 2.21μm) and thermal infrared (TIR 10.8 and 12.0μm) sensors. It employs a scanning mirror system with a 45-degree tilted flat mirror rotating continuously to realize an 80-degree observation swath and calibration measurement in every scan.
Through intensive discussions and optimizing studies, the number of SGLI channels was decreased from the 36 channels of GLI aboard ADEOS-II to 19 channels, while the number of SGLI standard products will increase compared to those of GLI.
Figure 5: Overview of SGLI Radiometer Layout (upper), IRS Instrument (lower-left), and VNR
Radiometers (lower-right).
Table 4: SGLI MajorPerformanceRequirements
Item Requirement
Spectral Bands VNR-NP : 11CH 380-865nm
VNR-P : 2CH 673.5, 868.5nm / 0, 60, 120deg Polarization IRS SWI : 4CH 1.05-2.21μm
IRS TIR : 2CH 10.8, 12.0μm
Scan Angle VNR-NP : 70deg (Push broom scanning) VNR-P : 55deg (Push broom scanning)
IRS SWI/TIR : 80deg (45deg rotation mirror scanning) Swath width 1150km for VNR-NP/P
1400km for IRS SWI/TIR Instantaneous field of view
(IFOV) at nadir VNR-NP VNR-P : 250m : 1000m
IRS SWI : 250m(SW3CH), 1000m(SW1,2,4CH) IRS TIR : 500m (250m: option)
Observing direction ±45 degrees in along track direction for VNR-P Nadir for VNR-NP, IRS SWI, and IRS TIR
Quantization 12bit
Absolute Calibration Accuracy VNR : ≤3% IRS : ≤5% TIR : ≤0.5K
1-8
Table 5: SGLIObservationRequirement Details
CH λ Δλ IFOV SNR L (for SNR)
nm: VNR, IRS SWI
μm: IRS TIR m SNR: VNR, IRS SWI NEΔT(K): IRS TIR W/m
2/sr/μm VNR-NP VN1 380 10 250 250 60 VN2 412 10 250 400 75 VN3 443 10 250 300 64 VN4 490 10 250 400 53 VN5 530 20 250 250 41 VN6 565 20 250 400 33 VN7 673.5 20 250 400 23 VN8 673.5 20 250 250 25 VN9 763 12 250 1200 (@1km IFOV) 40 VN10 868.5 20 250 400 8 VN11 868.5 20 250 200 30 VNR-P P1 673.5 20 1000 250 25 P2 868.5 20 1000 250 30 IRS SWI SW1 1050 20 1000 500 57 SW2 1380 20 1000 150 8 SW3 1630 200 250 57 3 SW4 2210 50 1000 211 1.9
IRS TIR T1 10.8 0.74 1000/500/250 0.2 (@500m IFOV) 300 (K) T2 12.0 0.74 1000/500/250 0.2 (@500m IFOV) 300 (K)
4. Products
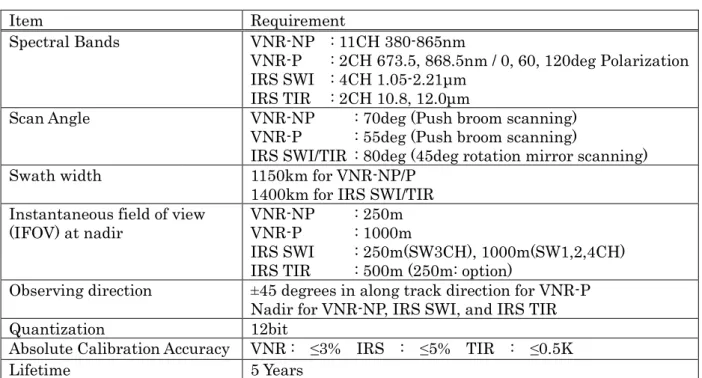
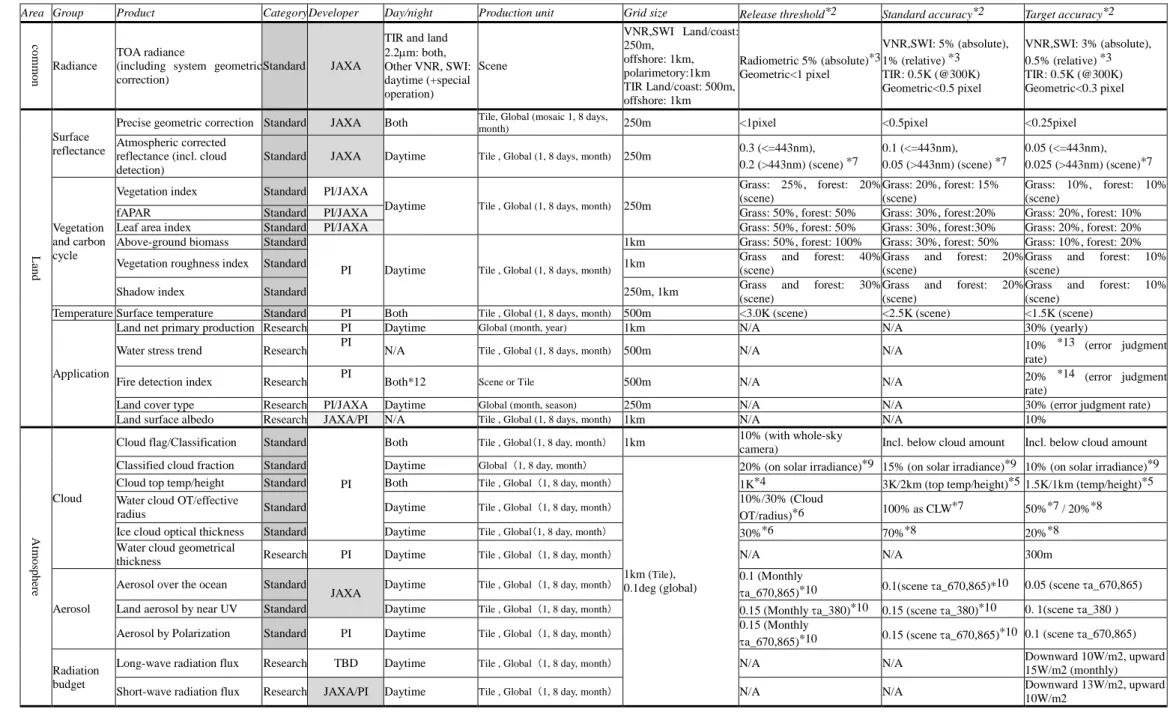
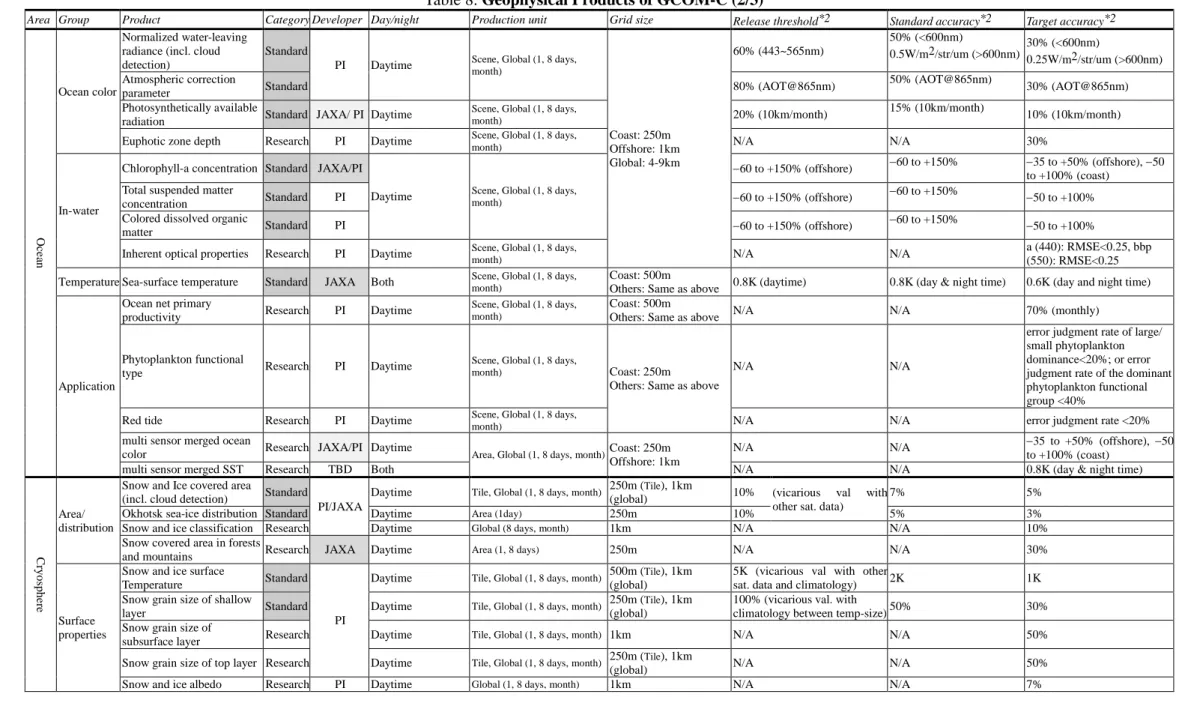
Geophysical products made available by GCOM-W and GCOM-C are listed in Tables 6, 7, and 8. There are two categories of data products: standard product and research product. A “standard” product is defined as a product with proven accuracy that is to be operationally processed and distributed. In contrast, a “research” product is a prototype for a standard product and is processed on a research basis. Both tables indicate standard products with shading.
Table 6: Standard Geophysical Products of GCOM-W Product Areas Resolu tion (km) Accuracy 1 Range Release
threshold Standard Goal Integrated
water vapor
Global,
over ocean 15 ±3.5 kg/m
2 ±3.5 kg/m2 ±2.0 kg/m2 0-70 kg/m2
Vertically integrated (columnar) water vapor amount. Except sea ice and precipitating areas.
Integrated cloud liquid water Global, over ocean 15 ±0.10 kg/m 2 ±0.05 kg/m2 ±0.02 kg/m2 0-1.0 kg/m2
Vertically integrated (columnar) cloud liquid water. Except sea ice and precipitating areas.
Precipitation Global, except cold latitudes 15 Ocean ±50 % Land ±120 % Ocean ±50% Land ±120 % Ocean ±20% Land ±80 % 0-20 mm/h
Surface precipitation rate. Accuracy is defined as relative error (ratio of root-mean-square error to average precipitation rate) in 50km grid average.
Sea surface temperature
Global,
over ocean 50 ±0.8 °C ±0.5 °C ±0.2 °C -2-35 °C
Except sea ice and precipitating areas. Goal accuracy is defined as monthly mean bias error in 10 degrees latitudes.
Sea surface wind speed
Global,
over ocean 15 ±1.5 m/s ±1.0 m/s ±1.0 m/s 0-30 m/s
Except sea ice and precipitating areas.
Sea ice concentration
Polar region,
over ocean 15 ±10 % ±10 % ±5 % 0-100 %
Accuracy is expressed in absolute value of sea ice concentration (%).
Snow depth Land 30 ±20 cm ±20 cm ±10 cm 0-100 cm
Except ice sheets and dense forest areas. Accuracy is expressed in snow depth and defined as mean absolute error of instantaneous observations.
Soil moisture Land 50 ±10 % ±10 % ±5 % 0-40 %
Volumetric water content over global land areas including arid and cold regions, except areas covered by vegetation with 2kg/m2 water
equivalent. Accuracy is defined as mean absolute error of instantaneous observations.
1 Accuracy is defined as root-mean-square error of instantaneous values unless otherwise stated. Assumed validation methodologies are not explained here.
Table 7: Research Products of GCOM-W
Products Area Resolution
(km) Target accuracy Range All-weather sea surface wind speed Ocean 60 ± 7 m/s 0 - 70 m/s
High-resolution (10-GHz)
sea surface temperature Ocean 30 ± 0.8 °C 9 - 35 °C Soil moisture and vegetation water
content based on the land data assimilation Africa, Australia 25 soil moisture: ± 8% vegetation water: ± 1 kg/m2 soil moisture: 0 - 100 % vegetation water: 0 - 2 kg/m2 Land surface temperature Land 15 forest area: ± 3 °C
nondense vegetation: ± 4 °C 0 - 50 °C Vegetation water content Land 10 ± 1 kg/m2 0 - 4 kg/m2 High resolution sea ice concentration Ocean in high
latitude 5 ± 1 % 0 - 100 % Thin ice detection Okhotsk sea 15 ± 80 % N/A Sea ice moving vector Ocean in high
latitude 50
2 components:
1-10
Table 8: Geophysical Products of GCOM-C (1/3)
Area Group Product Category Developer Day/night Production unit Grid size Release threshold*2 Standard accuracy*2 Target accuracy*2
co
m
mo
n Radiance
TOA radiance
(including system geometric correction)
Standard JAXA
TIR and land 2.2µm: both, Other VNR, SWI: daytime (+special operation) Scene VNR,SWI Land/coast: 250m, offshore: 1km, polarimetory:1km TIR Land/coast: 500m, offshore: 1km Radiometric 5% (absolute)*3 Geometric<1 pixel VNR,SWI: 5% (absolute), 1% (relative) *3 TIR: 0.5K (@300K) Geometric<0.5 pixel VNR,SWI: 3% (absolute), 0.5% (relative) *3 TIR: 0.5K (@300K) Geometric<0.3 pixel L and Surface reflectance
Precise geometric correction Standard JAXA Both Tile, Global (mosaic 1, 8 days, month) 250m <1pixel <0.5pixel <0.25pixel Atmospheric corrected
reflectance (incl. cloud detection)
Standard JAXA Daytime Tile , Global (1, 8 days, month) 250m 0.3 (<=443nm), 0.2 (>443nm) (scene) *7 0.1 (<=443nm), 0.05 (>443nm) (scene) *7 0.05 (<=443nm), 0.025 (>443nm) (scene)*7 Vegetation and carbon cycle
Vegetation index Standard PI/JAXA
Daytime Tile , Global (1, 8 days, month) 250m
Grass: 25%, forest: 20% (scene) Grass: 20%, forest: 15% (scene) Grass: 10%, forest: 10% (scene)
fAPAR Standard PI/JAXA Grass: 50%, forest: 50% Grass: 30%, forest:20% Grass: 20%, forest: 10% Leaf area index Standard PI/JAXA Grass: 50%, forest: 50% Grass: 30%, forest:30% Grass: 20%, forest: 20% Above-ground biomass Standard
PI Daytime Tile , Global (1, 8 days, month)
1km Grass: 50%, forest: 100% Grass: 30%, forest: 50% Grass: 10%, forest: 20% Vegetation roughness index Standard 1km Grass and forest: 40%
(scene)
Grass and forest: 20% (scene)
Grass and forest: 10% (scene)
Shadow index Standard 250m, 1km Grass (scene) and forest: 30% (scene) Grass and forest: 20% Grass (scene) and forest: 10% Temperature Surface temperature Standard PI Both Tile , Global (1, 8 days, month) 500m <3.0K (scene) <2.5K (scene) <1.5K (scene)
Application
Land net primary production Research PI Daytime Global (month, year) 1km N/A N/A 30% (yearly)
Water stress trend Research PI N/A Tile , Global (1, 8 days, month) 500m N/A N/A 10% *13 (error judgment rate)
Fire detection index Research PI Both*12 Scene or Tile 500m N/A N/A 20% *14 (error judgment rate)
Land cover type Research PI/JAXA Daytime Global (month, season) 250m N/A N/A 30% (error judgment rate) Land surface albedo Research JAXA/PI N/A Tile , Global (1, 8 days, month) 1km N/A N/A 10%
A tm o sp h er e Cloud
Cloud flag/Classification Standard
PI
Both Tile , Global(1, 8 day, month) 1km 10% (with whole-sky
camera) Incl. below cloud amount Incl. below cloud amount Classified cloud fraction Standard Daytime Global (1, 8 day, month)
1km (Tile), 0.1deg (global)
20% (on solar irradiance)*9 15% (on solar irradiance)*9 10% (on solar irradiance)*9 Cloud top temp/height Standard Both Tile , Global (1, 8 day, month) 1K*4 3K/2km (top temp/height)*5 1.5K/1km (temp/height)*5 Water cloud OT/effective
radius Standard Daytime Tile , Global (1, 8 day, month)
10%/30% (Cloud
OT/radius)*6 100% as CLW*7 50%*7 / 20%*8 Ice cloud optical thickness Standard Daytime Tile , Global(1, 8 day, month) 30%*6 70%*8 20%*8
Water cloud geometrical
thickness Research PI Daytime Tile , Global (1, 8 day, month) N/A N/A 300m
Aerosol
Aerosol over the ocean Standard
JAXA Daytime Tile , Global (1, 8 day, month)
0.1 (Monthly
τa_670,865)*10 0.1(scene τa_670,865)*10 0.05 (scene τa_670,865) Land aerosol by near UV Standard Daytime Tile , Global (1, 8 day, month) 0.15 (Monthly τa_380)*10 0.15 (scene τa_380)*10 0. 1(scene τa_380 )
Aerosol by Polarization Standard PI Daytime Tile , Global (1, 8 day, month) 0.15 (Monthly
τa_670,865)*10 0.15 (scene τa_670,865)*10 0.1 (scene τa_670,865) Radiation
budget
Long-wave radiation flux Research TBD Daytime Tile , Global (1, 8 day, month) N/A N/A Downward 10W/m2, upward 15W/m2 (monthly) Short-wave radiation flux Research JAXA/PI Daytime Tile , Global (1, 8 day, month) N/A N/A Downward 13W/m2, upward 10W/m2
Table 8: Geophysical Products of GCOM-C (2/3)
Area Group Product Category Developer Day/night Production unit Grid size Release threshold*2 Standard accuracy*2 Target accuracy*2
O
cea
n
Ocean color
Normalized water-leaving radiance (incl. cloud detection)
Standard
PI Daytime Scene, Global (1, 8 days, month)
Coast: 250m Offshore: 1km Global: 4-9km 60% (443~565nm) 50% (<600nm) 0.5W/m2/str/um (>600nm) 30% (<600nm) 0.25W/m2/str/um (>600nm) Atmospheric correction
parameter Standard 80% (AOT@865nm)
50% (AOT@865nm)
30% (AOT@865nm) Photosynthetically available
radiation Standard JAXA/ PI Daytime
Scene, Global (1, 8 days,
month) 20% (10km/month)
15% (10km/month)
10% (10km/month) Euphotic zone depth Research PI Daytime Scene, Global (1, 8 days, month) N/A N/A 30%
In-water
Chlorophyll-a concentration Standard JAXA/PI
Daytime Scene, Global (1, 8 days, month)
−60 to +150% (offshore) −60 to +150% −35 to +50% (offshore), −50 to +100% (coast)
Total suspended matter
concentration Standard PI −60 to +150% (offshore)
−60 to +150% −50 to +100% Colored dissolved organic
matter Standard PI −60 to +150% (offshore)
−60 to +150% −50 to +100%
Inherent optical properties Research PI Daytime Scene, Global (1, 8 days, month) N/A N/A a (440): RMSE<0.25, bbp (550): RMSE<0.25 Temperature Sea-surface temperature Standard JAXA Both Scene, Global (1, 8 days, month) Coast: 500m
Others: Same as above 0.8K (daytime) 0.8K (day & night time) 0.6K (day and night time)
Application
Ocean net primary
productivity Research PI Daytime
Scene, Global (1, 8 days, month)
Coast: 500m
Others: Same as above N/A N/A 70% (monthly)
Phytoplankton functional
type Research PI Daytime
Scene, Global (1, 8 days,
month) Coast: 250m Others: Same as above
N/A N/A
error judgment rate of large/ small phytoplankton dominance<20%; or error judgment rate of the dominant phytoplankton functional group <40%
Red tide Research PI Daytime Scene, Global (1, 8 days, month) N/A N/A error judgment rate <20% multi sensor merged ocean
color Research JAXA/PI Daytime Area, Global (1, 8 days, month) Coast: 250m
Offshore: 1km
N/A N/A −35 to +50% (offshore), −50 to +100% (coast)
multi sensor merged SST Research TBD Both N/A N/A 0.8K (day & night time)
C ry o sp h er e Area/ distribution
Snow and Ice covered area
(incl. cloud detection) Standard
PI/JAXA
Daytime Tile, Global (1, 8 days, month) 250m (Tile), 1km
(global) 10% (vicarious val with other sat. data)
7% 5%
Okhotsk sea-ice distribution Standard Daytime Area (1day) 250m 10% 5% 3% Snow and ice classification Research Daytime Global (8 days, month) 1km N/A N/A 10% Snow covered area in forests
and mountains Research JAXA Daytime Area (1, 8 days) 250m N/A N/A 30%
Surface
Snow and ice surface
Temperature Standard PI
Daytime Tile, Global (1, 8 days, month) 500m (Tile), 1km
(global)
5K (vicarious val with other
sat. data and climatology) 2K 1K Snow grain size of shallow
layer Standard Daytime Tile, Global (1, 8 days, month)
250m (Tile), 1km (global)
100% (vicarious val. with
climatology between temp-size) 50% 30% Snow grain size of
1-12
Table 8: Geophysical Products of GCOM-C (3/3)
Area Group Product Category Developer Day/night Production unit Grid size Release threshold*2 Standard accuracy*2 Target accuracy*2
C ry o sp h er e Surface properties
Snow impurity Research PI Daytime Tile, Global (1, 8 days, month) 250m (Tile), 1km
(global) N/A N/A 50%
Ice sheet surface roughness Research PI Daytime Area (Season) 1km N/A N/A 0.05 *15 Boundary Ice sheet boundary
monitoring Research JAXA Daytime Area (Season) 250m N/A N/A <500m Common notes:
*1. Heritage levels from ADEOS-II/GLI study are shown by A-C; A: high heritage, B: Remaining issues, C: new or many issues remaining to be resolved
*2. The “release threshold” is minimum levels for the first data release at one year from launch. The "standard" and "research" accuracies correspond to full and extra success criteria of the mission. Accuracies are basically shown by RMSE.
Radiance data notes:
*3. Absolute error is defined as offset + noise; relative error is defined as relative errors among channels, FOV, and so on. Release threshold of radiance is defined as estimated errors from vicarious, onboard solar diffuser, and onboard blackbody calibration because of lack of long-term moon samples
Atmosphere notes:
*4. Vicarious val. on sea-surface temperature and comparison with objective analysis data *5. Inter comparison with airplane remote sensing on water clouds of middle optical thickness
*6. Release threshold is defined by vicarious val. with other satellite data (e.g., global monthly statistics in the mid-low latitudes) *7. Comparison with cloud liquid water by in-situ microwave radiometer
*8. Comparison with optical thickness by sky-radiometer (the difference can be large due to time-space inconsistence and large error of the ground measurements) *9. Comparison with in-situ observation on monthly 0.1-degree
*10. Estimated by experience of aerosol products by GLI and POLDER Land data notes:
*11. Defined with land reflectance~0.2, solar zenith<30deg, and flat surface. Release threshold is defined with AOT@500nm<0.25 *12. Night time 250m product can be produced by special observation requests of 1.6µm channel
*13. Evaluate in semiarid regions (steppe climate, etc.)
*14. Fires >1000K occupying >1/1000 on 1km pixel at night (using 2.2um of 1 km and thermal infrared channels) Cryosphere notes:
APPENDIX 2
OVERVIEW OF
THE GLOBAL PRECIPITATION MEASUREMENT (GPM)
AND
THE TROPICAL RAINFALL MEASURING MISSION
(TRMM)
2-2
1. Introduction
“Precipitation” is one of most important environmental parameters. Changes in its amount and distribution may affect our everyday life, and they may cause serious damages to human lives and properties. Too much precipitation causes floods, and too less of it causes droughts. Agricultural production depends on precipitation. It is one of the three foremost weather prediction variables along with temperature and wind. Precipitation is a true global variable that determines the general circulation through latent heating, which is an "engine" for circumglobal winds, and reflects climate changes. It is a key component of air-sea interaction and eco-hydrometeorological modeling.
Although there is no doubt that precipitation is such an important component of our environment, it is one of the least known physics components of cloud, weather and climate prediction models. Because of its large variability in space and time, its distribution over the globe is not accurately known. Knowledge of the spatial and temporal distribution of global precipitation is a key to improving our understanding of weather and climate systems.
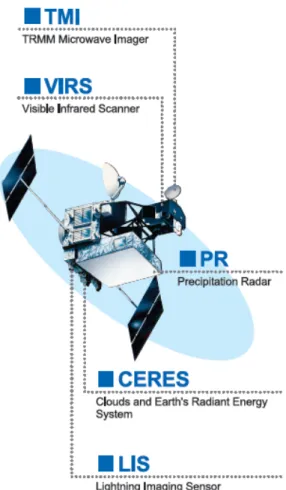
The Tropical Rainfall Measuring Mission (TRMM) satellite, which is still flying and archiving tropical/subtropical rainfall data more than 11 years, is a joint Japan-US mission. TRMM, launched in the end of November 1997 by the Japanese H-II rocket, focuses on measuring tropical/subtropical rainfall and their diurnal variations, and covers latitude from 35S to 35N. TRMM has three precipitation sensors: the Precipitation Radar (PR), the world first space-borne precipitation radar developed by Japan, and the TRMM Microwave Imager (TMI) and the Visible Infrared Scanner (VIRS) developed by the U.S., which enables observation of rainfall structures by multiple sensors, simultaneously.
Because of the success of the TRMM satellite, several requirements for the successor mission emerged from the science and operational user community. The Global Precipitation Measurement (GPM) mission was proposed to fulfill those requirements. GPM is a satellite program to measure the global distribution of precipitation accurately in a sufficient frequency so that the information provided by this program can drastically improve weather predictions, climate modeling, and understanding of water cycles. Its feasibility has been studied at Goddard Space Flight Center of the National Aeronautics and Space Administration (NASA) and the Japan Aerospace Exploration Agency (JAXA). Accurate measurement of precipitation will be achieved using the Dual-frequency Precipitation Radar (DPR) installed on the GPM Core Observatory. The DPR on the GPM Core Observatory is being developed by JAXA and the National Institute of Information and Communications Technology (NICT).
2. The Tropical Rainfall Measuring Mission (TRMM)
The Tropical Rainfall Measuring Mission (TRMM) satellite (Figure 1) was launched by H-II rocket No. 6 in November 1997, and completed its mission in April 2015.
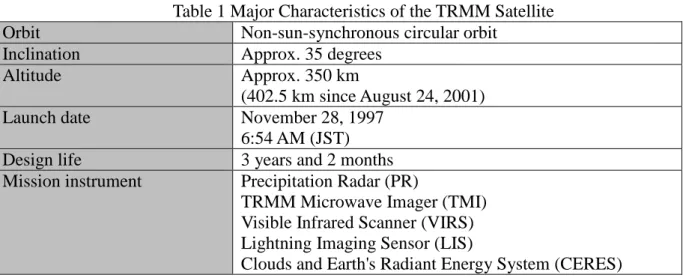
Major characteristics of the TRMM satellite are described in Table 1. TRMM is joint mission between Japan (JAXA (former NASDA) and NICT (former CRL)) and the U.S. (NASA). The major objective of TRMM is to determine accurate rainfall amount associated with tropical convective activities, which is a drive source of global atmospheric circulation. To this purpose, the TRMM satellite focuses on rainfall observation, and carries the world's first satellite-borne Precipitation Radar (PR) developed by Japan, in addition to conventional instruments such as infrared imager and microwave imager (TRMM Microwave Imager: TMI). The combination use of PR and TMI has greatly improved the estimation of rainfall amount and has succeeded in observing climate changes, as with El Niño and La Niña. Since the three-dimensional structure of rainfall over the land and ocean can be derived from PR, TRMM has also revealed the three-dimensional structure of typhoons over the ocean, which was rarely observed before TRMM. The success of TRMM shows the potential of satellite remote sensing contributions for understanding the water cycle on Earth and improving weather forecasts.
tropical rainfall that has large diurnal variation, it flies in non-sun-synchronous orbit with an inclination angle of 35°. Although the designed lifetime of the satellite was about 3 years, the satellite altitude was boosted from 350 km to 402.5 km in August 2001 to extend the lifetime by reducing atmospheric drag. In March 2009, more than 11 years after the satellite’s launch, it continues its excellent observation and provides valuable meteorological and climatological data relating to precipitation, through long-term observation of the current status of rainfall in the tropics and sub-tropics, for understanding water cycle mechanisms.
2-4
Table 1 Major Characteristics of the TRMM Satellite Orbit Non-sun-synchronous circular orbit
Inclination Approx. 35 degrees
Altitude Approx. 350 km
(402.5 km since August 24, 2001) Launch date November 28, 1997
6:54 AM (JST) Design life 3 years and 2 months Mission instrument Precipitation Radar (PR)
TRMM Microwave Imager (TMI) Visible Infrared Scanner (VIRS) Lightning Imaging Sensor (LIS)
Clouds and Earth's Radiant Energy System (CERES)
3. The Global Rainfall Measurement (GPM) 3.1 From TRMM to GPM
As accuracy of satellite precipitation estimates improves and observation frequency increases, application of those data to societal benefit areas, such as weather forecasts and flood predictions, is expected, in addition to research of precipitation climatology to analyze precipitation systems. There is, however, limitation on single satellite observation in coverage and frequency. Therefore, the Global Precipitation Measurement (GPM) mission was proposed under international collaboration to fulfill various user requirements that cannot be achieved by the single TRMM satellite.
One major characteristic of GPM as follow-on and expansion of TRMM is to operate the GPM Core Observatory, which carries an active precipitation radar and a passive microwave radiometer, with a non-sun-synchronous orbit as a calibrator to other satellites. The other is a collaboration with a constellation of several satellites developed by each international partner (space agency) that carries passive microwave radiometers and/or microwave sounders, to increase observation frequency. Although the TRMM satellite focused on observation of the tropics, the GPM mission covers broader areas, including high latitudes.
3.2 Concept of the GPM Mission
TRMM is single satellite mission for scientific research. On the other hand, the GPM mission (Fig. 2) is an international mission to achieve high-accurate and high-frequent rainfall observation over a global area. GPM is composed of a TRMM-like non-sun-synchronous orbit satellite (GPM Core Observatory) and multi-satellites carrying microwave radiometer instruments (constellation satellites). The GPM Core Observatory carries the Dual-frequency Precipitation Radar (DPR), which is being developed by JAXA and NICT, and the GPM Microwave Imager (GMI) provided by NASA, and will achieve more accurate but narrower observation as a calibrator to other constellation satellites. Constellation satellites, which carry a microwave imager and/or sounder and are planned to be launched around 2014-2018 by each partner agency for its own purpose, and will contribute to extending coverage and increasing frequency. To take over the results that have been achieved by TRMM and to facilitate development of those results, the GPM mission is planned to meet user requirements that cannot be achieved by TRMM or are expected to be improved in GPM: 1) expansion of observation coverage; 2) increase of observation frequency; and 3) improvement of observation accuracy.
Figure 2 Overview of the GPM Mission
3.3 Overview of the GPM Core Observatory
The GPM Core Observatory (Table 2 and Figure 3), which is being jointly developed by Japan and the U.S., was launched in February 2014. The core satellite carries a Dual-frequency Precipitation Radar (DPR) developed by Japan, and a GPM Microwave Imager (GMI) developed by U.S. The orbit of the core satellite is non-sun-synchronous with an inclination angle of 65º. This orbit was selected to meet certain requirements, such as to measure diurnal variation of rainfall in mid- and high-latitudes as well as the tropics for around 2 months.
Table 2 Major Characteristics of the GPM Core Observatory
Orbit Non-sun-synchronous
Inclination 65 degrees
Altitude 407 km
Launch date February 28, 2014 03:36 AM (JST) Mission life 3 years (target: 5 years)
Mission instrument Dual-frequency Precipitation Radar (DPR) GPM Microwave Imager (GMI)
The Dual-frequency Precipitation Radar (DPR) on board the GPM Core Observatory is composed of two radars: a Ku-band (13.6-GHz) Precipitation Radar (KuPR) and a Ka-band (35.5-GHz) Precipitation Radar (KaPR). KaPR aims at sensitive observation, and can detect weaker rainfall and snowfall that cannot be measured by KuPR. Since KuPR can detect heavier rainfall, simultaneous observation of
Core Satellite
Objective:
Understanding the horizontal and vertical structure of precipitation system
Drop size distribution measurement Improvement of precipitation rate
accuracy with constellation satellites • DPR (JAXA, NICT) (13.6, 35.5GHz) • GMI (NASA)
• Launch in early 2014 by H-IIA
• Non-Sun-synchronous orbit, inclination: 65deg., altitude: 407 km
Constellation Satellites
Objectives:
Observation frequency Science, social applications • Cooperation with constellation
satellite providers; JAXA, NOAA, ISRO/CNES, etc. • 3 hourly observation of 80% of
the globe.
• Launch around 2014 by each organization
• Mainly sun-synchronous orbit with altitude 600~800 km
• Generation and dissemination of global map of precipitation rate with high frequency and accuracy
• Various applications such as weather, flood forecast, agriculture, etc.
2-6
simultaneously by dual-frequency, size of precipitation particles (raindrop size distribution) can be estimated by differences in precipitation attenuation. This information cannot be obtained by single-frequency radar, such as TRMM’s PR, and will improve accuracy of precipitation estimation. It is also expected to identify rainfall and snowfall by using differences in precipitation attenuation for dual-frequency.
The GPM Microwave Imager (GMI) instrument on board the GPM Core Observatory is a multi-channel conical-scanning microwave radiometer developed by NASA, and it is based on the TMI on board the TRMM satellite. The major role of the GMI is to improve accuracy of rainfall/snowfall estimates by simultaneous observation with the DPR, and to work as a bridge between highly accurate observation by the core satellite and frequent observations by the constellation satellites. GMI is also expected to serve as a 'radiometric standard' for the other microwave radiometers on board the GPM constellation satellites, and to reduce differences in rain rate estimation arising from biases of instruments. The GMI is characterized by thirteen microwave channels ranging in frequency from 10 GHz to 183 GHz. In addition to carrying channels similar to those on the TRMM Microwave Imager (TMI), the GMI carries four high frequency, millimeter-wave, channels of about 166-GHz (‘window’ channel) and 183-GHz (water vapor channel). Addition of those high frequency channels is expected to contribute to improvements in accuracy of weak rainfall and snowfall estimates, especially over the ocean and land in high-latitudes. With a 1.2 m diameter antenna, the GMI will provide significantly improved spatial resolution over TMI. The roles of the GPM primary satellite are to collect as much microphysical information as possible for accurate rain estimation by performing synchronous observation with the GMI and the DPR and to provide calibration standards for the other microwave radiometers on the constellation satellites.
3.4 Collaboration with Constellation Satellites
In the case of low orbital satellites, such as TRMM and Aqua, single-satellite cannot observe frequently at each local point. To overcome this weakness and achieve frequent observation, the GPM mission will work with other satellite missions in the world. Figure 4 shows how the observation area covered in 3 hours by microwave radiometers on polar-orbiting satellites increases with the number of satellites. As the number increases, the coverage for a given time increases, and hence the sampling interval at a given point decreases. In the GPM era, eight sun-synchronous polar-orbiting satellites enable global observation of precipitation every 3 hours. In the GPM era, one primary satellite and eight constellation satellites will produce 3-hour global precipitation maps that will be delivered to users in near real time.
Constellation of several satellites developed by each international partner (space agency) will carry passive microwave radiometers and/or microwave sounders and be in operation around 2014-2018. The DPR and GMI instruments on board the core satellite will serve as a ‘calibrator’ for data obtained by constellation satellites.
3-1
APPENDIX 3
OVERVIEW OF
THE EARTH CLOUD, AEROSOL AND RADIATION
EXPLORER (EarthCARE) MISSION
1. Introduction
1.1 Cloud and Climate Change
Since the last report of IPCC (Third Report), the level of scientific understandings regarding the effect of aerosols and clouds, show a good progress. From the most recent report (Fourth Assessment Report; FAR), carbon dioxide is said to be the largest factor to the influence of the global warming. However, the effect of carbon dioxide to the global warming is considered to have been evaluated with a good accuracy. On the other hand, the radiative forcing of clouds and aerosols still remains as the dominant uncertainty in the prediction of the climate change in the future. It is reported that -0.5 W/m2 for aerosol direct effect and -0.7 W/m2 for cloud albedo effect,
-1.2 W/m2 as total aerosol, are counted for radiative forcing relating with aerosol/cloud. The figure is
large enough comparing with the total anthropogenic radiative forcing; +1.6 W/m2. We have to
make a special attention to the fact that the uncertainty of the cloud albedo effect, i.e. interactions between aerosol and cloud, is very large; 2 W/m2. This leads, without the correct understanding of
the interaction between aerosol and cloud, climate change to remain uncertainties to predict future status with sufficient accuracy.
Furthermore, FAR suggests that the cloud life cycle process should be examined not just for cloud forming but also for the precipitation process or cloud termination process, which will affect global radiation budget through latent heat release and changing the radiative characteristics of the ground surface by such as snowing (IPCC, 2007).
1.2 EarthCARE mission and instruments
Japanese Aerospace Exploration Agency (JAXA), National Institute of Information and Communications Technology (NICT) and European Space Agency (ESA) are going to materialize a project named “Earth Cloud, Aerosol and Radiation Mission; EarthCARE”. EarthCARE is a challenging mission toward to solve the issues noted in the previous section. The observation scope of the EarthCARE is to observe globally such processes; the aerosol distribution, cloud forming with aerosol interaction and beginning of precipitation. To materialize such observation, four instruments were chosen, with their respective needs, to load on EarthCARE; LIDAR (light detection and ranging) and Doppler Radar for the aerosol/cloud profile observation, multi spectral imager (MSI) for aerosol/cloud lateral distribution observation and broadband radiometer (BBR) for Earth radiative flux observation. The observations by these instruments guarantee their synchronism and their uniformity in the observation region. In other word, more accurate synergy observations are preserved, by minimizing the differences in the condition of the observations between the instruments, resulted from such as the differences in the timing of the observation. The relationship between target geophysical parameters and instruments is shown in figure 1. The final goal of the mission is to reconstruct aerosol cloud structure with their physical characteristics with the accuracy of 10 W/m2 as radiative flux at top of atmosphere (ESA,2004, Gelsthorpe et.al., 2008).
3-3
Figure 1 Relationship between target geophysical parameters and instruments
The outlook of EarthCARE satellite and CPR are shown in figure 2. A sun synchronous orbit was chosen as the observational orbit to cover all region of the Earth. Local time at equator of the orbit is 13:45 to 14:00 with consideration of cloud processes being active in the afternoon.
To get the accurate aerosol/cloud observation data, several unique points are implemented for instrumentation. The LIDAR is an Ultra Violet range single wavelength High Spectral Resolution LIDAR. The wavelength, 355 nm, has well sensitivity for the small aerosol particles that are missed by Radar, and make high transmit power possible for its eye safe character. It is possible for the LIDAR signals to be strongly attenuated when they meet dense regions composed by large particles such as clouds. High spectral resolution enables to receive Mie and Rayleigh scattering signals independently. In this way, the optical properties of aerosols can be retrieved directly, without an assumption of liar ratio. Through its polarization measurement, the depolarization ratio can be calculated to estimate the nonsphericity of the observed particle. Doppler W-band Radar penetrates thick cloud layers. Doppler measurement function distinguishes cumulus / convective cloud types and its particle status inside of cloud layer. Using Doppler value, we precisely know kinds of cloud particles. The detailed description of the Doppler Radar is noted in Section 2.1. The MSI has 7 channels with their central wavelengths to be 0.67, 0.865, 1.65, 2.21, 8.8, 10.8 and 12.0 µm, respectively. These channels will be used with split window method to get optical depth and effective radius of cloud and aerosols. Thermal infrared channel can be used to retrieve the cloud top height. The ground resolution of MSI is 500 m2 and the swath width is 150 km. BBR
design is a heritage of past Earth Radiation Mission, such as ERBE or CERES. BBR has two channels; one for the observing shortwave (0.25 ~ 4µm) and the other for longwave (4 ~ 50µm). Three angle radiometer will be used for flux determination considering its angular distribution. The effect of cloud forcing by the reflection of sunlight as well as by its emittance of longwave radiation are expected to be evaluated from the BBR observation. General characteristics for all four instruments are shown in Table 1.
Figure 2. Outlook of CPR and EarthCARE satellite
Table 1 General characteristic of instruments Instrument Description
CPR 94 GHz Doppler Radar (see Table 2.)
ATLID 355 nm Hyper Spectral Resolution Lidar with three channels (Mie co-polar, Rayleigh, Mie cross-polar)
MSI
Push broom imager
Resolution 500m, swath 150 km
Seven channels (0.67, 0.865, 1.65, 2.21, 8.8, 10.8, 12.0 micron)
BBR Three views radiometer Angle: Nadir, +- 55 deg
3-5 4. Doppler Cloud profiling RADAR
The new space borne radar; Cloud Profiling Radar (CPR) is going to be developed in the cooperation between JAXA and NICT. From CPR observational requirements, we identified following design requirements. First point is the high sensitivity. This requirement is divided into large antenna size requirement, low noise figure of receiver requirement and high power of transmitter requirement. Second point is the Doppler capability. To materialize this function with satisfactory accuracy, large diameter of antenna with precise surface figure and high pulse repetition frequency (PRF) are required. To keep accuracy especially at boundary layer region, several other fine characteristics, such as side lobe characteristics of antenna, cross polarization characteristics and so on, are also required for CPR design.
As the result of design, we chose pulse pair scheme for Doppler measurement. In addition, the diameter of antenna was set as 2.5 m considering the limited diameter of launcher fairing. For transmitter, we employed improved Extended Interaction Klystron (EIK), of which original model is already employed for CloudSAT mission by NASA (Stephens et.al., 2002). The transmit power is 1.5 kW at end of three year mission. For PRF design, CPR has variable control capability of PRF with satellite altitude information. This is for maximizing frequency to keep good coherency between radar pulses, also good sensitivity by having much integration. Outlook of CPR is shown in Figure 2 and major specification of CPR is shown in Table 2.
However, the PRF is a factor of trade off between observational heights. Considering the natural cloud height distribution, the planned operation of CPR is to change observational height with latitude. As natural cloud height distribution, for low latitude region, the cloud height is rather high; in contrast, the polar region cloud height is rather low. The image of CPR operation is shown in Figure 3.
Table 2. General Specifications of CPR
Item Specification
Radar Type 94 GHz Doppler Radar Center frequency 94.05 GHz
Pulse width 3.3 micro second (equivalent to 500m vertical resolution) Beam width 0.095 deg
Polarization Circular
Transmit power > 1.5 KW (Klystron spec.) Height range -0.5 ~ 20 km
Resolution 500 m (100 m sample); Vertical 500 m integration; Horizontal Sensitivity* -35 ~ +21 dBZ Radiometric accuracy* < 2.7 dB Doppler range* - 10 ~ +10 m/s Doppler accuracy* < 1 m/s Pulse repetition frequency Variable; 6100 ~ 7500 Hz Pointing accuracy < 0.015 degree
Figure 3. CPR Operation Image
5. Operation Planning
EarthCARE is planned to be launched in JFY2015. The calibrated engineering parameters (Level 1 data) and the retrieved physical parameters (Level 2 data) by all four sensors on EarthCARE will be stored and distributed from both JAXA and ESA. Data are planned to be used by research institutes and agencies in order to improve the accuracies of numerical weather/climate models. The data are also opened to researchers (after appropriate procedures), and are used in the analysis of radiation/aerosol/cloud/precipitation process.
REFERENCES
EarthCARE – Earth Clouds, Aerosols and Radiation Explore Mission Report, ESA SP-1279(1).2004, available from http://esamultimedia.esa.int/docs/SP_1279_1_EarthCARE.pdf
RV. Gelsthorpe, A. Heliere, A. Lefebvre, J. Lemanczyk, E. Mateu and K. Wallace, “EarthCARE and its payload”, Proc. SPIE, Vol. 7152, 2008
T. Kimura and H. Kumagai, “Japanese Cloud Profiling RADAR for EarthCARE”, Proc. 26th ISTS, Hamamatsu 2008
T. Kimura, H. Nakatsuka, K. Sato, Y. Sakaide , Y. Seki , K. Okada, N. Takahashi , Y. Ohno , H. Horie, “EARTHCARE MISSION WITH JAPANESE SPACE BORNE DOPPLER CLOUD RADAR; CPR”, Proc. ISPRS Technical Commission VIII symposium, 2010.
4-1
APPENDIX 4
OVERVIEW OF
THE ADVANCED LAND OBSERVING SATELLITE-2
(ALOS-2) MISSION
1. Introduction
The Advanced Land Observing Satellite-2 (ALOS-2) is succeeding to the radar mission of ALOS which had contributed to cartography, regional observation, disaster monitoring, and resources surveys.
ALOS-2 is equipped with a SAR antenna just under its body and with two solar array paddles at both sides, as shown in Figure 1. The observation data is transmitted directly to a ground station via X-band or through inter-satellite communication via Ka-band. The transmission speed is 800 Mbps maximum for X-band and 278 Mbps for Ka-band, respectively. Table 1 shows system specifications of ALOS-2. The local sun time of it orbit is at noon in order to complement other SAR satellites which are in dawn-dusk orbits.
Fig. 1 ALOS-2 in-orbit configuration
Table 1 ALOS-2 specification
Observation mode Stripmap: 3 to 10 m resolution, 50 to 70 km swath ScanSAR: 100 m/60 m resolution, 350 km/490 km swath Spotlight: 1×3m resolution, 25 km swath
Orbit Sun-synchronous sub-recurrent orbit Altitude: 628 km
Local sun time : 12:00 +/- 15 min Revisit: 14 days
Orbit control: < +/-500 m
Launch May 24, 2014 (JST), H-IIA launch vehicle Life time 5 years (target: 7 years)
Satellite mass Approx. 2 tons
Downlink X-band: 800 Mbps (16QAM), 400/200 Mbps (QPSK) Ka-band: 278 Mbps (QPSK)
2. PALSAR-2 Characteristic
ALOS-2 carries the state-of-the-art L-band Synthetic Aperture Radar (SAR) called PALSAR-2. PALSAR-2 has a Spotlight mode (1×3m resolution in Az×Rg), a Stripmap mode (3 to 10 m resolution) and a ScanSAR mode. The Spotlight mode and a high resolution mode will allow providing users with more detailed data than ALOS/PALSAR. The ScanSAR mode will allow us to acquire a 350 to 490 km width (depends on number of scans) of SAR images at the expense of spatial resolution. The observation frequency of ALOS-2 will also be improved by greatly expanding the observable areas (2,320km). Right-and-left looking function by satellite maneuvering and electric beam steering using active phased array antenna establish the incidence angles from 8 to
4-3
Fig. 2 PALSAR-2 observation modes
Table 2 PALSAR-2 specification
Observation mode Spotlight Stripmap ScanSAR
Ultra-Fine High-Sensitive Fine Incidence angle 8 to 70 degrees
Band width 84 MHz 84 MHz 42 MHz 28 MHz 14 MHz/28 MHz* Ground resolution 3 m x 1 m
(Rg x Az)
3 m 6 m 10 m 100 m (60 m)
Swath 25 km 50 km 50 km 70 km 350 km (490 km)
Polarization Single Single/Dual Single/Dual/ Full/Compact Single/Dual/ Full/Compact Single/Dual NESZ -24 dB -24 dB -28 dB -26 dB -26 dB/-23 dB S/A Rg 25 dB 25 dB 23 dB 25 dB 25 dB (20 dB) Az 20 dB 25 dB 20 dB 23 dB 20 dB
The parameters specified at 37degrees incidence angle above the equator. * 28 MHz bandwidth in ScanSAR mode is used for only 350 km swath
PALSAR-2 is composed of two subsystems; Antenna subsystem (ANT) and Electric Unit (ELU). ANT is an active phased array antenna, which steers a beam both in elevation and azimuth direction (plus-minus 30 degrees in elevation and plus-minus 3.5 degrees in azimuth). Figure 3 shows the antenna configuration of PALSAR-2. The size of ANT is 10 m in azimuth and 3 m in elevation, and is composed of five electrical panels, which have 180 Transmit-Receive-Modules (TRMs) in total. The Spotlight mode and Ultra-Fine mode use the three of five panels to satisfy resolution requirement and the other modes use all panels. The transmitted power is 3950 W and 6120 W respectively.
Figure 4 shows the system diagram of PALSAR-2. Key components of the Electric Unit (ELU) are Exciter (EX), Transmitter (TX), Receiver (RX), Digital Processor (DP), and System controller (SC). As for RF signal, EX generates pulses, selects two chirp signals (up or down and phase modulation) with a selected center frequency either 1257.5, 1236.5 or 1278.5 MHz in order to avoid interference to Radio Navigation Satellite Services which use L-band, and stretches the signal to a selected bandwidth either 84 MHz, 42 MHz, 28 MHz or 14 MHz. Received radar echo signals are compressed by BAQ or DS-BAQ algorithm. Compression mode is selected from 4 bit, 2 bit, or no compression.
Fig. 3 PALSAR-2 antenna configuration
Fig. 4 PALSAR-2 system diagram 3. ALOS-2 Data Products
3.1 Definition of ALOS-2 Data Products
Two categories of data products are defined - level 1 product and higher level products. 3.1.1 Level 1
Level 1 is radiometrically and geometrically calibrated data and is a standard JAXA product for ALOS-2 users. 3.1.2 Higher-level data product
Products above level 2 are higher-level data products. Higher-level data products are made more sophisticated by processing with digital elevation models. This is provided by JAXA's EORC as soon as ready.
3.2 Standard Data Products
Table 3 PALSAR Standard data products
Level Definition Note
1.1 Range and azimuth compressed complex data on slant range. Full resolution
Beam modes: Full resolution mode, Low data rate mode, Polarimetric mode
SLC: Single Look Complex Used for interferometry
1.5 Multi-look processed image projected to map coordinates.
Option
G: Systematically Geo-coded (No option: Geo-referenced)
Map projection Resampling Pixel spacing
2.1 Ortho-rectified and slope corrected products Map projection
command and telemetry from/to satellite SC DP TX RX EX SAR ANT I/F Unit* TRM TRM ・ ・ ・ ・ ・ 180EA for cal
*: Dual receive antenna system is seleceted at I/F Unit mission data
4-5 4 ALOS-2 Operation Concept and Observation Strategy
ALOS-2 is operated based on the Basic Observation Scenario-2 (BOS-2) that is optimized as the background mission while the emergency observation is the highly prioterized operation for the disaster mitigations. The BOS-2 is open to the public through ALOS-2 i.e. http://www.eorc.jaxa.jp/ALOS/en/top/obs_top.htm
The BOS-2 is designed to achieve the Earth observation using the several modes of the PALSAR-2, i.e. high resolution strip mode (84 MHz-singe polarization), Dual polarization mode (42 MHz-Dual Polarization), Quad-mode (42 MHz-Full polarization), Dual Strip (28 MHz), and ScanSAR (14 MHz-Dual-350 Km /490 Km swath) for observing the solid earth (deformation study), biosperic study (forest monitoring, carbon estimation) and Cryospheric study (sea-ice, polarer monitoring), and map generation.
APPENDIX 5
5-2 目次 1. 課題分野研究とは ... 3 2. 各課題分野研究 概要 ... 4 2.1. 海洋環境監視 ... 5 2.2. 水循環・水資源管理 ... 7 2.3. 大気環境物質監視 ... 8 2.4. インフラ変位モニタ ... 11 2.5. 気候システム・放射過程 ... 13 2.6. 生態系 ... 15 2.7. 農業 ... 17 2.8. 公衆衛生 ... 19
1. 課題分野研究とは 「課題分野研究」とは、ひまわり8号等のJAXA以外の衛星のデータも含め、衛星データを複 合的に用いて、あるいは、衛星データ解析技術以外のモデリング技術や同化技術など複数の技 術分野を横断的に利用して、課題を解決しようとする利用研究です。 (1) 課題分野研究が目指す方向性 ① 衛星データと地球環境モデリングの融合 地球観測衛星はこれまで災害監視や地球環境のモニタリングに大きく貢献してきましたが、 今後はこれらに加えて、我々の社会にとって解決すべき地球温暖化や地球環境変化への対応と してグローバルな地球観測データの高度利用をさらに進めて行く必要があります。そのために は、地球環境全体として変化して行く過程を予測する必要があり、そのような過程をシミュレ ーションできる地球システム統合モデルや環境モデルの開発が各方面で進められていますが、 その実施には様々な長期的な衛星観測データが不可欠となっています。また、科学技術イノベ ーション総合戦略2015においても、地球環境観測・予測技術を統合した情報プラットフォーム の構築【総務省、文部科学省、国土交通省、環境省】が謳われています。 ② 地球科学と社会利用の両輪としての地球観測 地球観測は、その本来の特性から、ひとつのミッションで地球科学と社会利用の両面に波及 効果をもたらすものであります。従って、地球科学と社会利用のミッションを切り離して議論 することは、地球観測が本来持っている両面性に鑑みて、極めて非効率な事態を生み出すと考 えられます。むしろ、両者がシナジー効果を生み出しつつ発展することが戦略的に有効であり ます。従って、課題分野研究では、ゴールとして社会利用のみを追求するのではなく、同時に 地球科学の発展も目指すものであります。
5-4 (2) 課題分野研究一覧 以下に、EORCで行う課題分野研究と利用する衛星データのマトリックスを示します。JAXA では、各衛星ミッションと、地球観測研究センター(EORC)、衛星利用運用センター(SAOC) が連携して衛星地球観測とその活用を行っています。EORCが主に担当する部分を黄色で示し ています。 衛星 研究分野 ALOS-2 GPM/ TRMM Earth CARE GCOM GOSAT ひま わり 防災利用 ○ 海洋監視 ① 船舶監視 ○ ○ ② 環境監視 ○ ○ ○ 水循環・水資源管理 ○ ○ ○ 大気環境物質監視 ○ ○ ○ ○ インフラ変位モニタリング ○ 気候システム・放射過程 ○ ○ ○ ○ ○ 生態系 ○ ○ ○ ○ ○ 農業 ○ ○ ○ ○ 公衆衛生 ○ ○ ○ ○ 2. 各課題分野研究 概要 各課題分野研究の概要を次ページ以降に示します。
2.1. 海洋環境監視 海洋環境の変化は、日々の気象現象や漁場の変化のみならず、大規模な大気循環場や気候システム、 海洋生態系にも影響を及ぼしています。さまざまな観測データから海面水温、海氷、クロロフィル a 濃 度(植物プランクトンが持つ光合成色素)、光合成有効放射(植物の光合成に使われるのに有効な太陽 光)などのプロダクトを開発し、データや画像を研究者や一般利用者に提供しています。海洋モデルと の連携により衛星観測の欠測を埋め、衛星から直接観測できない物理量を含めた、連続的な海洋環境デ ータセットを作成し、気候研究や漁業などの現業利用の両面に貢献することを目指しています。 ■ マイクロ波放射計による長期的な全天候観測 ー北極海海氷監視 雲を透過して、その下の海氷分布や海面水温を観測可能なマイクロ波放射計は、1978 年以降複数センサ で観測を継続することで、気候変動の影響把握に重要な情報を提供しています。北極海氷面積の長期間 (1978/11~2016/1)の継続観測(a)により、2007 年 9 月に地球観測衛星「Aqua」の AMSR-E センサが 観測史上 2 番目(c)、2012 年 9 月に水循環変動観測衛星「しずく」(GCOM-W)の AMSR2 センサが史上 最小の面積(d)を観測しました。 ■ 静止衛星による高頻度観測 2015 年 7 月に運用を開始した静止気象衛星「ひまわり 8 号」は、0.5~2km の空間分解能で、10 分毎に フルディスクの観測を行っています。JAXA では「ひまわり 8 号」から高頻度の海面水温(e)やクロロ (e) ひまわり 8 号に よる海面水温の観 測 マイクロ波放射計による北 極海における海氷面積変化 (1978/11~2016/1) (f) ひまわり 8 号によ るクロロフィルの観 測 (g) ひまわり 8 号が観測した 海面水温を 3km 分解能日本南 岸モデルにデータ同化した結 果(2015 年 12 月 16 日) (h) MODIS センサが観測した 海面水温を 11km 分解能日本 南岸モデルにデータ同化した 結果(2015 年 12 月 16 日 (a) (b) (c) (d)
5-6
2.2. 水循環・水資源管理 人々の活動がグローバル化する中、近年頻発している気象・気候の変動による洪水・干ばつ等は、 局所的な事象ではなく、地球全体に影響を及ぼしています。地球規模で水循環のモニタリングを行 い、衛星観測データと陸面の数値モデルを組み合わせて、水・食糧・災害等の問題への対応の鍵と なる物理量(河川流量や土壌水分など)を推定し、危険指標などを利用しやすい情報(水循環デー タセット)として、提供しています。生態系情報と統合するなどの解析を進め、100 億人の水と食 料需要を満たすための対策の提言を目指しています。 ■ 全球 0.5 度格子陸面シミュレーションシステムの構築 ー土壌水分量 河川流量予測 河川流量確率指標 モデル降水量 これまで 1 度(約 100km)格子だったシス テムを、陸面モデルについては 0.5 度(約 50km)、河川モデルについては 0.25 度(約 25km)格子に高解像度化しました。中規模 河川の水災害把握に向けて、河川流量や氾 濫面積割合の評価を進めています。 空間解像度を 10km からより詳細な 1km にす ることにより、 世界的にもまだ達成できて いない、ローカルスケールの水災害把握が可 能な陸域モデルを構築しました。国内一級河 川の水災害把握に向けて、衛星と複合した水 循環データセット及び危険指標の提供を進 めています。 東京大学/芳村准教授提供。Today’s Japan(10km 格子)での シミュレーション結果
■ 全球合成降水マップ(GSMaP)just now version (GSMaP_NOW)」の開発と公 開 http://sharaku.eorc.jaxa.jp/GSMaP_NOW/index_j.htm 静止気象衛星「ひまわり」の観測範囲内で、観測 から 30 分以内に利 用可能なマイクロ波放射計デ ータ(主に、GMI センサ、日本付近の AMSR2 セ ンサ、AMSU 直接受信データ)だけを利用して降 雨分布を作成しました。さらに静止気象衛星から 計算した雲移動ベクトルによる未来方向へ 30 分間 の外挿を行うことで、毎時 0 分、30 分頃に、「実 ■ 日本域の高解像度陸面シミュレーションシステムの検討 ー2015 年 9 月 9 日 15 時時点の鬼怒川氾濫の河川流量予測
5-8
2.3. 大気環境物質監視 ■ 人工衛星によるエアロゾルの観測 ■ 自然環境や人間生活に影響を及ぼす大気微 粒子エアロゾル 黄砂、PM2.5 等の大気汚染物質、火山灰、森林火災等によるエアロゾルは、視程の悪化、車や家 屋、農作物への付着、健康被害など人々の生活環境に影響を及ぼしています。さまざまな衛星観 測データからエアロゾルの光学的厚さ(どのくらい大気が濁っているか表す指標となる)やオン グストローム指数(エアロゾル粒子サイズの指標となる)を推定し、データや画像を研究者や一 般利用者に提供しています。外部機関と協力して衛星データをエアロゾル輸送モデルに組込むデ ータ同化システムを構築することにより、どこで発生したエアロゾルが、いつごろ、どこに、ど のくらいの濃度で飛来するかを予測するシステムの構築を目指しています。また、大気環境物質 監視課題では、エアロゾル発生源として重要な情報となる火災検知プロダクトの開発および雲の 発達検知に向けた雲プロダクトの開発も行っています。 2015 年 11 月 17 日に温室効果ガス観測技術衛星 「いぶき」(GOSAT)の TANSO-CAI センサが観 測した阿蘇山噴火の様子です。 2015 年 4 月 27 日に地球観測衛星「Aqua」に搭載された MODIS センサが観測したエアロゾル光学的厚さ。中国大陸からの森林火 災の煙が、東北地表上空を通過している様子がわかります。 ■ JAXA ひまわりモニタからのプロダクト提供 大気環境物質監視課題で開発したプロダクトを定 常的に処理し、JAXA ひまわりモニタ (http://www.eorc.jaxa.jp/ptree/index_j.html)からユ ーザへ提供するシステムを開発しています。
5-10
2.4. インフラ変位モニリング
に搭載の L バンド合成開口レーダ(PALSAR-2)の観測データを用いて、広域かつ定期的陸域観測技術衛星「だいち」(ALOS)・陸域観測技術衛星 2 号「だいち 2 号」(ALOS-2) に観測できる衛星 観測の特徴を活かした土木インフラの変位検出を行い、国や自治体が 実施する土木インフラ管理の高度化・効率化に資するための研究を行っています(図 a)。 JAXA では、基盤となる干渉 SAR 時系列解析アルゴリズム開発を含め、可視化が困難な 変動量推定手法の開発・検証を行っており、これまでに、解析で検出した港湾施設の変 状箇所確認(図 b)、河川堤防の沈下量の計測を行っています(図 c)。 ■ インフラ変位モニタ ■ 港湾施設の変状把握 画像の赤丸が、経年微小変化の大きい箇所を 抽出したもので、施設管理者より変状の可能 性が指摘されていた箇所と一致しました。 ■ 河川堤防の変状把握 衛星で広域の観測を定期的に行 うことで、要点検箇所となる変 状 箇所(赤丸)を抽出することが 可能 となり、実地で詳細点検を 行う箇 所の絞込みが可能とな ります。 *SAR 衛星:陸域観測技術衛星 「だいち」(ALOS)・陸域観測 技術衛星 2 号「だいち 2 号」 (ALOS-2) 土木業者による 詳細点 広域・定期的な SAR 衛星*での 一括スクリーニング (図a) (図b) (図c) ソナー(水中) 無人機(空中) SAR 解析結果 [m m /年 ] 0 5 10 15 衛星による干渉 SAR 時系列解析で沈下傾向を 定期的に把握し、管理者に情報提供することで 補修計画や点検計画の立案等の意思決定に役 現地写真 ALOSによる強度画像(白黒)と変動量(カラー)
5-12