Graduate School of Engineering and Science
Shibaura Institute of Technology
Thesis for the Degree of Doctor of Engineering
A Study on the Coding Techniques for Phase-Shift Pulse Brillouin
Optical Time Domain Analysis (PSP-BOTDA) Fiber Optic Sensor
March 2014
Division
Functional Control Systems
Student ID
NB11106
Name
Mohd Saiful Dzulkefly Bin Zan
Supervisor
Prof. Dr. Tsuneo Horiguchi
i
Contents
Abstract
vi
Chapter 1: Introduction
1
1.1
Research Introduction
1
1.2
The Proposal on Pump Pulse Coding in the BOTDA
2
1.3
Thesis Structure
3
References
4
Chapter 2: Spontaneous and Stimulated Brillouin Scattering
7
2.1
Introduction to Chapter
7
2.2
Nonlinear Wave Propagation
7
2.3
Spontaneous Light Scattering
9
2.3.1
Spontaneous Brillouin Scattering
9
2.3.2
Stokes Scattering
11
2.3.3
Anti-Stokes Scattering
12
2.4
Stimulated Light Scattering
13
2.4.1
Stimulated Brillouin Scattering (SBS)
13
2.4.2
The Physical Process of SBS
13
2.4.3
Formulation of the SBS Wave
14
References
17
Chapter 3: Literature Review on the Brillouin Scattering-based Sensing
Techniques
18
3.1
Introduction to Chapter
18
3.2
Brillouin Optical Time Domain Analysis (BOTDA)
18
3.2.1
Principles of BOTDA
18
3.2.2
Spatial Resolution
19
3.3
Pulse Pre-Pump BOTDA (PPP-BOTDA)
20
3.4
Differential Pulse-width Pair BOTDA (DPP-BOTDA)
20
3.5
Optical Differential Parametric Amplification BOTDA (ODPA-BOTDA)
21
3.6
Phase-Shift Pulse BOTDA (PSP-BOTDA)
21
3.7
Coded PSP-BOTDA
22
3.7.1
Coded Discrete-PSP-BOTDA
22
3.7.2
Coded Continuous-PSP-BOTDA
23
3.8
Brillouin Optical Correlation Domain Analysis (BOCDA)
24
ii
Chapter 4: Coding Techniques
26
4.1
Introduction to Chapter
26
4.2
Golay Complementary Pair (GCP)
26
4.2.1
The Employment of GCP in Coding the Pump Light of PSP-BOTDA
27
4.2.2
Signal-to-Noise Improvement Ratio (SNIR)
28
4.3
Walsh Codes
28
4.3.1
Encoding and Decoding with Walsh Codes
28
4.3.2
Signal-to-Noise Improvement Ratio (SNIR)
30
4.3.3
Example of Matrix Calculations Involved in Hadamard Transform
31
4.3.4
Robustness of Hadamard Transform Against the Amplitude Variation
31
4.4
Dual Golay Codes
33
4.4.1
Generating the Dual Golay Codes from Two GCPs
33
4.4.2
Dual Golay Codes Correlation (Mutual Correlation)
35
A. First Method to Perform Dual Golay Codes Mutual Correlation (Method I)
36
B. Second Method to Perform Dual Golay Codes Mutual Correlation (Method II)
37
4.4.3
Examples of Mutual Correlations
38
A. Example of Method I
38
B. Example of Method II
39
4.4.4
Signal-to-Noise Improvement Ratio (SNIR)
40
4.5
Combined Walsh and Golay Codes
41
4.5.1
Generation of Combined Walsh and Golay Codes
41
4.5.2
Signal-to-Noise Improvement Ratio (SNIR)
43
4.6
Dual Walsh Codes
44
4.6.1
Generating the Dual Walsh Codes
44
4.6.2
Signal-to-Noise Improvement Ratio (SNIR)
45
4.7
Conclusions of Chapter
45
References
45
Chapter 5: Analysis on the Electrical Signal Configuration for
Modulating the Pump Light of Coded Discrete-PSP-BOTDA
47
5.1
Introduction to Chapter
47
5.2
Coded Discrete-PSP-BOTDA
48
5.2.1
Lightwave Phase-Modulation with Golay Coded Electrical Signal
48
5.2.2
Coded Discrete-PSP-BOTDA Measurement System
48
5.3
Electrical Signal Configurations to Produce the Pump Light of Coded
Discrete-PSP-BOTDA
49
5.3.1
Conventional Electrical Signal Configuration
49
5.3.2
Proposed Electrical Signal Configuration
50
iii
5.4.1
Experimental Setup
51
5.4.2
Experimental Results
52
A. Using Conventional Electrical Signal Configuration
52
B. Using Proposed Electrical Signal Configuration
52
5.5
Conclusions of Chapter
54
References
54
Chapter 6: Analysis of Employing Walsh- and Golay Coded
Return-to-Zero (RZ) Pulses in the Coded Continuous-PSP-BOTDA
55
6.1
Introduction to Chapter
55
6.2
Pump Light Configuration of Coded Continuous-PSP-BOTDA
55
6.3
Analytical
Calculations
Involving
Walsh
Codes
in
the
Coded
Continuous-PSP-BOTDA
56
6.3.1
Encoding and Decoding with Walsh Codes
56
6.3.2
Spatial Resolution and Improvement in SNR (SNIR)
57
6.3.3
Brillouin Gain Spectrum (BGS)
58
6.4
Simulations
59
6.4.1
Simulation Setup
59
6.4.2
Results and Discussions
60
A. Pump Light Coding with Walsh Codes for T2=2ns
60
B. Pump Light Coding with Walsh Codes and Golay Codes for T2=1ns
61
6.5
Experiments
63
6.5.1
Experimental Setup
63
6.5.2
Results and Discussions
65
A. Measurement with Walsh Codes for T2=2ns
65
B. Measurement with Walsh Codes and Golay Codes for T2=1ns
66
C. Brillouin Gain Spectrum and Brillouin Frequency Shift Measurement
68
D. Further Discussion on the Comparison Between Walsh Codes and Golay Codes
69
6.6
Conclusions of Chapter
70
References
71
Chapter 7: The Employment of Dual Golay Codes in High Spatial
Resolution PSP-BOTDA for Improving the Signal-to-Noise Ratio (SNR) 72
7.1
Introduction to Chapter
72
7.2
Pump Light Configurations
72
7.3
Simulations
73
7.3.1
Simulation Setup
73
7.3.2
Results and Discussions
74
iv
B. Simulation Results for Condition B
76
C. Further Discussion on the SNR and the Brillouin Gain Spectrum (BGS)
78
7.4
Experiments
79
7.4.1
Experimental Setup
79
7.4.2
Results and Discussion
80
A. Experimental Results for Condition A
80
B. Experimental Results for Condition B
81
7.5
Conclusions of Chapter
84
Appendices
85
Appendix A
85
Appendix B
87
Appendix C
88
References
88
Chapter 8: Combined Walsh and Golay Codes PSP-BOTDA
90
8.1
Introduction to Chapter
90
8.2
Pump Light Configurations
90
8.3
Simulations
90
8.3.1
Simulation Setup
90
8.3.2
Results and Discussions
91
A. Assignment of Walsh Codes to NRZ Pulses and Golay Codes to RZ Pulses Case
91
B. Assignment of Walsh Codes to RZ Pulses and Golay Codes to NRZ Pulses Case
93
8.4
Experiments
94
8.4.1
Experimental Setup
94
8.4.2
Results and Discussion
94
A. Assignment of Walsh Codes to NRZ Pulses and Golay Codes to RZ Pulses Case
94
B. Assignment of Walsh Codes to RZ Pulses and Golay Codes to NRZ Pulses Case
96
8.5
Conclusions of Chapter
97
References
97
Chapter 9: Dual Walsh Codes PSP-BOTDA
99
9.1
Introduction to Chapter
99
9.2
Pump Light Configurations
99
9.3
Simulations
99
9.3.1
Simulation Setup
99
9.3.2
Results and Discussions
100
A. Coded Pulse Duration T2 = 2ns Case
100
B. Coded Pulse Duration T2 = 1ns Case
100
v
9.4.1
Experimental Setup
102
9.4.2
Results and Discussion
102
9.5
Conclusions of Chapter
103
9.5.1
Comparison with dual Golay codes (Simulations)
103
9.5.2
The Impact of L
discon Brillouin Signals (Preliminary Experiment)
103
References
104
Chapter 10: Analytical Study on the Measurement Performance of
BOTDA Employing Proposed Coding Techniques
105
10.1
Introduction to Chapter
105
10.2
Relationship Between SNR and the Error in BFS Measurement
105
10.3
Maximum Pump Power and Its Relationship with Nonlinear Effects
106
10.4
Pump Depletion Effects and Its Impact on Probe Power Limitation
107
10.5
Numerical Results of the SNR for BOTDA and Discussions
108
10.6
Conclusions of Chapter
115
References
116
Chapter 11: Conclusions and Future Works
118
11.1
Conclusions of Each Chapter
118
11.1.1
Chapter 4
118
11.1.2
Chapter 5
118
11.1.3
Chapter 6
118
11.1.4
Chapter 7
119
11.1.5
Chapter 8
120
11.1.6
Chapter 9
120
11.1.7
Chapter 10
121
11.2
Overall Conclusions on the Performance of Combined Codes Systems
121
11.3
Proposed Future Works
123
References
123
Research Publications
124
vi
Abstract
Brillouin scattering-based fiber optic sensing systems have attracted much attention because they allow the measurement of strain/temperature with high accuracy and sensitivity. Among them, Brillouin optical time domain analysis (BOTDA) is of interest due to its capability to measure distributed strain/temperature with high spatial resolution over long distance range, which is beneficial for the application especially in the field of civil engineering for structural health monitoring of large structure such as buildings, dams, bridges etc. BOTDA technique is based on the stimulated Brillouin scattering (SBS) process, which involves the process of optical energy conversion between pulsed pump light (pump) and counter propagating probe light (probe) via acoustical phonon that acts as mediator. In the SBS process, the optical energy is transferred from the pump to probe when the probe frequency is set lower than the pump frequency; this process is called Stokes scattering process. Maximum interaction is obtained when the frequency difference between the two lights coincides with the Brillouin frequency shift (BFS) that is in a function of local temperature/strain. Moreover, by scanning the frequency difference between the two lights within the BFS vicinity, the Brillouin gain spectrum as a function of distance can be constructed.
Numerous researches have been conducted to improve the BOTDA sensing parameters such as spatial resolution, signal-to-noise ratio (SNR) etc. This is because, at the early stage of development, the best spatial resolution obtained was 1m, with the use of pump pulse of duration 10ns. Shortening the duration to less than 10ns, which is around the time constant of the acoustic wave amplitude a for silica fiber could cause the Brillouin gain to decrease significantly
and consequently broadens the bandwidth of the Brillouin gain spectrum. Both the gain decrease and the bandwidth broadening make it increasingly difficult to measure the BFS accurately.
However, the idea of using pre-pump pulse in a technique called pulse pre-pump BOTDA (PPP-BOTDA) has overcome the limitation in spatial resolution of the conventional BOTDA. PPP-BOTDA uses a weak pulse pre-pump with a long duration followed by an intense pulse with short duration. The acoustic wave excited by this pulse pre-pump provides Brillouin gain to the short pulse, resulting in a narrow spectral bandwidth and high spatial resolution measurement. Following to this success, several systems that are also based on pulse pre-pump technique have also been introduced, such as differential pulse-width pair BOTDA (DPP-BOTDA), optical differential parametric amplification BOTDA (ODPA-BOTDA) and phase-shift pulse BOTDA (PSP-BOTDA).
In order to improve the SNR, the idea of coding technique to modulate the pump light of BOTDA has been proposed. Basically, there are two types of coded pulses proposed in BOTDA; non-return-to-zero (NRZ) coded pulses and return-to-zero (RZ) coded pulses. Both types employ intensity modulation scheme to modulate the optical pulse. However, employing NRZ coded pulses has induced distortion in the measured Brillouin signal when the bit pulse duration is around or less than 𝜏𝑎. This distortion is caused by varieties of additional gain of the preceding coded pulses.
Consequently, return-to-zero (RZ) format has been introduced into the coded pulses of the high-spatial-resolution BOTDAs so that interactions between the preceding and succeeding bit pulses should not occur through the SBS process.
vii
the coded PSP-BOTDAs employ phase modulation scheme to modulate the optical pulse.
When employing the conventional coded discrete-PSP-BOTDA, theoretically, the SNR increases linearly with √𝐿, where L is the code length. However, in the actual measurement, the use of AC-coupled amplifier for amplifying the coded electrical signal of high frequency rejects the DC and the low frequency component signals. As a result, the amplitude of the amplified signal exponentially decreases, especially when a very long pulse train is used. When light from laser diode (LD) is externally modulated with such a distorted electrical signal, the linear increase in the Brillouin signal with the code lengths cannot be obtained. As a result, the increment trend of the SNR with the code length becomes nonlinear as well. Therefore, in this thesis, the author proposes a new configuration of the coded electrical signal for the input of the AC-coupled amplifier to overcome the problems described above. The experimental results have shown that by using the proposed configuration, the SNR increases in much better accordance with √𝐿 than the conventional pump configuration.
In the case of conventional coded continuous-PSP-BOTDA, it was previously found that the use of NRZ-formatted pulses employing Golay codes has successfully demonstrated sub-meter spatial resolution. The Brillouin signals obtained with the NRZ-coded pulses are also well decoded if the total duration of the coded pulses is around or less than 𝜏𝑎. This is because the subtraction of Brillouin signal measured by a code and its inversion
intrinsically cancels the Brillouin gain due to the interaction between each coded pulse and the probe, extracting only the Brillouin gain that is derived from the interaction of each coded pulse with the acoustic wave excited by the pre-pump pulse. However, since the acoustic wave decays significantly after 𝜏𝑎, the decoded Brillouin signal is
distorted, resulting in the degradation of the spatial resolution, especially when using Golay code of total duration longer than 𝜏𝑎.
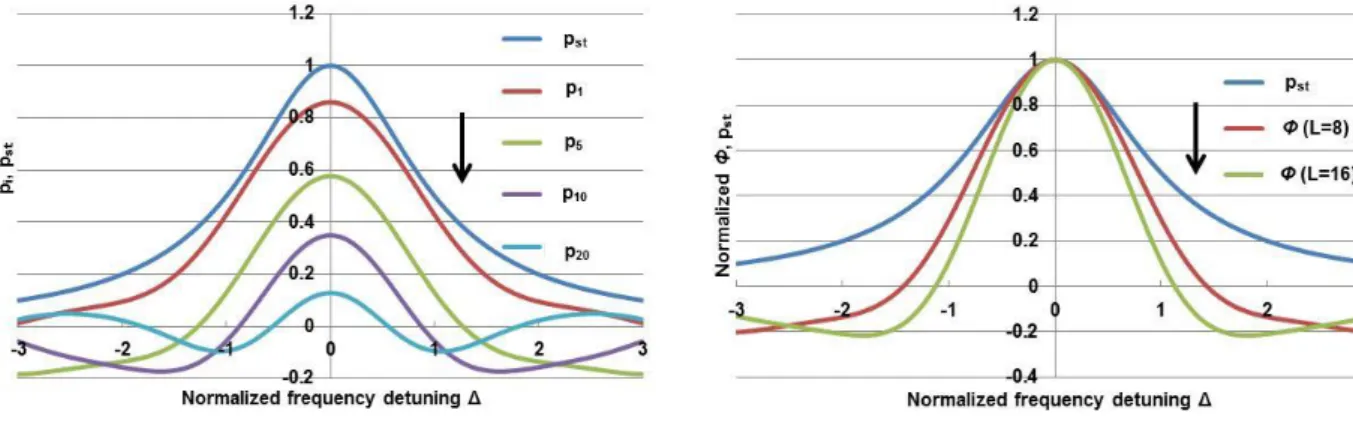
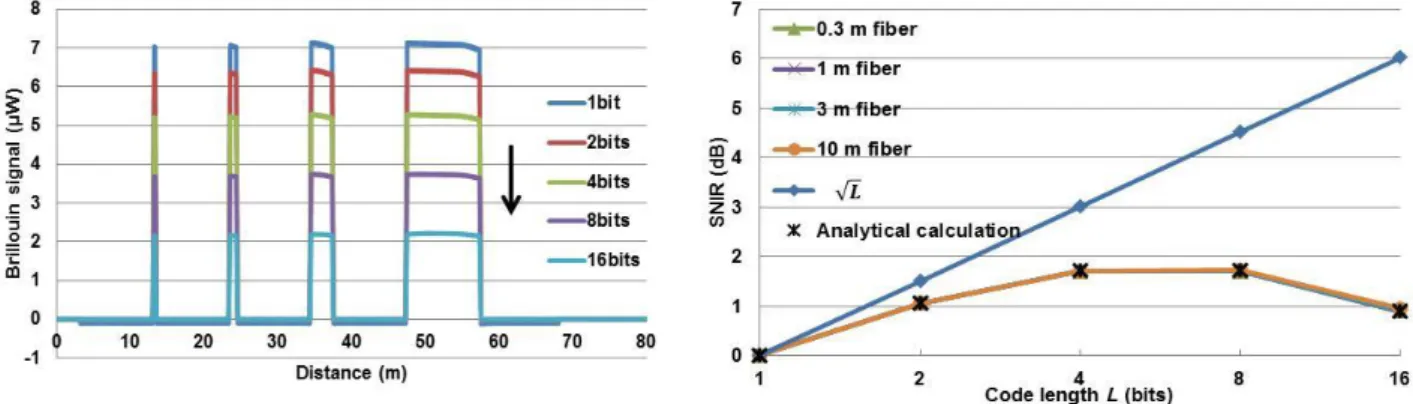
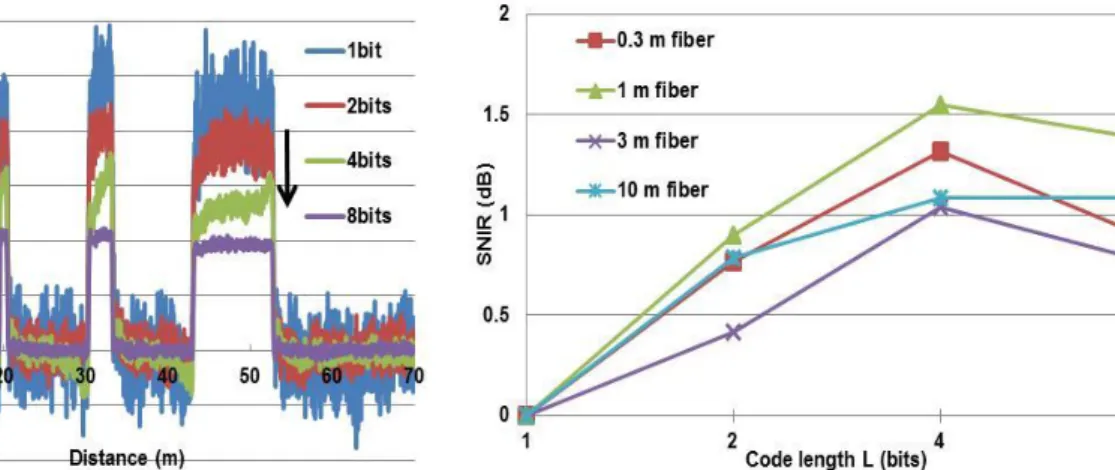
Therefore, in this thesis, instead of employing Golay codes, the author proposes to modulate the NRZ formatted pump light of the coded continuous-PSP-BOTDA with Walsh codes. It was found that the use of Walsh codes in the NRZ formatted pump induces little degradation in the spatial resolution, contrary to the previous results for Golay codes. This advantage of the Walsh code over the Golay code comes from the fact that decoding the Brillouin signals via Hadamard transform for Walsh codes is robust not only against variations in launched coded-pulse amplitudes but also against those in response signals. 20cm and 10cm of spatial resolutions were successfully attained for pulse durations of 2ns and 1ns cases, respectively. Apart from that, the maximum SNR improvement of 3dB was recorded for 8-bit Walsh code pulses having 1ns duration each, being consistent with analytical and numerical calculations.
In order to further improve the SNR, the author has also proposed in this thesis to simultaneously use RZ- and NRZ pulses to modulate the pump light for coded PSP-BOTDA. The coding systems employed in these proposed coding systems are Golay code and Walsh code. The use of the proposed combined codes offers higher SNR than that of the conventional coded PSP-BOTDA that uses only RZ- or NRZ coded pulses. Furthermore, after the decoding process, high spatial resolution corresponding to the coded pulse duration can still be attained. There are four types of coded PSP-BOTDAs that simultaneously use the RZ or NRZ pulse coding discussed in this dissertation; the dual Golay codes-PSP-BOTDA, the two types of combined Walsh and Golay codes-PSP-BOTDAs and dual Walsh codes PSP-BOTDA.
In the case of dual Golay codes-PSP-BOTDA, for NRZ pulses, it was found that the SNR improvement is limited by 𝜏𝑎, which is 9ns for silica fibers. When using coded pulses of duration 1ns, the maximum code duration for NRZ
viii
Brillouin signal, leading to the degradation of the spatial resolution. On the other hand, for RZ pulses, the maximum code length that can be used is limited by the round trip time of light in fiber. Initial experiments for NRZ code length Lcont=4 (NRZ pulses), Ldisc=8 (RZ pulses) have demonstrated about 7-dB enhancement in the optical signal-to-noise
ratios when compared to the single pulse PSP-BOTDA. The same amount of enhancement was also achieved when Lcont=8, Ldisc=4. Furthermore, the spatial resolution measurement of 10 cm was successfully demonstrated.
In the case of combined Walsh and Golay codes PSP-BOTDA, from the simulation and experimental results, it was confirmed that the assignment of Walsh codes to NRZ pulses has kept the spatial resolution high even when the code duration exceedsa. Even though the Brillouin signal measured by the code sequences exponentially decays, the
decoding process via Hadamard transform for Walsh coded NRZ pulses in the proposed system still produces more accurate decoded signals than that via Golay codes correlation calculations. From the rising edge length result obtained with the combined codes, the spatial resolution of 10cm was successfully demonstrated.
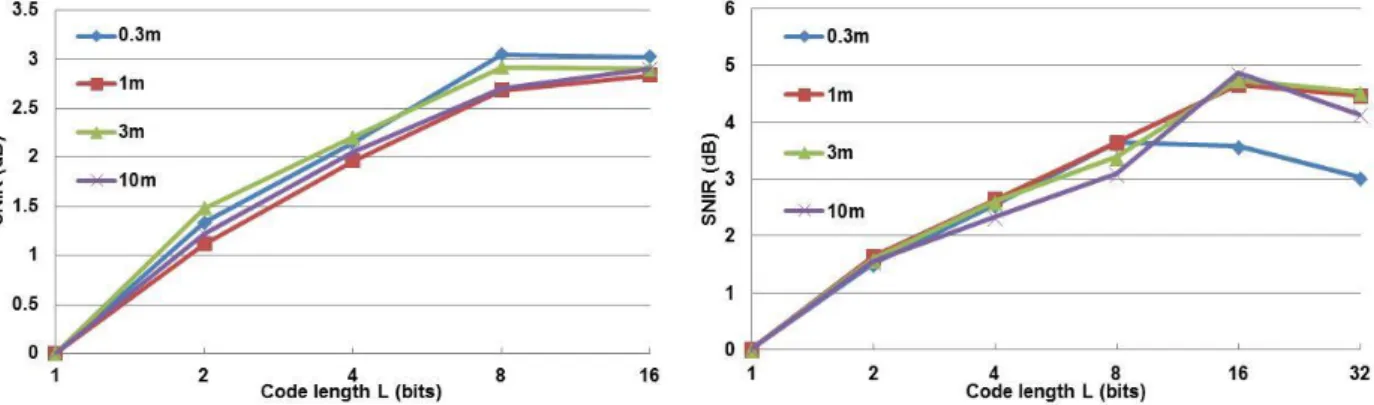
It was also found that the combination of Golay and Walsh codes has contributed higher optical SNIR than that of using only one kind of code in coded continuous- and coded discrete-PSP-BOTDAs. In the analysis, for both Golay and Walsh codes cases, the use of coded RZ pulses increases the optical SNIR by √𝐿 (L: code length of Golay code or Walsh code). For NRZ pulses, however, the improvement became slow with increasing L and finally dropped from the maximum for long code length. This is due to the decrease of Brillouin signal induced by the acoustic wave decay. It was observed that the optical SNIR reached its maximum of 3dB when the total duration of the 8-bit coded NRZ pulses was 8ns, confirming that code duration of the NRZ pulses is limited bya.
For dual Walsh codes PSP-BOTDA case, the robustness of Hadamard transform against the variations in the received signal amplitudes during the decoding process has contributed to the achievement of high spatial resolution measurement, even for total code duration LcontT2 (T2: pulse duration) of longer than a cases. In the simulations, the
spatial resolutions of 20cm and 10cm has been confirmed with the use of T2 = 2ns and 1ns, respectively. In terms of the optical SNIR, for dual Walsh codes case, the maximum optical SNIR of about 3dB was obtained when LcontT2 is set to around aand 2a. In the preliminary experiment, the impact of Ldisc on the measured Brillouin signals was studied.
Compared to the conventional PSP-BOTDA without coding, the total SNIR of about 5.4dB was obtained when Ldisc=4
(Lcont fixed at 4 bits), which agrees well with the theoretical SNIR of 6dB.
Finally, from the numerical results obtained for the four types of combined codes system described above, measurement performance in terms of the measurement speed and the spatial resolution is analyzed and compared. It was found that the dual Golay codes PSP-BOTDA offers the fastest measurement speed to acquire the SNR for reducing BFS error to below 1MHz. In contrast, dual Walsh codes PSP-BOTDA provides the slowest measurement speed. On the other hand, the combination of Walsh (NRZ) and Golay (RZ) codes gives a good tradeoff between the measurement speed and spatial resolution. For the opposite combination of Walsh (RZ) and Golay (NRZ) codes, since the code duration for NRZ pulses is limited bya, in order to achieve the required SNR, the code length for RZ pulses
(code length for Walsh codes) has to be increased. However, it would cause significant increase in the measurement time. Therefore, it was concluded that there was little merit found in this combination.
ix
many codewords as the amount of the code length. However, this disadvantage vanishes when once we measure the fiber of longer than 10km with 2cm spatial resolution and with the frequency accuracy of better than 1MHz. This is because in such a case signal averaging is required additionally, which results in the same measurement time it takes for both Walsh code and Golay code.
1
Chapter 1: Introduction
1.1
Research Introduction
Fiber optic communication technology is expanding at an explosive rate. The need for an optical communication in a nation is very high as the system has the potential to deliver better and more reliable services due to its technological advancement compared to other communication system. The advantage lies in its capability to transmit optical signal with low transmission losses of below 1dB/km and high speed data transfer rate [1]. Furthermore, fiber optic communication is an excellent choice for long haul communication, especially for undersea fiber optic network, thanks to its durability to withstand such an extreme environment.
Because of its prominent features against other communication systems, the evolution of the fiber optic communication technology has opened the way for other researches, including the research on fiber optic sensor. Studies have shown that the potential market for fiber optic sensor is increasing each year [2].
As such, in this thesis, the author has proposed and analyzed new techniques to measure distributed strain and temperature utilizing the existing distributed fiber optic sensor called Brillouin optical time domain analysis (BOTDA) for the purpose of improving the sensing efficiency. BOTDA is technique of measuring distributed strain and/or temperature along fiber optic cable by utilizing the occurrence of optical scattering in fiber called stimulated Brillouin scattering (SBS) [3]. BOTDA has found its applications especially in the civil engineering for structural health monitoring (SHM) for buildings, bridges, dams etc. This sensor can also be applied as a nerve system to detect crack on an airplane, intrusion detection in buildings, and even to detect leakage along petroleum/gas pipeline.
A BOTDA measurement system uses an intense pulsed light (pump) and a counter propagating continuous wave light (probe) of frequency value set at Stokes frequency injected into a fiber optic cable. When the frequency difference between the pump and the probe is tuned to the Brillouin frequency shift (BFS) of the fiber, the probe is amplified by the pump through the process of SBS. BOTDA measures the amplified probe waveform. The unique characteristic of the BFS is that it linearly increases with the increase in the strain or temperature of the fiber. Therefore, the BOTDA can measure local changes in the strain and temperature along the fiber.
At the early stage of development, the best spatial resolution obtained was 1m, with the use of pump pulse of duration 10ns [4]. This is because, shortening the duration to less than 10ns, which is around the time constant of the acoustic wave amplitude for silica fiber could cause the Brillouin gain to decrease significantly and consequently broadens the bandwidth of the Brillouin gain spectrum, resulting in the difficulty to measure BFS accurately. Therefore, it had been believed then that both the gain decrease and the spectral width broadening had precluded sub-meter spatial resolution measurements.
2
Returning to back to the progress of BOTDA technology, a major breakthrough in the spatial resolution improvement was made from the experiments conducted by Bao et al. in 1999. In the experiment, it was found that the bandwidth of the Brillouin gain spectrum suddenly reduced when the pulse duration further decreased to the value smaller than the time constant of the acoustic wave [7]. This phenomenon was later explained by Lecoeuche et al. from numerical calculations that weak cw leakage from the electro-optic modulator had played a role of pre-pump [8]. This analysis had given researchers ideas to effectively use pre-pump pulse as a method to improve the spatial resolution; pulse pre-pump BOTDA (PPP-BOTDA) was proposed to improve the spatial resolution down to sub-meter range [9]. PPP-BOTDA uses a weak pulse pre-pump with a long duration followed by an intense pulse with short duration. The acoustic wave excited by this pulse pre-pump provides Brillouin gain to the short pulse. As a result, narrow spectral bandwidth and high spatial resolution measurement have been realized by this system.
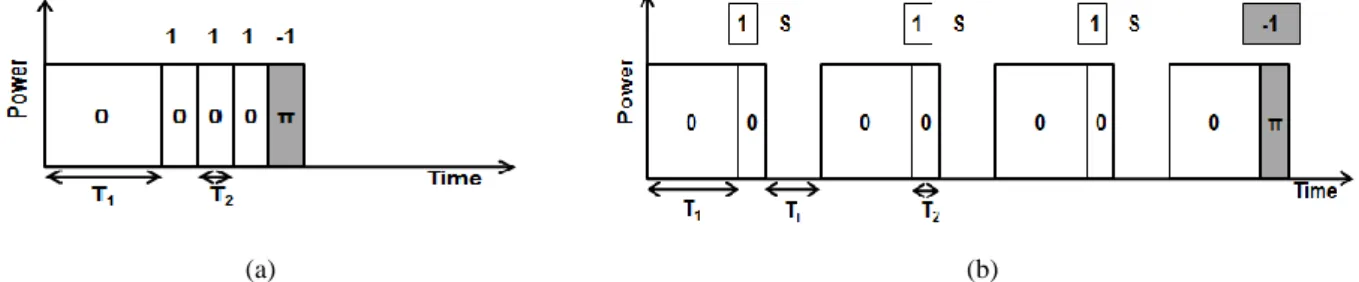
Based on the same approach, in recent years, several other systems have also been introduced, such as differential pulse-width pair BOTDA (DPP-BOTDA), optical differential parametric amplification BOTDA (ODPA-BOTDA) and phase-shift pulse BOTDA (PSP-BOTDA). DPP-BOTDA uses two separate pump pulses with small width difference. The subtraction of the Brillouin signal in the electrical signal field produces the final measurement result. The width difference determines the spatial resolution [10]. ODPA-BOTDA practices the same approach, except that the pulses are generated at the Stokes and anti-Stokes frequencies and simultaneously injected into the fiber. This system allows simultaneous measurement of Brillouin gain and Brillouin loss. Thus, no subtraction is required at the post-processing stage because the signals due to the co-propagating pre-pump are cancelled out before reaching the photo detector [11]. PSP-BOTDA proposed by Horiguchi et al. uses two separate pump pulses having the same durations. One pump contains a preceding long pre-pump pulse (1st pulse) and a succeeding short pulse (2nd pulse); these pulses are in the same phase (no phase difference between the pulses). The other pump also contains a 1st pulse and a 2nd pulse; but the 2nd pulse is in π-phase shift compared to the 1st pulse [12]. Subtracting the two Brillouin signals obtained by each pump yields Brillouin signal whose intensity is approximately twice that of DPP-BOTDA. The spatial resolution is determined by the duration of the 2nd pulse.
1.2
The Proposal on Pump Pulse Coding in the BOTDA
Coding techniques have been commonly used in optical time domain reflectometry (OTDR) that measures Rayleigh scattering in fibers for improving its performance [13, 14]. In general, the employment of coding technique in a measurement system can improve the signal-to-noise ratio (SNR) of the measured signal. The employment of pump light coding in PSP-BOTDA not only gives merit to the SNR improvement, but also gives benefit in faster measurement speed. To further discuss this benefit, let us consider an ideal system of conventional PSP-BOTDA without coding, measuring Brillouin signals over a 1000m length of fiber optic cable. In order to perform the measurements for 100 of frequencies (Nfreq = 100) with 1000 times of averaging, the required total measurement time, Tmeasurement for the conventional BOTDA can be described as
sec s N times Averaging RTT
Tmeasurement fiber freq
1 100 1000 10 (1.1)
3
times FT SNRenhancement 8 . 15 10 10 2 6 . 0 2 ) 10 / ( (1.2).The analytical calculations above clearly give the merit of faster measurement speed that associated with the SNR improvement.
For the same purpose, coding techniques have been proposed in the BOTDA based fiber sensor [15-17]. It has been recognized, however, that the use of non-return-to-zero (NRZ)-formatted pulses in coded BOTDA has induced distortion in the measured Brillouin signal when the bit pulse duration is around or less than the time constant of the acoustic wavea. This distortion is caused by varieties of additional gain of the preceding coded pulses. Consequently,
return-to-zero (RZ) format has been introduced into the coded pulses of the high-spatial-resolution BOTDAs so that interactions between the preceding and succeeding bit pulses should not occur through the SBS process [15-17].
Despite the signal distortion problem described above, the proposal on the use of NRZ-formatted pulses employing Golay codes in the PSP-BOTDA called coded continuous-PSP-BOTDA has successfully demonstrated sub-meter spatial resolution, [18-19]. The Brillouin signals obtained with the NRZ-coded pulses are also well decoded if the total duration of the coded pulses is around or less thana. This is because the subtraction process in the PSP-BOTDA
intrinsically cancels the Brillouin gain due to the interaction between each coded pulse and the probe, extracting only the Brillouin gain that is derived from the interaction of each coded pulse with the acoustic wave excited by the pre-pump pulse. However, since the acoustic wave decays significantly aftera, the decoded Brillouin signal is
distorted, resulting in the degradation of the spatial resolution, especially when using Golay code of total duration longer thana.
To solve this problem, the author has proposed the employment of Walsh codes in the coded continuous-PSP-BOTDA. It was verified analytically, numerically and experimentally that Walsh codes can decode the Brillouin signals more accurately than the Golay codes do, without deteriorating the spatial resolution [20]. The robustness of the decoding process called Hadamard transform against the variations in the received Brillouin signal power has contributed to this success. It will be further discussed in details in Chapter 6 the advantages of employing Walsh codes over Golay codes in the coded continuous-PSP-BOTDA.
To further obtain higher SNR in the Brillouin signal, the author has proposed a technique of combining two codes in modulating the pump light of the coded PSP-BOTDA. This technique utilizes the simultaneous use of RZ- and NRZ pulses in modulating the pump light of the coded PSP-BOTDA [19, 21, 22]. Applying this technique can increase the total code length that can be used for the measurement. As a result, it is possible to obtain higher SNR than that of the previous coded continuous-PSP-BOTDA that uses only NRZ formatted pulses, the coded discrete-PSP-BOTDA that uses only RZ formatted pulses and obviously higher than that of other coded BOTDAs described in references [16] and [17]. Four types of code configurations are introduced in the combined codes PSP-BOTDA system; they are dual Golay codes-PSP-BOTDA, the two types of combined Walsh and Golay codes-PSP-BOTDAs and dual Walsh codes-PSP-BOTDA. Numerical simulations and experimental results are presented to show the advantages of employing four coding systems above in the PSP-BOTDA.
1.3
Thesis Structure
4
the theoretical formulation of spontaneous Brillouin scattering as well as stimulated Brillouin scattering (SBS). In Chapter 3, the literature review on the Brillouin based sensors are explained. Starting with the classic BOTDA technique, other techniques such as PPP-BOTDA, DPP-BOTDA, ODPA-BOTDA, PSP-BOTDA, coded PSP-BOTDA and BOCDA are also discussed in further details.
Chapter 4 ~ Chapter 11, which are the author’s main contributions to this dissertation, discuss the proposed coding techniques in the PSP-BOTDA. In Chapter 4, a new concept of coding system for modulating the pump light of PSP-BOTDA techniques is described. The two basic coding systems employed in the PSP-BOTDA technique are Golay complementary pair (GCP) or also known as Golay codes and Walsh codes. To describe in brief, compared to the conventional PSP-BOTDA without coding, the employment of coding system has contributed to the achievement of higher SNR with high spatial resolution. The author has also proposed and discussed another new technique of combining two codes to modulate the pump light for further improving the signal-to-noise ratio (SNR). There are three combined code systems proposed in this chapter; the dual Golay codes, combined Walsh and Golay codes and dual Walsh codes. In Chapter 5, analysis on the employing GCP in the coded PSP-BOTDA called coded discrete-PSP-BOTDA is discussed. Coded discrete-PSP-BOTDA has been previously proposed to improve the SNR. However, in the experimental analysis, there were some problems in utilizing long code lengths due to the effects of the AC-coupled electrical amplifier used in the experiments. The author proposed a technique to overcome these problems. In Chapter 6, the author highlights the proposal for further improving the spatial resolution of the previously proposed coded continuous-PSP-BOTDA technique. In the previous studies, it was found that the spatial resolution of the coded continuous PSP-BOTDA employing Golay code has been degraded when the code length of duration longer than a
was used. The author has introduced a coding system called Walsh codes to overcome this problem. In Chapter 7, the simulation and experimental analysis on the employment of dual Golay codes in the PSP-BOTDA technique is discussed. Chapter 8 focusses on the proposal of combining Walsh and Golay codes in modulating the pump light of PSP-BOTDA. Chapter 9 discusses the dual Walsh codes proposal. The simulation results shown in Chapter 9 are also compared with that shown in Chapter 7 and further discussed for the purpose of comparing the sensing efficiency between the two techniques. Preliminary experiments were also conducted and the results are described in Chapter 9. In Chapter 10, the measurement performance of the BOTDA employing the proposed codes is numerically analyzed and presented. By referring to the actual measurement data reported in publications, the parameters used in the analytical calculations were determined. This study has highlighted the relationship between the SNR and the measurement time for longer fiber length (1km and 10km) with high spatial resolution (10cm and 2cm). The results obtained for the proposed coding systems are then analyzed and compared with that of conventional coded PSP-BOTDAs (coded discrete- and coded continuous-PSP-BOTDAs); this analysis has revealed that the proposed coding system can provide BOTDA with superior performance in the spatial resolution and measurement time than the conventional one. Finally, Chapter 11 gives the conclusions and the proposed future works of the research.
References
[1] G. P. Agrawal. “Fiber-optic Communication Systems 3rd Edition”, Wiley Interscience Publication (2002).
[2] Matthew Peach, “Market for fiber optics sensors to hit $4bn by 2017”, http://optics.org/news/4/6/17, 13th Jun. 2013.
5
[4] T. Horiguchi, T. Kurashima, and Y. Koyamada, “1 m spatial resolution measurement of distributed Brillouin frequency shift in single-mode fibers,” in Tech. Dig. Symp. Opt. Fiber Meas., NIST Special Publication 864, Boulder, CO, pp. 73-76, Sept. 1994.
[5] K. Hotate and T. Hasegawa, “Measurement of Brillouin gain spectrum distribution along an optical fiber using a correlation-based technique –Proposal, experiment and simulation–,” IEICE Trans. on Electron., vol. E83-C, no. 3, pp. 405-412,
Mar. 2000.
[6] K. Y. Song, Z. He and K. Hotate, “Distributed strain measurement with millimeter-order spatial resolution based on Brillouin optical correlation domain analysis”, Opt. Lett., vol. 31, no. 17, pp. 2526-2528, Sep. 2006.
[7] X. Bao and A. Brown, “Characterization of the Brillouin-loss spectrum of single-mode fibers by use of very short (<10-ns) pulses”, Opt. Lett., vol. 24, no. 8, pp. 510-512, Apr. 1999.
[8] V. Lecoeuche, D. J. Webb, C. N. Pannell and D. A. Jackson, “Transient response in high-resolution Brillouin-based distributed sensing using probe pulses shorter than the acoustic relaxation time”, Opt. Lett., vol. 25, no. 3, pp. 156-158, Feb. 2000. [9] C. H. Li, K. Nishiguchi, M. Miyatake, A. Makita, M. Yokoyama, K. Kishida, T. Mizutani and N. Takeda, “PPP-BOTDA
method to achieve 2cm spatial resolution in Brillouin distributed measuring technique”, Technical Report of IEICE. OFT 108(32) (in Japanese), pp. 55-60, May 2008.
[10] W. Li, X. Bao, Y. Li and L. Chen, “Differential pulse-width pair BOTDA for high spatial resolution sensing”, Opt. Exp., vol. 16,
no. 26, pp. 21616-21625, Dec. 2008.
[11] Y. Li, X. Bao, Y. Dong and L. Chen, “A novel distributed Brillouin sensor based on optical differential parametric amplification”, J. Lightw. Technol., vol. 28, no. 18, pp. 2621-2626, Sep. 2010.
[12] T. Horiguchi, R. Muroi, A. Iwasaka, K. Wakao and Y. Miyamoto, “Negative Brillouin gain and its application to distributed fiber sensing (presented poster style)”, 33rd
European Conference and Exhibition of Optical Communication (ECOC) 2007, P018, Sep. 2007; T. Horiguchi, R. Muroi, A. Iwasaka, K. Wakao and Y. Miyamoto, “BOTDA utilizing phase-shift pulse”, IEICE Trans. Commun. (in Japanese), vol. J91-B, no. 2, pp. 207-216, Feb. 2008.
[13] M. D. Jones, “Using simplex codes to improve OTDR sensitivity”, IEEE Photon. Tech. Lett., vol. 15, no. 7, pp. 822-824, Jul.
1993.
[14] D. Lee, H. Yoon, P. Kim, J. Park and N. Park, “Optimization of SNR improvement in the noncoherent OTDR based on simplex codes”, J. Lightw. Technol., col. 24, no. 1, Jan. 2006.
[15] R. Muroi, T. Horiguchi, Y. Miyamoto, Y. Sato, A. Tachibana and A. Takakura, “PSP-BOTDA based on Golay code”, IEICE
Trans. Commun. (in Japanese), vol. J91-B, no. 11, pp. 1493-1501, November 2008.
[16] H. Liang, W. Li, N. Linze, L. Chen and X. Bao, “High-resolution DPP-BOTDA over 50 km LEAF using return-to-zero coded pulses”, Opt. Lett., vol. 35, no. 10, pp. 1503-1505, May 2010.
[17] M. A. Soto, G. Bolognini and F. Di. Pasquale, “Analysis of pulse modulation format in coded BOTDA sensors”, Opt. Exp., vol.
18, no. 14, pp. 14878-14892, Jul. 2010.
[18] D. Uchiyama, T. Horiguchi, H. Ando, Y. Okumoto, T. Sasaki and Y. Sawai, “Signal to noise improvement ratio for coded
PSP-BOTDA”, Technical report of IEICE. OFT 109 (377) (in Japanese), pp. 33-38, Jan. 2010.
[19] M. S. D. B. Zan and T. Horiguchi, “A dual Golay complementary pair of sequences for improving the performance of
phase-shift pulse BOTDA fiber sensor” J. Lightw. Technol., vol. 30, no. 21, pp. 3338-3356, Nov. 2012.
[20] M. S. D. B. Zan, T. Tsumuraya and T. Horiguchi, “The use of Walsh code in modulating the pump light of high spatial
resolution phase-shift-pulse Brillouin optical time domain analysis with non-return-to-zero pulses”, J. Meas. Sci. Technol., vol.
6
[21] M. S. D. B. Zan and T. Horiguchi, “Analysis on the Employment of Combined Codes in Modulating the Pump Light of Phase
Shift Pulse Brillouin Optical Time Domain Analysis (PSP-BOTDA)”, Proc. of 51st Meeting on Lightwave Sensing Technol.,
LST51-17, pp. 115-120, Jun. 2013.
[22] M. S. D. B. Zan, K. Yokoyama and T. Horiguchi, “Combination of Walsh and Golay codes in modulating the pump light of
phase-shift pulse BOTDA sensor”, Proc. of the IEEE 4th Int. Conf. on Photonics (ICP 2013) 2013, Malaysia, No. 46
7
Chapter 2: Spontaneous and Stimulated Brillouin Scattering
2.1
Introduction to Chapter
Brillouin scattering is an optical scattering that occurs in a medium when light traveling through it interacts with optical density variations of the medium. The density variation is caused by the acoustic wave that also acts as pressure. The pressure then compresses the medium, causing the refractive index of the medium to change. In the case of fiber optic cable, the sound wave causes the change in the refractive index of the fiber core. As a result, this process causes the propagating light to scatter into the Brillouin scattered light. In other words, Brillouin scattering can be defined as the scattering of a photon from an acoustic phonon. Brillouin scattering phenomenon is subjected to the Doppler shift, because the sound wave also propagates along the fiber. Therefore, Brillouin scattering process causes the change in the frequency and energy of the scattered light. There are two components of scattered light induced by Brillouin scattering process. One is the scattered light with frequency shifted down to lower frequency known as Stokes component and the other one is the scattered light with frequency is shifted to higher frequency known as anti-Stokes component. In this thesis, the Stokes component is the main subject that will be explained in deep details.
Brillouin scattering can be detrimental in fiber optics communication system because it limits the performance of the signal transmission in terms of maximizing the input power. However, at the same time, the scattering is also useful for the applications such as the Brillouin fiber sensor, Brillouin fiber lasers and Brillouin fiber amplifiers [1-3]. Apart from that, the theory of slow light induced from the scattering phenomenon has led to the development of optical buffering in the future all-optical router communication systems [4].
Optical Brillouin scattering process falls in two categories, one is spontaneous Brillouin scattering and the other one is stimulated Brillouin scattering (SBS). In general, the spontaneous light scattering means the light is scattered under condition such that the optical properties of the medium are not modified by the incident light beam [5]. For spontaneous Brillouin scattering, the optical field of the incident light is usually so small that it does not modify the acoustic properties of the medium. In this case, the spontaneous Brillouin scattering originates from the scattering of the light from the acoustic wave that is thermally excited. On the contrary, the SBS usually appears when the optical field of the incident light used is sufficiently large, that it alters the density variation of the medium and causes the scattered light to become quite intense. The incident light and the scattered light can then beat together, giving rise in the acoustic wave through electrostriction process. Thus, under this condition, the scattered light and the acoustic wave mutually contribute to each other’s growth [5].
In this chapter, spontaneous Brillouin scattering will be explained first which consists of both Stokes and anti-Stokes waves. In the next section, stimulated Brillouin scattering (SBS), which is the main fundamental process applied in this research, is also explained.
2.2
Nonlinear Wave Propagation
8 t rot E B E ~ ~ ~ (2.2) ~ ~ ~ D D div (2.3) 0 ~ ~ B B div (2.4)
where E~ is the electrical field vector of the optical light, H~ is the magnetic field vector , D~ is vector of the electric flux density, B~ is the vector of magnetic flux density, J~is the vector of current density and ~ is the charge density. The tilde sign (~) used in this chapter denotes the quantity that rapidly varies with time. To solve these equations, we first consider the regions of space that contains no free charges, so that
0 ~
(2.5)
and contains no free current, so that 0
~
J (2.6)
We also assume that the material is nonmagnetic, so that
H
B~0~ (2.7)
where 0 is the permeability of free space. However, we allow the material to be nonlinear in the sense that the fields
̃ and ̃ are related by
P E
D~0~~ (2.8)
where 0 is the permittivity of free space and P
~
is the dielectric polarization. By assigning Eqs. (2.5), (2.6) and (2.8) into Eq. (2.1), one may obtain
E P
H H~ ~ 0~~ t rot (2.9) with P~ is expressed as NL P E P~0~~ (2.10)where 0E~ denotes the linear polarization part and
NL
P~ the nonlinear polarization part. By using Eq. (2.10), we can then express Eq. (2.9) as
E P
H H~ ~ 0~~ t rot
NL
P E E~ 0 ~ ~ 0 t t t E PNL ~ ~ (2.11) where r 0(1 ) 0 (2.12)with ris the material relative permittivity and is the electrical susceptibility. Next, the Eq. (2.7) is substituted into
Eq. (2.2) to obtain t t rot E B H E ~ ~ ~ ~ 0 (2.13).
By assigning another rotation () into Eq. (2.13), it then becomes
9
Assigning Eqs. (2.11) and (2.12) into the right side of Eq. (2.14), one may get t t t NL P E E ~ ~ ~ 0 2 2 0 2 2 0 ~ ~ t t E PNL (2.15) By using the common relation of vector as expressed below,
E E E~) ( ~) ~ ( 2 (2.16)
the left-hand side of Eq. (2.16) is replaced with the right-hand side of the Eq. (2.15) and further organized to produce
2 2 0 2 2 0 2 ~ ~ ~ ) ~ ( t t E E E PNL (2.17).
Assuming that the contribution of E~ is small and negligible, Eq. (2.17) then becomes
2 2 0 2 2 0 2 ~ ~ ~ t t E E PNL (2.18)
Using the relation 0 1/0c2 and the relation in Eq. (2.12), Eq. (2.18) then becomes 2 2 2 0 2 2 2 2 ~ 1 ~ ~ t c t c r E E PNL (2.19) which notates the nonlinear wave propagation equation in media.
2.3
Spontaneous Light Scattering
2.3.1
Spontaneous Brillouin Scattering
In this section, the sound wave (pressure wave) equation involved in the optical scattering process that will be described next is related to the expression of Stokes scattering. The equation of motion for a sound wave given in terms of pressure wavep~ can be described as
0 ~ ~ ~ 2 2 2 2 2 p t p t p (2.20) where is the velocity of sound and is the damping parameter.
To study the nature of the acoustic wave equation in Eq. (2.20), we consider the propagation of the wave in an acoustic medium as c c e p p iqz t . ~ ( ) (2.21) where c.c is the complex conjugate. We introduce Eq. (2.21) in Eq. (2.20) and solve the equation step by step. We firstly expand the first term of Eq. (2.20)
c c pe c c pe t t p t qz i t qz i . . ~ ) ( 2 ) ( 2 2 2 2 (2.22)
Next we expand the second term of Eq. (2.20) as
c c pe iq t p z t p t qz i . ~ ~ ) ( 2 2 2 2 (2.23)
10 c c pe q c c pe z p t qz i t qz i . . ~ ) ( 2 2 ) ( 2 2 2 2 2 (2.24)
We then substitute Eqs. (2.22), (2.23) and (2.24) into Eq. (2.20) and write the equation as follows
0 0 2 2 2 2 ) ( ) ( 2 2 ) ( 2 ) ( 2 q iq pe pe q pe iq pe t qz i t qz i t qz i t qz i ) ( 2 2 2 q i (2.25).We can then rewrite Eq. (2.25) as
22 2 2 2 2 2 2 2 1 1 i i i q (2.26)
which shows that
2 i q (2.27)
where the phonon decay rate, can be expressed as
2
q
(2.28).
The time constant of the acoustic wave amplitude, a is defined as
2 2 2 q a (2.29),
which describes the time consumed by the amplitude of the acoustic wave to decay from 100% to 36.8%
1e .Next process is to calculate the rate at which light is scattered out by the acoustic wave. We express the incident optical field that propagates in z direction as
c c e E t z, E~0( ) 0 i( -t) . r k (2.30)
The scattered field obeys the driven wave equation
2 2 2 0 2 2 2 2 2 1 t P~ c t E~ c n E~ (2.31)
that is analogous to Eq. (2.17). The nonlinear polarization P~of the medium is described as
0 0 E ~ ~ P~ (2.32)
and the variation in the density, ~ is given by
S S p p S p ~ ~ ~ (2.33)
The first term of Eq. (2.33) describes the density fluctuations (acoustic wave) which leads to Brillouin scattering, while the second term of Eq. (2.33) describes the density fluctuations with the entropy S~ (temperature fluctuations), which leads to Rayleigh-center scattering. Thus, by taking only the first contribution in Eq. (2.33) where p~denotes the incremental pressure, one can find that
11 ) , ( ~ ) ( ~ 0 0eCSpr,t E z t (2.34)
where CS is called the adiabatic compressibility and e is the electrostrictive constant, which is defined by
0 e (2.35)
We take a typical component of the thermally excited pressure disturbance within the interaction region to be given by c c pe t , p( ) i -Ωt . ~ (qr ) r (2.36)
and solve the Eq. (2.31) by using Eq. (2.30) through Eq. (2.36) to produce
t i i t i i t i i t i -i S e t i r i t i i t i i t i -i S e t -i t -i Ωt -i Ωt -i S e S e e E p e E p e pE e pE c C e E p e E p e pE e pE t c C e E e E e p pe t c C t z E t , p t c C t P c t c n ) ( ) ( 0 2 ) ( ) ( 0 2 ) ( ) ( 0 2 ) ( ) ( 0 2 2 ) ( ) ( 0 ) ( ) ( 0 ) ( ) ( 0 ) ( ) ( 0 2 2 2 ) ( 0 ) ( 0 ) ( ) ( 2 2 2 0 2 2 2 2 2 2 0 2 2 2 2 2 * * ) ( * ) ( * ) ( ) ( * * * * * * ) , ( ~ ) ( ~ ~ 1 ~ ~ r q k r q k r q k r q k q k r q k r q k r q k r k r k r q r q r E E
p E e pE e cc
c CS i i t i -i t e . ) ( * ) ( 0 ( ) ( ) 2 ) ( ) ( 0 2 2 kqr kqr (2.37)The first term of Eq. (2.37) leads to Stokes scattering, and the second term refers to anti-Stokes scattering; the angular frequency of both scattered lights is respectively downshifted and upshifted by the value of .
2.3.2
Stokes Scattering
The illustration of the Brillouin scattering in a media for the case of Stokes scattering (first term of Eq. (2.37)) is shown in Fig. 2.1.
Fig. 2.1. Illustration of Brillouin scattering (Stokes scattering)
In Fig. 2.1, k is the wave vector of the incident optical field with its angular frequency of, k’ and is the wave vector and the angular frequency of the scattered light while q is the wave vector of the sound wave with its angular frequency of . The scattered light comprises with wave vector and frequency can be expressed as
k’ = k – q (2.38)
ω’ = ω – Ω (2.39)
The angular frequency ω and the wave vector k of the incident light are related together according to
12
and the angular frequency Ω and wave vector q of the acoustic wave can be expressed as
q
(2.41)
Therefore, one can change the form of Eq. (2.39) to become n c k (2.42)
In order to simultaneously satisfy the Eq. (2.38) through Eq. (2.42), the sound wave and its wave vector must have a particular value for any scattering direction. Fig. 2.1 (i) shows the relation of θ when the incident light is scattered at that particular angle. Figure 2.1 (ii) shows the vector relation between those two optical fields in (i) and Fig. 2.1 (iii) shows the relation of the wave vector of the sound wave disturbance that takes place when the incident field is scattered in a media. Take note that k is nearly equal to kbecause Ω is much smaller than ω. From the diagram of Fig. 2.1
(ii), it shows that
2 2ksin q (2.43)
Therefore, Eq. (2.41) then becomes
2 2 2 2 sin c n sin k (2.44)
From Eq. (2.44), one easily finds that the Stokes shift Ω is equal to zero for forward scattering and becomes maximum for back scattering (i.e: θ = 180 degrees). Therefore, the Eq. (2.44) can be rewritten as
c n 2 max (2.45)
By taking the value of n = 1.5,5960ms1, /21.93551014Hz for 1550nm, one can calculate the value of max/2 as GHz f c n 536 . 11 10 9355 . 1 10 3 5960 ) 5 . 1 ( 2 2 2 14 8 max
2.3.3
Anti-Stokes Scattering
The illustration of the anti-Stokes scattering (second term of Eq. (2.37)) can be shown in Fig 2.2.
Fig. 2.2. Illustration of Brillouin scattering (anti-Stokes scattering)
13
the incident light is scattered in a media. From Fig. 2.2, the scattered light with its components of wave vector k’ and angular frequency ω’ can be expressed as
k’ = k + q (2.46)
ω’ = ω + Ω (2.47)
By using the same relations shown in Eq. (2.40) to Eq. (2.43), one can write the wave vector of the acoustic wave q as 2 2ksin q (2.48)
Therefore, the angular frequency Ω of the acoustic wave is given as 2 2 2 2 sin c n sin k (2.49)
From the above explanation and illustration in Fig. 2.2, the anti-Stokes scattering can be defined as the scattering of light from an oncoming sound wave. In contrast with the Stokes scattering, the anti-Stokes scattering shows that the frequency of the scattered light is shifted up since it is induced by the oncoming acoustic wave. The illustration of the Stokes and anti-Stokes scattering is shown in Fig. 2.3.
Fig. 2.3. The spectrum of Stokes and anti-Stokes waves
2.4
Stimulated Light Scattering
2.4.1
Stimulated Brillouin Scattering (SBS)
In the previous section of the spontaneous light scattering, we can see that the scattering of the light in a nonlinear medium is said to be spontaneous when the fluctuation of the dielectric constant are excited thermally. In this section, the physical and mathematical explanations of the stimulated light scattering especially involves in the stimulated Brillouin scattering (SBS) are explained.
2.4.2
The Physical Process of SBS
The schematic diagram of the SBS process can be depicted in Fig. 2.4.
Fig. 2.4. The schematic diagram of the SBS process
The concept of SBS process can be visualized as an interaction between pump light (p), Stokes light (S) and
14
wave is produced from the interaction between the incident light and the nonlinear medium, the sound wave which also acts as pressure wave modulates the refractive index of the medium and the variation of the refractive index causes the incident light to be scattered through Bragg diffraction. In the SBS case, the scattered light is usually in the backward direction to the incident light. The portion of the incident light scattered is downshifted in its frequency which implies the Doppler shift associates with the gratings that move at the acoustic velocity. The angular frequency of the scattered light is shifted downward in frequency to the Stokes frequencyS P. By implying the energy
conservation law, the Brillouin scattering process is said to be stimulated when [6]
(i) The beating of the pump light and the Stokes light increases the energy of acoustic wave (PS).
(ii) The beating between the pump light and the acoustic wave increases the energy of Stokes light (S P).
By properly setting the parameter to create SBS phenomena, the feedbacks resulted from the interaction explained in (i) and (ii) may lead to the exponential growth of the amplitude of the Stokes wave.
2.4.3
Formulation of the SBS Wave
Assume that the optical field of the pump light and the Stokes wave can be respectively represented as
c c e t z A t z E~p( , ) p( , ) i(kpzpt) . (2.50) c c e t z A t z E i ksz st S S( , ) ( , ) . ~ ( ) (2.51). The total field can be expressed as
) , ( ~ ) , ( ~ ) , ( ~ t z E t z E t z E p S (2.52)
In a similar manner, the acoustic field can be described in terms of the material density distribution as
z t e cc
t z, ) ( , ) iqz t . ( ~ ( ) 0 (2.53)where Ω = ωp – ωS, q = 2kp, and ρ0 is the mean density of the medium. The material density changes in the Brillouin
medium is assumed to obey the acoustic wave equation (similar to the expression of Eq. (2.20))
f ~ ~ ~ 2 2 2 2 2 t t (2.54)
where is the sound velocity and Γ’ is a damping parameter. The right-hand side of Eq. (2.54) shows the divergence of the force per unit volume f, which can be expressed as
2 0 ~ 2 1 , p E pst st e
f (pst: strictive pressure due to the presence of electric field) (2.55)