九州大学学術情報リポジトリ
Kyushu University Institutional Repository
自己遺伝子を活用したセルフクローニングによるキ シロース資化能付与サッカロマイセス セレビシエの エタノール生産性向上に関する研究
福田, 明
http://hdl.handle.net/2324/2236312
出版情報:Kyushu University, 2018, 博士(農学), 課程博士 バージョン:
権利関係:
Studies on improving ethanol productivity of self-cloning xylose-using
Saccharomyces cerevisiae by endogenous genes utilization
Akira Fukuda
2019
ABBREVIATIONS
SHF Separate hydrolysis and fermentation
SSF Simultaneous saccharification and fermentation GMO Genetically modified organism
GRAS Generally recognized as safe
XR Xylose reductase
XDH Xylitol dehydrogenase
XK Xylulose kinase
XI Xylose isomerase
ADH Alcohol dehydrogenase FBA Flux balance analysis MFA Metabolic flux analysis
DFBA Dynamic flux balance analysis DMFA Dynamic metabolic flux analysis
GC-MS Gas chromatography mass spectrometry LC-MS Liquid chromatography mass spectrometry ATP Adenosine triphosphate
ADP Adenosine diphosphate
AMP Adenosine monophosphate
NAD+ Nicotinamide adenine dinucleotide (oxidized) NADH Nicotinamide adenine dinucleotide (reduced)
NADP+ Nicotinamide adenine dinucleotide phosphate (oxidized) NADPH Nicotinamide adenine dinucleotide phosphate (reduced)
CoA Coenzyme A
X5P Xylulose 5-phosphate Ru5P Ribulose 5-phosphate
R5P Ribose 5-phosphate
S7P Sedoheptulose 7-phosphate GAP Glyceraldehyde 3-phosphate E4P Erythrose 4-phosphate F6P Fructose 6-phosphate
G6P Glucose 6-phosphate
PGL 6-Phosphogluconolactone
6PG 6-Phosphogluconate
FBP Fructose 1, 6-bisphosphate 1,3BPG 1,3-Bisphosphoglycerate 3PG Glycerate 3-phosphate 2PG Glycerate 2-phosphate PEP Phosphoenolpyruvic acid DHAP Dihydroxyacetone phosphate Gly3P Glycerol 3-phosphate
OXA Oxaloacetic acid
LC-QqQ-MS Liquid chromatography/triple-stage quadrupole mass spectrometry
ED Endpoint deviation
TABLE OF CONTENTS
ABBREVIATIONS 2
TABLE OF CONTENTS 4
CHAPTER 1 Introduction 1.1 Lignocellulosic ethanol production ...8
1.2 Lignocellulose biomass ...10
1.2.1 Composition of lignocellulose biomass ...10
1.2.2 Properties of cellulose and hemicellulose ...11
1.3 Self-cloning ...11
1.3.1 Differences between “non-self-cloning” and “self-cloning” ...11
1.3.2 Advantages of self-cloning ...12
1.4 Xylose fermentation ...13
1.4.1 Microorganisms considered for ethanol fermentation ...13
1.4.2 metabolic engineering of Saccharomyces cerevisiae for xylose fermentation ...15
1.5 Metabolic pathway simulations ...18
1.6 Aim of this study ...20
CHAPTER 2 Construction of xylose-using S. cerevisiae by endogenous genes utilization (self-cloning) 2.1 Introduction ...22
2.2 Materials and methods ...23
2.2.1 Plasmid and strain construction ...23
2.2.2 Culture conditions ...24
2.2.3 Extracellular metabolites analysis ...24
2.3 Results ...25
2.4 Discussion ...28
CHPATER 3 Construction of kinetic model of the ethanol production pathway of self-cloning xylose-using S. cerevisiae 3.1 Introduction ...31
3.2 Materials and methods ...33
3.2.1 Plasmid and strain construction ...33
3.2.2 Culture conditions ...33
3.2.3 Extracellular metabolites analysis ...34
3.2.4 Intracellular metabolites analysis ...34
3.2.5 Model development ...35
3.2.6 Sensitivity analysis ...37
3.3 Results ...70
3.3.1 Development of the kinetic simulation model of the ethanol production pathway ...70
3.3.2 Estimated bottleneck reactions in the ethanol production pathway from xylose ...70
3.4 Discussion ...76
CHAPTER 4
Evaluation of ADH1 overexpression effect toward ethanol productivity in self-cloning xylose-using S. cerevisiae
4.1 Introduction ...79
4.2 Materials and methods ...80
4.2.1 Plasmid and strain construction ...80
4.2.2 Conditions for flask culture ...80
4.2.3 Conditions for 5-L jar culture ...81
4.2.4 Extracellular metabolite analysis ...81
4.3 Results ...82
4.3.1 Effect of ADH1 overexpression in xylose and glucose/xylose mixed medium in flask 82 4.3.2 Effect of ADH1 overexpression in 5-L jar culture ...88
4.4 Discussion ...91
CHAPTER 5 Conclusion ...93
ACKNOLEDGMENT 98
REFERENCES 99
CHPATER 1
Introduction
1.1 Lignocellulosic ethanol production
In recent years, instead of petroleum resources, renewable biomass is being converted to useful substances, and used in energy sources and industrial raw materials around the world. Ethanol produced by fermentation of microorganisms using biomass as a raw material, so-called bioethanol, is expected as an alternative fuel from the viewpoint of suppressing the consumption of petroleum resources and the increase of carbon dioxide in the atmosphere. Bioethanol has two categories. One is first generation bioethanol that made from sugar- or starch- rich food crops such as cereals, sugarcane, sugar beet and corn. The other is the second-generation bioethanol that made from lignocellulose biomass, agricultural residues and organic waste. Brazil and USA are the world’s largest ethanol producers, which produce ethanol from sugarcane and corn respectively, and they account for more than 65%
of world bioethanol production (Badger, P. C., 2002). However, productions of the first generation bioethanol are not sustainable from competition with food production, including the use of water and land area, and biodiversity (Scheidel, A. and Sorman, A. H., 2012).
Therefore the second generation bioethanol production from low cost substrates such as non-edible parts of cellulose-based herbaceous and woody plants as a main fuel that does not compete with food has attracted attention in particular (Chartchalerm, I. N. A. et al., 2007).
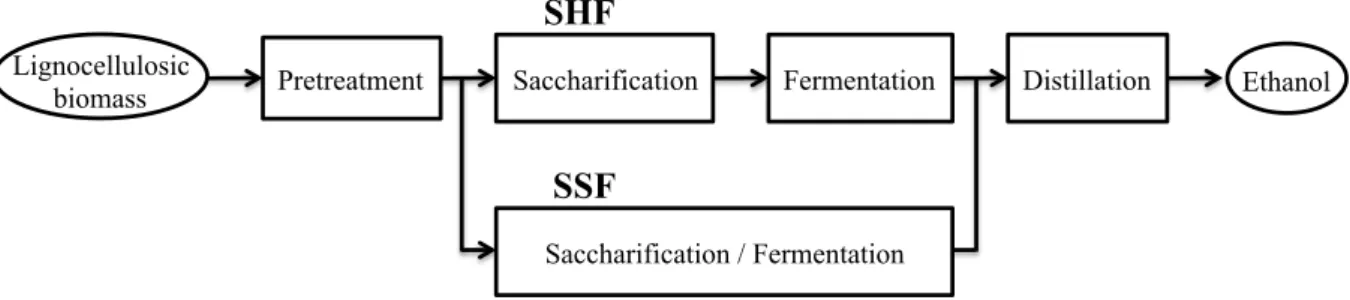
The production process of lignocellulosic ethanol consists of the following four processes as shown in Fig. 1-1: (i) Pretreatment, (ii) Saccharification, (iii) Fermentation and (iv) Distillation.
Fig. 1-1 Scheme of lignocellulosic ethanol production.
SHF; Separate hydrolysis and fermentation, SSF; Simultaneous saccharification and fermentation, Saccharification; enzymatic or acid hydrolysis of cellulose and hemicellulose,
Fermentation; conversion of sugars to ethanol by yeast
Since lignocellulose biomass has a rigid and complex structure, it is not easily hydrolysed by enzyme or acid. Therefore the purpose of pretreatment step is to change the structure of the lignocellulose biomass to make cellulose more accessible and to promote the decomposition by subsequent saccharification. Various techniques are used for pretreatment such as physical treatment (milling, chipping, shredding, grinding irradiation and pyrolysis), chemical treatment (dilute acid, concentrated acid and alkali treatment), physicochemical treatment (steam explosion, ammonia fiber explosion, SO2 and CO2 explosion, liquid hot water, wet oxidation, organosolve, and ionic liquids), and biological treatment (using white, brown and soft rot fungi, and actiomycetes) (Hsu, T. A. et al., 1980; Saini, A. et al., 2015 ).
Pretreatment opens up the structure of lignocellulose by three effects: partial break down of its constituent polymers, weakening of hemicellulose and lignin heteromatrix and reducing the crystallinity of cellulose (Kumar, P. et al., 2009). When pretreatment is not carried out, the sugar yield is less than 20 %, but it is possible to increase sugar yield to about 90 % by pretreatment (Lynd, L. R., 1996).
After pretreatment, it follows that either enzymatic or acidic hydrolysis of cellulose
Lignocellulosic
biomass Pretreatment Saccharification Fermentation Distillation Ethanol
Saccharification / Fermentation
SHF
SSF
and hemicellulose to monomeric sugars. Finally the sugars are fermented to ethanol, and the produced ethanol is recovered by distillation (Fig. 1-1). Saccharification and fermentation are separately carried out in separate hydrolysis and fermentation (SHF) process. The advantage of this method is that because each reaction can be carried out under optimum conditions, reactivity is high. In addition saccharification is conducted at 50°C, so the risk of contamination with bacteria is low. On the other hand, there is disadvantage that equipment cost is high due to the large number of equipment. Simultaneous saccharification and fermentation (SSF) is a process of simultaneously carrying out saccharification and fermentation in one reactor. Equipment costs can be reduced because the number of equipment is small, but reactivity decreases because enzymatic saccharification is carried out at low temperature, approximately 30°C, in accordance with fermentation.
1.2 Lignocellulose biomass
1.2.1 Compositions of lignocellulose biomass
Lignocellulose biomass has gained attention as a raw material for petroleum replacement products such as bioethanol and bio-plastic (Himmel, M. E. et al., 2007).
Lignocellulose biomass is composed of three components; cellulose, hemicellulose and lignin and these are the most abundant and organic resources on the earth. It is said that the ratio of these components differs on biomass species. The composition ratio is generally as follows.
Cellulose is about 50%, subsequently hemicellulose is 20-25% and lignin is 25-30%
(Eriksson, K. E. et al., 1990). Cellulose and hemicellulose are polysaccharides and used as raw materials for bioethanol and bioplastic. On the other hand, since lignin is aromatic compounds and cannot be used as a raw material for them, it is burned and recovered as a
heat source and is often used as an energy source for maintaining the process.
1.2.2 Properties of cellulose and hemicellulose
Cellulose is the most abundant polysaccharide on earth, whose total amount has been estimated around 7×10¹¹tons (Coughlan, M., 1985) and the structure of cellulose is a linear homopolymer of beta-1, 4-linked glucose residues. Thus when enzymes or other methods decompose cellulose completely, it produces glucose only.
Hemicellulose is the second abundant polysaccharide on earth and can be divided into four groups of structurally different polysaccharide type: xylans, mannans, xyloglucans and mixed linkage beta-glucan (Ebringerova, A. et al., 2005; Ebringerova, A., 2006). Xylan is the most abundant component of hemicellulose for most species of land plants (Joseleau, J.
P., et al., 1992). The structure of xylan is heteropolymer consisting of main chain of 1, 4-linked beta-D-xylopyranose unit substituted with mainly acetyl, arabinofuranosyl and glucuronosyl residue. Hemicellulose of hardwoods and herbaceous plants is mainly xylan.
While hardwoods and herbaceous plants have weaker lignin structure compared to softwoods hence require less energy and cost to remove it, they are currently considered as raw materials for lignocellulosic ethanol.
1.3 Self-cloning
1.3.1 Differences between “non-self-cloning” and “self-cloning”
There are two kinds of genetic modification technologies classified by the source of genes; non-self-coning and self-cloning (Akada, R., 2002). Non-self-cloning yeast has
“foreign” genes or DNA sequences that have altered using genetic engineering techniques
such as recombinant DNA technology, it is regarded as a genetically modified organism (GMO) and subjected to controls and limitations when it is used. On the other hand, self-cloning yeast does not contain heterologous genes, and consists only of genes from the yeast itself and closely related species, in general the same species of the same genus.
Definitions and treatment of self-cloning yeasts differ by country and region; some countries do not regard self-cloning yeasts as GMOs (Hino, A., 2002). The followings are examples of not treated as GMOs. In Japan, the definition of GMO in the Cartagena domestic law is the same as the text of Cartagena Protocols of living modified organisms resulting from modern biotechnology. Recombinant microorganisms obtained using self-cloning or natural occurrence are exempt from restrictions imposed by the Cartagena domestic law (Kasai, Y. et al., 2015). In Australia, the Gene Technology Act 2000 provides the GMO definition and the Gene Technology Regulations 2001 include a list of techniques that are not considered to be gene technology and a list of organisms that are not GMOs (Lusser, M. and Davies, H. V., 2013). Some kinds of organisms with genes introduced from the same species without T-DNA borders and other foreign DNA would not fall under Australian GM-definition (Holme, I. B. et al., 2013).
1.3.2 Advantages of self-cloning
Many papers reported the construction of self-cloning yeast and the results of fermentation evaluations (Ishida-Fujii, K. et al., 1998; Hirosawa, I. et al., 2004; Aritomo, K.
et al., 2004; Takagi, H. et al., 2007; Wang, Z. Y. et al., 2007, 2008, 2009; Iijima, K. and Ogata, T., 2010; Dahabieh, M. S. et al., 2010; Kusunoki, K. and Ogata, T., 2012; Ogata, T. et al., 2013). All the above-mentioned papers relate to the fermented industries like brewing, vinification and sake or wine production, since the commercial application of GMOs is
problematic because of the lack of public acceptance (Schilter, B. et al., 2002; Falk, M. et al., 2002). The reason why GMOs cannot gain public acceptance is thought to be that due to fear of toxic or allergenic products expressed by foreign genes or bacterial sequences introduced into GMOs (Jonas, D. A. et al., 2001). Because of these backgrounds, self-cloning is one solution to obtain public acceptance using genetically modified yeast. In addition, there is another big advantage for the use of self-cloning yeast. As mentioned at 1.3.1 Differences between “non-self-cloning” and “self-cloning”, since self-cloning yeast is not recognized as GMOs in Japan, it is unnecessary to contain yeast containment and diffusion prevention measures in Japan. Although the establishment of self-cloning yeast has large restriction in the origin of genes, compared with genetically modified yeast, it has a very significant meaning to ensure profitability of the ethanol production process that the fact containment of yeast and diffusion prevention measures are unnecessary when producing inexpensive substances such as ethanol.
1.4 Xylose fermentation
1.4.1 Microorganisms considered for ethanol fermentation
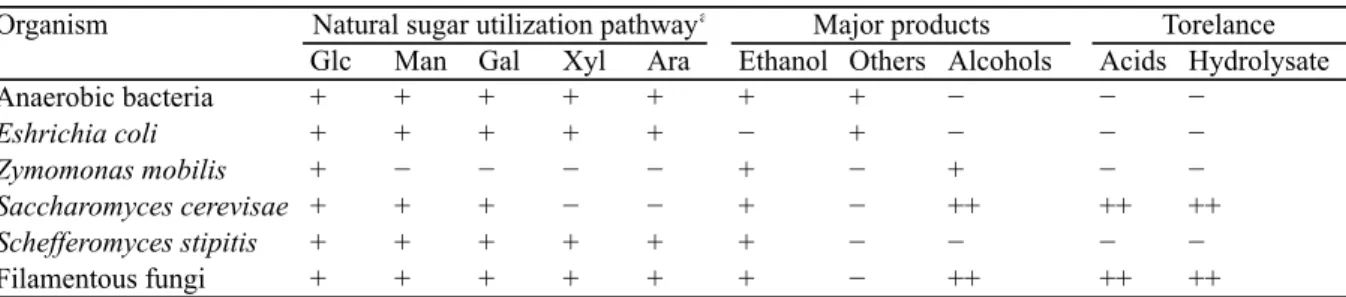
As described above, because glucose is the most abundant sugar and xylose is the second abundant sugar in softwoods and herbaceous plants, converting not only glucose but also xylose to ethanol is necessary for economically competitive fuel ethanol production from lignocellulose (von Sivers, M. and Zacchi, G., 1995). In nature, there are many bacteria, yeast and filamentous fungi that can ferment xylose to ethanol (Jeffries, T. W., 1983; Toivola, A. et al., 1984; Skoog, K. and Hahn-Hägerdal, B., 1990). The substrate and product ranges of microorganisms most frequently considered for ethanolic fermentation of lignocellulosic
biomass are summarized in Table1-1 (Hahn-Hägerdal, B. et al., 2007). Anaerobic bacteria can ferment all sugars that derived from lignocellulose hydrolysate to ethanol, other solvents and acids (Wiegel, J. and Ljungdahl, L. G., 1986). However, since ethanol-producing bacteria are weak against lignocellulose-derived inhibitors, a detoxification step is required before fermentation (Hahn-Hägerdal, B. et al., 1994). Escherichia coli can also ferment all sugars derived from lignocellulose hydrolysate, and it is said that recombinant E. coli are the most efficient bacteria for fermentation of detoxified lignocellulose hydrolysate (Ingram, L. O. et al., 1987; Hespell, R. B. et al., 1996; Bothast, R. J. et al., 1999; Dien, B. S. et al., 2003). The characteristic of Zymomonas mobilis is to produce ethanol in stoichiometric yield (Swings, J.
and DeLey, J., 1977), but its substrate range is limited. Recombinant xylose- and arabinose-fermenting strains have been constructed (Zhang, M. et al., 1995; Deanda, K. et al., 1996; Mohagheghi, A. et al., 2002). However it is still necessary to impart the ability to Z.
mobilis to metabolize mannose and galactose contained in lignocellulosic biomass. Aerobic filamentous fungi have industrial substrates tolerance and ferment pentose sugars, but the sugars consumption rate and product formation rates are low (Skoog, K and Hahn-Hägerdal, B., 1988; Hahn-Hägerdal, B. et al., 1994). It is known that some species of anaerobic filamentous fungi can produce ethanol, in addition to acids and hydrogen (Wu J. F. and Ljungdahl, L. G., 1986; Boxma et al., 2004; Panagiotou et al., 2006), and they are used in industrial scale fermentation for antibiotics and acids production (Atkinson B. and Mavituna, F, 1991) However, the ethanol tolerance of these organisms are poor.
Table 1-1 Characteristics of various natural microorganisms with regard to industrial ethanol production
a Sugars are abbreviated as follows: Glc, Glucose; Man, Mannose; Gal, Galactose; Xyl, Xylose; Ara, Arabinose
1.4.2 Metabolic engineering of Saccharomyces cerevisiae for xylose fermentation
The yeast Saccharomyces cerevisiae is highly effective for the production of ethanol from glucose and possesses tolerance toward high ethanol concentrations and other inhibitory compounds (Almeida, J. R. et al., 2007; Lau, M. W. et al., 2010). Moreover, it is used for the fermentation industry for a long time, and regarded as being safe. It is classified as GRAS, Generally Recognized As Safe (Fischer, S. et al., 2013). Since S. cerevisiae can grow and produce ethanol on xylulose but, not on xylose (Chiang, L. C. et al., 1981; Richard, P. et al., 2000; Ueng, P. P. et al., 1981; Wang P. Y. and Schneider, H., 1980), many researchers have tried to develop an engineered S. cerevisiae that is able to convert xylose to ethanol.
Heterologous expression of the xylose reductase (XR) and xylitol dehydrogenase (XDH) genes from natural xylose fermenting yeast such as Scheffersomyces (Pichia) stipites are often used to introduce xylose-fermenting ability to S. cerevisiae (Kötter, P. and Ciriacy, M., 1993; Ho, N. W. et al., 1998; Karhumaa, K. et al., 2007). Xylose is first reduced to xylitol by XR coding by XYL1 gene, and then xylitol is oxidized to xylulose by XDH coding by XYL2
Organism
Glc Man Gal Xyl Ara Ethanol Others Alcohols Acids Hydrolysate
Anaerobic bacteria + + + + + + + − − −
Eshrichia coli + + + + + − + − − −
Zymomonas mobilis + − − − − + − + − −
Saccharomyces cerevisae + + + − − + − ++ ++ ++
Schefferomyces stipitis + + + + + + − − − −
Filamentous fungi + + + + + + − ++ ++ ++
Natural sugar utilization pathwaya Major products Torelance
gene. Xylulose is phosphorylated by xylulokinase (XK) to xylulose 5-phosphate (X5P) and metabolized into ethanol via the pentose phosphate pathway and glycolysis.
Although S. cerevisiae does not have xylose-utilizing ability, it possesses aldose reductase and XDH genes that are homologous to the XR and XDH genes, XYL1 and XYL2, from S. stipitis (Träff, K. L. et al., 2002; Richard, P. et al., 1999; Toivari, M. H. et al., 2004).
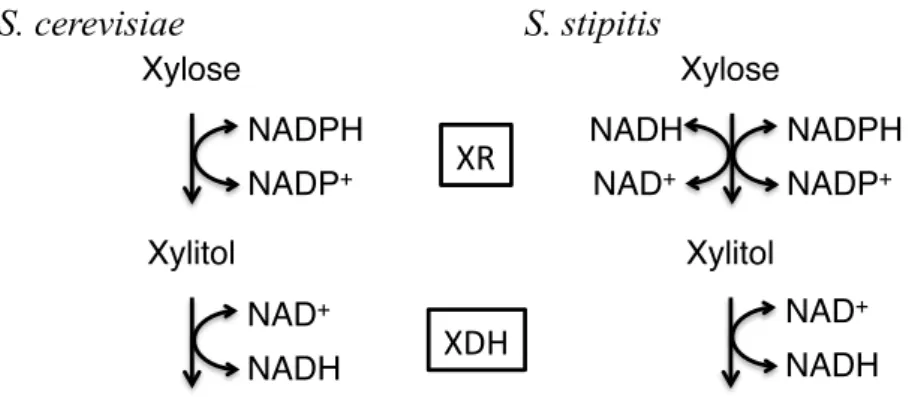
Six aldo-keto reductase genes, GRE3, YJR096w, YPR1, GCY1, ARA1 and YDL124w, are found in S. cerevisiae (Träff, K. L. et al., 2002). Among them, since deletion of the GRE3 gene reduced xylitol production, GRE3 gene was thought to be the main xylose-reducing enzyme in S. cerevisiae (Träff, K. L. et al., 2002). Three genes, XYL2, SOR1 and SOR2, which are similar to XDH gene from S. stipitis, are also found in S. cerevisiae (Richard, P. et al., 1999; Toivari, M. H. et al., 2004). Cofactor specificity of XR and XDH in S. cerevisiae and S. stipitis is summarized in Fig. 1-2 (Toivari, M. H. et al., 2004; Kuhn, A. et al., 1995).
While XR of S. cerevisiae uses only NADPH as cofactor, XR of S. stipitis can utilize both NADH and NADPH as cofactors of xylose reduction. XDH uses NAD as cofactor of xylitol dehydrogenation in both yeasts. Thus this leads to xylitol accumulation due to cofactor imbalance. In order to neutralize cofactor imbalance between XR and XDH, it was carried out that modifications of cofactor specificity of both enzymes by many researchers
(Bengtsson, O. et al., 2009; Jeppsson, M. et al., 2006; Matsushika, A. et al., 2008;
Petschacher, B. and Nidetzky, B., 2008; Runquist, D. et al., 2010; Watanabe, S. et al., 2007;
Zeng, Q. K. et al., 2009). This approach reduced xylitol production significantly, but about 15% of the consumed xylose was still secreted as xylitol even in the most successful mutants (Bengtsson, O. et al., 2009; Petschacher, B. and Nidetzky, B., 2008; Runquist, D. et al., 2010).
Fig. 1-2 Cofactor specificity of XR and XDH in S. cerevisiae and S. stipitis
Since XYL2 gene of S. cerevisiae showed the highest homology to XYL2 gene of S.
stipitis, the possibility of creating self-cloning xylose-using S. cerevisiae with GRE3 and XYL2 genes has been demonstrated (Toivari, M. H. et al., 2004). While XYL2 gene was not induced in the presence of xylose, SOR1 gene, coding for a sorbitol dehydrogenase that also has XDH activity, was induced (Sarthy, A. V., 1994). And also it is known that S. cerevisiae possesses XK activity and XKS1 gene, that encodes XK (Rodriguez-Pena, J. M. et al., 1998), and S. stipitis has XYL3 gene, that also encodes XK (Jin, Y. et al., 2002). Therefore it is sufficient to create self-cloning xylose-using S. cerevisiae by overexpression of three endogenous genes, GRE3, SOR1 and XKS1.
Another metabolic pathway of xylose is known in microorganism, especially in bacteria. Many bacteria use a xylose isomerase (XI) enzyme to convert xylose to xylulose directly and it does not need pyridine nucleotide as cofactors. Many researchers tried to express heterologous xylA gene, that encodes XI, in S. cerevisiae, but it was unsuccessful.
While putative xylA transcripts were detected in Northern blots, putative XI protein products were not solubilized and not active (Amore, R. et al., 1989; Gárdnyi, M. and Hahn-Hägerdal, B., 2003; Ho, N. et al., 1983; Moes, C. J. et al., 1996; Sarthy, A. V. et al., 1987; Walfridsson, M. et al., 1996). For this reason, the XR-XDH pathway has long been used to impart xylose
S. cerevisiae S. stipitis
Xylose Xylose
Xylitol Xylitol
NADPH NADP+
NADPH NADP+ NADH
NAD+
NAD+ NADH NAD+
NADH
XR
XDH
utilization ability to S. cerevisiae. However, the anaerobic fungus Piromyces sp. Strain E2 that metabolized xylose using the XI pathway was discovered (Harhangi, H. R. et al., 2003), and the XI from this organism was functionally expressed in S. cerevisiae (Kuyper, M. et al., 2003; Kuyper, M. et al., 2004). When the performance of XI and XR-XDH pathways were compared in same strains on minimal medium with xylose as a sole carbon source, the strain with XI pathway showed 30 % higher yield and the xylitol production was less (Karhumaa, K.
et al., 2007). However, the strain with XR-XDH pathway showed higher xylose consumption rate and specific ethanol productivity.
1.5 Metabolic pathway simulations
It has become a key activity to estimate the flow of metabolism within the cell in biotechnological applications such as biopharmaceutical industries, food industry, and chemicals production, which include fuels, in order to improve productivity of microorganisms. Metabolic pathway simulation is one of the most successful and useful approaches for improving the productivity of industrially relevant microorganisms during their cultivation (Bailey, J. E., 1991; Stephanopoulos, G. and Vallino, J. J., 1991; Vallino, J. J.
and Stephanopoulos, G., 1993; Kuriya, Y. et al., 2011). Flux balance analysis (FBA) and metabolic flux analysis (MFA) are two of most frequently used methods (Chen, X. et al., 2011). FBA is in silico simulation that uses a genome-scale stoichiometry and measured extracellular fluxes, and MFA is in vivo analysis that measures fluxes by using isotope experimental data along with simplified model mainly such as central carbon stoichiometry and measured extracellular fluxes (Martin, H. G. et al., 2015).
FBA is an analysis method of metabolic flux that covers the entire targeted metabolic pathway based only on stoichiometry, while dynamic analysis of metabolism and
relation between metabolite concentration and reaction rate cannot be dealt with (Kauffman, K. J. et al., 2003; Palsson, B. Ø., 2006; Orth, J. D. et al., 2010). That is, when predicting metabolic flux in FBA, it is placed the assumption that metabolism is in steady state. It means a state in which intermediates and metabolic flux in cells are constant without being changed over the time. This is an unrealistic assumption for a batch culture with time change, a nonsteady state, while it is considered to be a realistic assumption for continuous culture where steady state without time change is obtained. Furthermore in FBA, the metabolic pathway is described by algebraic equations, but the solution is calculated under the assumption that the cell regulates its metabolism so as to maximize the cell growth under a given environment.
MFA is a systematic and general approach to assess the roles of individual steps in a extensive metabolic pathway network. In particular, MFA is an experimental-based method of obtaining data on internal metabolites and metabolic fluxes by labeling experiments using isotopes (Stephanopoulos, G. et al., 1998; Sauer, U. et al., 1999; Wiechert, W., 2001;
Nanchen, A. et al., 2007; Zamboni, N. et al., 2009). Microorganisms are cultured on 13C labeled substrates and analytical chemical techniques such as GC-MS and LC-MS obtain the labeling of metabolic end products. Internal fluxes are estimated based on the measurements of labeled metabolite data and external fluxes. The resulting metabolic flux maps quantitatively show flow through metabolism. However, MFA also includes the assumption that metabolism is steady state, so in order to assess the metabolic fluxes of the reactions that include a nonstationary state, it is necessary that dynamic analysis taking time change into account. Therefore, although MFA was extended to Dynamic metabolic flux analysis (DMFA) taking time change into consideration, it still contains an assumption that intracellular metabolite concentration is constant (Antoniewicz, M. R., 2013). Hence it is
difficult to adapt to cases where metabolic intermediates change rapidly. In addition, FBA is also expanded to Dynamic flux balance analysis (DFBA) based on the same way of thinking (Mahadevan, R. et al ., 2002).
1.6 Aim of this study
This study aimed to construct recombinant xylose-using S. cerevisiae strains by endogenous xylose-assimilating genes utilization (self-cloning). In addition, in order to improve the ethanol productivity of self-cloning S. cerevisiae, a kinetic model of ethanol production pathway from xylose was constructed and a metabolic bottleneck reaction was estimated by sensitivity analysis. Furthermore, according to the estimation of the bottleneck reaction in the ethanol production pathway was eliminated by gene modification. The gene modification effect was validated and examined by fermentation evaluations.
CHAPTER 2
Construction of xylose-using S. cerevisiae
by endogenous genes utilization (self-cloning)
2.1 Introduction
Saccharomyces cerevisiae is traditionally used in various industries, especially for ethanol production, because S. cerevisiae has high tolerance toward ethanol and other
inhibitory compounds (Almeida, J. R. et al., 2007; Lau, M. W. et al., 2010). And also, it has been studied for many years as a eukaryotic model organism, and accumulated gene
information and tools for various genetic modifications are available. As mentioned in Chapter 1, ethanol production from xylose as well as glucose is also necessary to reduce ethanol production costs and to establish ethanol production economically. In order to impart xylose utilization ability to S. cerevisiae, it is common to use XR and XDH derived from naturally xylose-fermenting yeast Scheffersomyces (Pichia) stipitis (Kötter, P. and Ciriacy, M., 1993; Ho, N. W. et al., 1998; Karhumaa, K. et al., 2007). However, when genes derived from another microorganism are introduced, it corresponds to genetically modified organisms (GMOs). When it falls under the GMOs, measures to prevent the diffusion of yeasts are required, and the equipment cost for diffusion prevention is high. Thus, the manufacturing cost of ethanol plant becomes also high, and it is reflected in the ethanol cost. Although S.
cerevisiae cannot utilize xylose naturally, it is known that it possesses genes, aldose reductase (GRE3) and sorbitol dehydrogenase (SOR1), that are homologous to the xylose-assimilating genes of S. stipitis (Träff, K. L. et al., 2002; Richard, P. et al., 1999; Toivari, M. H. et al., 2004).
In this chapter, therefore, to realize ethanol production using self-cloning yeast, xylose-using S. cerevisiae by endogenous genes utilization, GRE3 and SOR1, was
constructed and it was compared that the ethanol fermentation performance of endogenous genes utilized S. cerevisiae and engineered S. cerevisiae with XR (XYL1) and XDH (XYL2) genes from S. stipitis.
2.2 Materials and methods
2.2.1 Plasmid and strain construction
Xylose-using Saccharomyces cerevisiae by endogenous genes utilization was constructed as follows. The industrial Sake yeast S. cerevisiae Kyokai No.7 (K7) was used for host strain. GRE3, SOR1, XK gene (XKS1), and a phosphoglycerate kinase gene (PGK1) promoter and a terminator were amplified from the genomic DNA of S. cerevisiae CEN.
PK.2-1C. Xylose reductase (SsXYL1) and Xylitol dehydrogenase (SsXYL2) from
Scheffersomyces stipitis were amplified from the genomic DNA of S. stipitis NBRC 1687.
For the construction of the xylose-using gene expression cassette, the GRE3, SOR1 and XKS1 genes were cloned into the SalI site located between the PGK1 promoter and terminator introduced into pUC18 (Takara, Shiga, Japan). The GRE3, SOR1 and XKS1 with the PGK1 promoter and terminator were digested with EcoRI and SphI. Digested fragments were introduced in tandem into pUC18 by blunt-end ligation to create pUC-XYL.
For the preparation of K7-SsXYL, XKS1 with a PGK1 promoter and a terminator was ligated into pUC18 to yield pUC18-XKS1. Then, SsXYL2 with a PGK1 promoter and a terminator was blunt-ligated into the Bam HI site of pUC-XKS1 to yield
pUC-SsXYL2-XKS1. Finally, SsXYL1 with a PGK1 promoter and a terminator was blunt-ligated into the Sma I site of pUC-SsXYL2-XKS1 to yield pUC-SsXYL.
The pUC-XYL and the pUC-SsXYL were digested with PvuII and ligated into pAUR135 (Takara) which was digested with SmaI to yield pAUR-XYL and pAUR-SsXYL.
pAUR-XYL and pAUR-SsXYL were digested with StuI and transformed into K7 to produce K7-A-XYL and K7-A-SsXYL respectively. Yeast transformation was carried out by the lithium acetate method (Giets, D. et al., 1992). For selection of transformants, 0.5 mg/L
aureobasidin A (Takara) was added to YPD agar plates. Synthetic complete (SC) medium containing 6.7 g/L yeast nitrogen base was used for yeast transformants selection.
Escherichia coli JM109 was used for cloning of plasmids and grown at 37°C with shaking at 140 rpm in LB medium (yeast extract 5 g/L, tryptone 10 g/L, NaCl 5g/L).
2.2.2 Culture conditions
For precultivation of yeast cells, YP medium (yeast extract 10 g/L, peptone 20 g/L) with glucose 20 g/L was used. Yeast cells were harvested by centrifugation, washed twice with sterile distilled water to remove traces of glucose and ethanol, then suspended in an appropriate amount of the water. Batch fermentations were carried out in 200-mL baffled shaken flasks (with a filtered silicone plug to avoid ethanol evaporation), at 30°C with shaking at 140 rpm in CBS medium (ammonium sulfate 7.5 g/L, magnesium sulfate heptahydrate 0.75 g/L, potassium dihydrogenphosphate 3.5 g/L, potassium hydrogen phthalate 10.2 g/L; pH 5.0). Each flask contained 70 g/L glucose and 50 g/L xylose as the carbon sources and the initial concentration was 2×10⁸ cells/mL. The flask fermentation was carried out in duplicate. The sampling frequency was 0, 2, 4, 6, 24, 30, 48, 54, 72 h and the sampling volumes were 0.6 mL.
2.2.3 Extracellular metabolites analysis
Concentrations of xylose, ethanol, glycerol, xylitol, and acetate in culture supernatants were determined with a high-performance liquid chromatography system (Shimadzu, Kyoto, Japan) equipped with a SUGAR SP0810 column (Shodex, Tokyo, Japan) using water as the mobile phase at a flow rate of 0.8 mL/min and 80°C.
2.3 Results
Flask-scale cultures of strains K7-A-XYL, integrated GRE3, SOR1 and XKS1 from S.
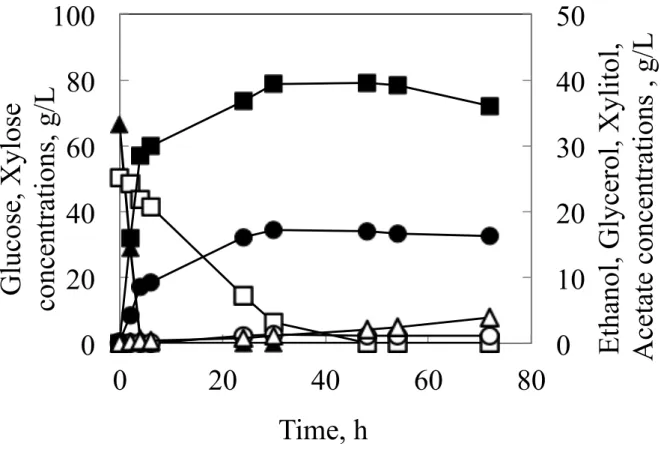
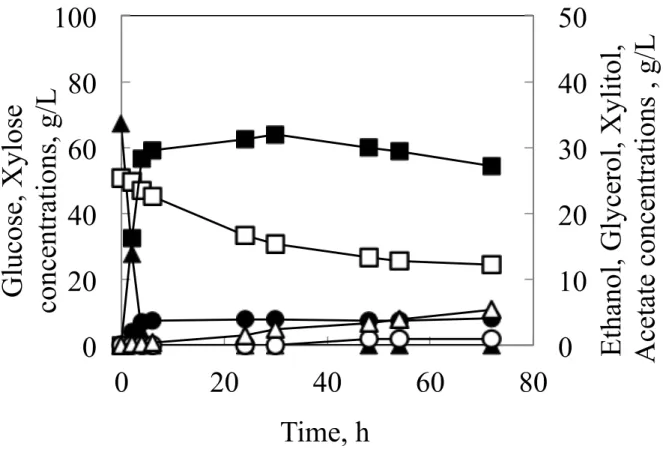
cerevisiae, and K7-A-SsXYL, XYL1 and XYL2 from S. stipitis and XKS1 from S. cerevisiae, were grown in 200-mL baffled shaken flasks containing CBS medium with initial glucose concentration of 70 g/L and xylose concentration of 50 g/L (Fig. 2-1 and Fig. 2-2). All the glucose was converted to ethanol within 6 h in both strains. While regarding the consumption of xylose, both strains showed different profiles. Although K7-A-XYL consumed xylose at a rate of 1.5 g/L h and exhausted all the xylose within 48 h, K7-A-SsXYL converted xylose to ethanol at a rate of 0.73 g/L h and only about 50 % of the xylose was consumed even after 72 h of fermentation. As a result K7-A-XYL produced more ethanol compared to K7-A-SsXYL (K7-A-XYL 37.6 g/L, K7-A-SsXYL 32.0 g/L). Furthermore although both strains did not accumulate much xylitol, less than 1.0 g/L, the glycerol and acetic acid production of both strains were significantly different. K7-A-SsXYL produced 8.1 g/L glycerol and 5.3 g/L acetate, while K7-A-XYL produced 17.2 g/L glycerol and 3.9 g/L acetate respectively.
Fig. 2-1 Fermentation profiles of flask cultures of strains K7-A-XYL in CBS medium containing 70 g/L glucose and 50 g/L xylose as the carbon sources. Results were based on two replications. Deviation was below 10 % of the average.
Glucose, closed triangles; Xylose, open squares; Ethanol, closed squares; Xylitol, open circles; Glycerol, closed circles; Acetate, open triangles.
0 10 20 30 40 50
0 20 40 60 80 100
0 20 40 60 80
Time, h
G luc os e, X yl os e conc ent ra ti ons , g/ L E tha nol , G lyc erol , X yl it ol , A ce ta te c onc ent ra ti ons , g/ L
Fig. 2-2 Fermentation profiles of flask cultures of strains K7-A-SsXYL in CBS medium containing 70 g/L glucose and 50 g/L xylose as the carbon sources. Results were based on two replications. Deviation was below 10 % of the average.
Glucose, closed triangles; Xylose, open squares; Ethanol, closed squares; Xylitol, open circles; Glycerol, closed circles; Acetate, open triangles.
0 10 20 30 40 50
0 20 40 60 80 100
0 20 40 60 80
Time, h
G luc os e, X yl os e conc ent ra ti ons , g/ L E tha nol , G lyc erol , X yl it ol , A ce ta te c onc ent ra ti ons , g/ L
2.4 Discussion
Two xylose-using S. cerevisiae were constructed. One was endogenous genes utilized S. cerevisiae (K7-A-XYL), which possessed GRE3 and SOR1 genes. The other was engineered S. cerevisiae (K7-A-SsXYL) with XYL1 and XYL2 genes from S. stipitis.
Comparing the ethanol production amount of both strains, it is strongly suggested that K7-A-XYL showed higher ethanol productivity, and that sufficient xylose utilizing ability could be given even by utilization of the endogenous genes. This suggests that ethanol production from lignocellulose biomass, which contains much xylose, may be realized.
Ethanol production rate of K7-A-SsXYL was slow and it seemed that it stopped xylose consumption after 48 h. K7-A-SsXYL produced a large amount of acetic acid; 5.31 g/L in 72 h. This may be one reason of the slow ethanol production and suspension of xylose utilization, since it is known that acetic acid concentration at 0.05-0.1 % w/v begins to stress the S. cerevisiae as seen by reduced growth rates and decreased rates of ethanol production as the concentration of acetic acid in the media raised (Narendranath, N. V. et al., 2001). And also it is reported that acetic acid concentration at 0.5 % w/v inhibits xylose consumption (Limtong, S., et al., 2000).
In order to convert xylitol to xylulose by the reaction of SOR1 and XYL2, the supply of NAD+ as a cofactor is considered to be essential as shown in chapter 1. XYL1 from S.
stipitis can utilize both NADH and NADPD as cofactors of xylose reduction, whereas GRE3 uses only NADPH (Toivari, M. H. et al., 2004; Kuhn, A. et al., 1995). Therefore it was considered that K7-A-SsXYL has more advantage than K7-A-XYL in terms of xylitol accumulation and smooth metabolic flow from xylose to ethanol, since the cycles of NAD+ and NADH rotate between XYL1 and XYL2. Unexpectedly, there was no difference in the production of xylitol in both strains, and the xylitol production amount was very small, less
than 1.0 g/L. The reason that low xylitol production in K7-A-XYL may be presumably due to that sufficient NAD+ regeneration has occurred by adequate oxygen supply in this culture condition. Since NAD+ regeneration is closely related to the dissolved oxygen in the culture medium, it seems to be important to control the culture conditions with a focus on dissolved oxygen concentration.
CHAPTER 3
Construction of kinetic model of the ethanol production pathway of self-cloning
xylose-using S. cerevisiae
3.1 Introduction
Xylose-using S. cerevisiae (K7-A-XYL) by endogenous GRE3 and SOR1 genes utilization was constructed in Chapter 2. The xylose-using S. cerevisiae showed better ethanol producing performance than genetically modified S. cerevisiae (K7-A-SsXYL) with XYL1 and XYL2 genes from S. stipitis in this culture conditions. The ethanol yield (g ethanol/
g sugars) of strain K7-A-XYL was 0.34. Ethanolic fermentation of starch and sugar generally reaches 0.45-48 g ethanol/ g sugars, equivalent to 90-95% of the theoretical yield
(Hahn-Hägerdal, B. et al., 2007). Therefore further enhancement of the ethanol productivity of self-cloning yeast is necessary. Cost analysis of the ethanol fermentation from
lignocellulose biomass showed that approximately one-third of the manufacturing cost is raw material cost (von Sivers, M. and Zacchi, G., 1996; Galbe, M. and Zacchi, G., 2002; Wingren, A. et al., 2003). Thus conversion of all sugars to ethanol and increasing ethanol productivity are important for the cost effectiveness of the process (Carroll, A. and Somerville, C., 2009;
Stephanopoulos, G., 2007).
Metabolic pathway simulation is one of the most successful and useful approaches for improving the productivity of industrially relevant microorganisms during their
cultivation as descried in Chapter 1. Based on predictions by simulation, it is expected that gene manipulation candidates for improving ethanol productivity can be efficiently extracted.
In addition extraction of candidate genes by simulation is particularly effective for assessing the influence of combining multiple genetic modifications. Although the metabolic pathway simulations on xylose-using pathway have been performed on genetically modified yeasts before (Wahlbom, C. F. et al., 2001; Pitkansen J.P. et al., 2003; Sonderegger, M. et al., 2004;
Grotkjaer, T. et al., 2005; Parachin, N. S. et al., 2011; Matsushika, A. et al., 2013; Wasylenko, T. M. and Stephanopoulos, G., 2015), such analysis has not been conducted so far on
self-cloning yeasts. Genetically modified yeasts and self-cloning yeasts have different genes used to metabolize xylose, and because of different coenzyme specificities, their metabolic behaviors are considered to be different. And also the time change of metabolites was not considered in the conventional metabolic pathway simulation as detailed in Chapter 1.
The definition of self-cloning is that it does not contain heterologous genes, and consists only of genes from the organism itself and closely related species. According to this definition, since K7-A-XYL constructed in Chapter 2 contains pARU135 (Takara, Shiga, Japan) vector sequences, the yeast is not a self-cloning S. cerevisiae. Therefore, the method of preparing the strains needs to be changed, and sequences constituted only from S.
cerevisiae should be used to impart xylose utilization capability without containing vector-derived sequences.
Ethanol yield from starch and glucose is nearly close to the theoretical value, and it remains little improvement in margin. On the other hand, since the ethanol yield from xylose is still low, it needs to be more improvement. Thus the improvement of ethanol yield from xylose is the target in this study. In this chapter, the culture supernatant and intracellular metabolites of self-cloning xylose-using S. cerevisiae, which does not contain vector sequences, were analyzed in xylose culture and a kinetic model of the ethanol production pathway from xylose was constructed. Then, sensitivity analysis was carried out to identify a metabolic bottleneck reaction and manipulated a gene corresponding to the bottleneck reaction.
3.2 Materials and methods
3.2.1 Plasmid and strain construction
The strain used for the experimental data collection of the kinetic model constructions was K7-XYL. K7-XYL was constructed as follows. The industrial Sake yeast S.
cerevisiae K7 was used for host strain. Construction of the xylose assimilating gene expression cassette, XR, XDH and XKS with a PGK1 promoter and a terminator was described previously (Konishi, J. et al., 2015). The expression cassette with EcoRI and HindIII restriction sites was introduced into the multiple cloning site of pUC18 (Takara, Shiga, Japan) to create pUC-XYL. XYL2 was amplified from the genomic DNA of strain K7 with a SmaI restriction site and introduced into SmaI-digested pUC18 to create pUC-XYL2.
pUC-XYL and pUC-XYL2 were digested with EcoRI and HindIII, and ApaI respectively.
The fragments were blunted and ligated to create pUC-XYL2-XYL-XYL2.
pUC-XYL2-XYL-XYL2 was digested with SmaI and transformed into K7 to produce strain K7-XYL. Yeast transformation was carried out by the lithium acetate method (Giets, D. et al., 1992). Synthetic complete (SC) medium containing 6.7 g/L yeast nitrogen base was used for yeast transformants selection. Escherichia coli JM109 was used for cloning of plasmids and grown at 37°C with shaking at 140 rpm in LB medium (yeast extract 5 g/L, tryptone 10 g/L, NaCl 5g/L).
3.2.2 Culture conditions
The strain used for the experimental data collection of the kinetic model constructions was K7-XYL described in 3.2.1 Plasmid and strain construction.
For precultivation of yeast cells, YP medium (yeast extract 10 g/L, peptone 20 g/L) with glucose 20 g/L was used. Batch fermentations were carried out in 500-mL baffled shaken flasks, with a filtered silicone plug to avoid ethanol evaporation, at 30°C with shaking at 140 rpm in YP medium (pH 5.0). Each flask contained 50 g/L xylose as the carbon source and the initial concentration was 2×10⁸ cells/mL. The flask fermentation was carried out in duplicate.
The sampling frequency was 0, 1, 2, 3, 6, 9, 24, 48 h and the sampling volumes were 1.6 mL.
3.2.3 Extracellular metabolites analysis
Concentrations of xylose, ethanol, glycerol, xylitol, and acetate in culture supernatants were determined with a high-performance liquid chromatography system (Shimadzu, Kyoto, Japan) equipped with a SUGAR SP0810 column (Shodex, Tokyo, Japan) using water as the mobile phase at a flow rate of 0.8 mL/min and 80°C. Cell density was measured by optical density measurement at 600 nm (OD600) using a UV1800
spectrophotometer (Shimadzu). Cell growth was calculated using a predetermined correlation with OD600.
3.2.4 Intracellular metabolites analysis
Intracellular metabolites were quantitated using liquid chromatography/triple-stage quadrupole mass spectrometry (LC-QqQ-MS). Metabolite analysis with LC-QqQ-MS was performed as previously described (Kiyonari, S. et al., 2015), and samples were prepared as follows. For quenching, 1 mL cell culture was injected into a 15-mL Falcon tube containing 5 mL pure methanol precooled to −20°C and mixed by inversion. Subsequently, samples were centrifuged at 15000 × g at −9°C for 2 min, and the supernatant was discarded. The pellets were washed with 3 mL precooled water and centrifuged at 15000 × g at −9°C for 2 min.
Samples were stored at −80°C until metabolite extraction. For metabolite extraction, the pellets were resuspended in 1 mL 100% methanol containing 6 µM (+)-10-camphor sulfonic acid (Tokyo Chemical Industry, Tokyo, Japan) as an internal standard and transferred to a 1.5-mL tube that contained 2 mm zirconia beads. The cell suspension was disrupted using a bead cell disrupter MS-100R (TOMY, Tokyo, Japan) at 3000 rpm and −9°C for 5 min. Then samples were centrifuged at 15000 × g at −9°C for 5 min, and supernatants were collected in a fresh 15-mL Falcon tube on ice. The pellets were resuspended in 1 mL 50% (v/v) methanol and disrupted again. Samples were centrifuged, and supernatants were added to the 15-mL Falcon tube containing the methanol extract already recovered. The collected supernatants were mixed with chloroform and water at a ratio of 1:1.5:1 and centrifuged at 15000 × g at
−9°C for 5 min. The aqueous phase of the extract was dried under vacuum (CVE-2000, EYELA, Tokyo and DTU-20, ULVAC, Kanagawa) and stored at −80°C until further use.
3.2.5 Model development
A mathematical model of ethanol production from xylose using xylose-assimilating S.
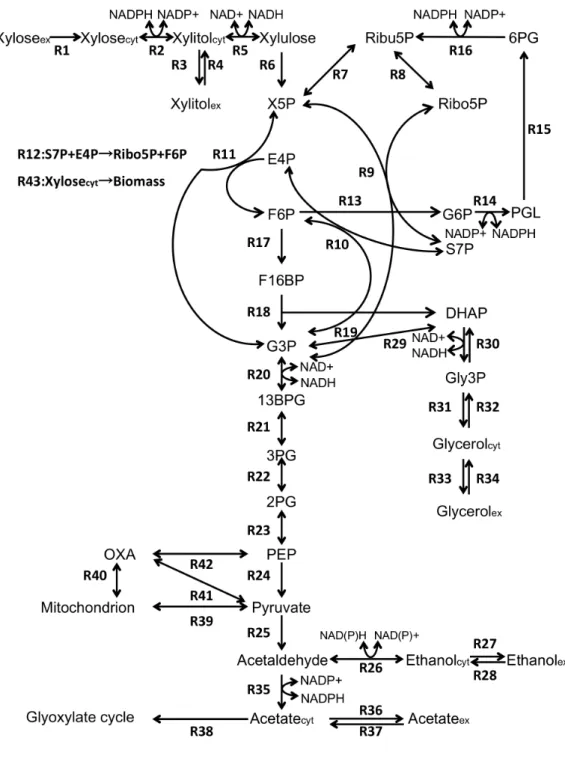
cerevisiae was constructed by an ordinary differential equation system with reference to previously reported models (Teusink, B. et al., 2000; Hynne, F. et al., 2001; Rizzi, M. et al., 1997). The range of the target metabolic pathway was shown in Fig. 3-1. The metabolic model includes the central carbon metabolism system, pentose phosphate pathway, xylose metabolism pathway, and glycerol, ethanol and acetic acid production pathways. Regarding the pathway that generates biomass, this study assumed a system in which xylose entrapped (Xylosecyt in Fig.3-1) flows into biomass (R43 in Fig. 3-1). The mathematical model consists of two compartments: extracellular (culture fluid) and intracellular (cytoplasm). The
intracellular metabolic reactions were described based on each enzyme reaction mechanism
(Cleland, W. W., 1963). The rate equations of reaction number (R1-R43) in mathematical model shown in Fig. 3-1 were described in Table 3-1. Sugar uptake was described by a Michaelis-Menten type equation based on the difference in concentration inside and outside the cell (Bertilsson, M. et al., 2008; Teusink, B. et al., 1998). Substance transport between the two compartments was described via linear equations. Concentration change in each
compartment because of the transport of substances inside and outside the cell was converted based on the yeast-specific cell volume 2.0 mL/g-dry cell weight (van Urk, H. et al., 1988).
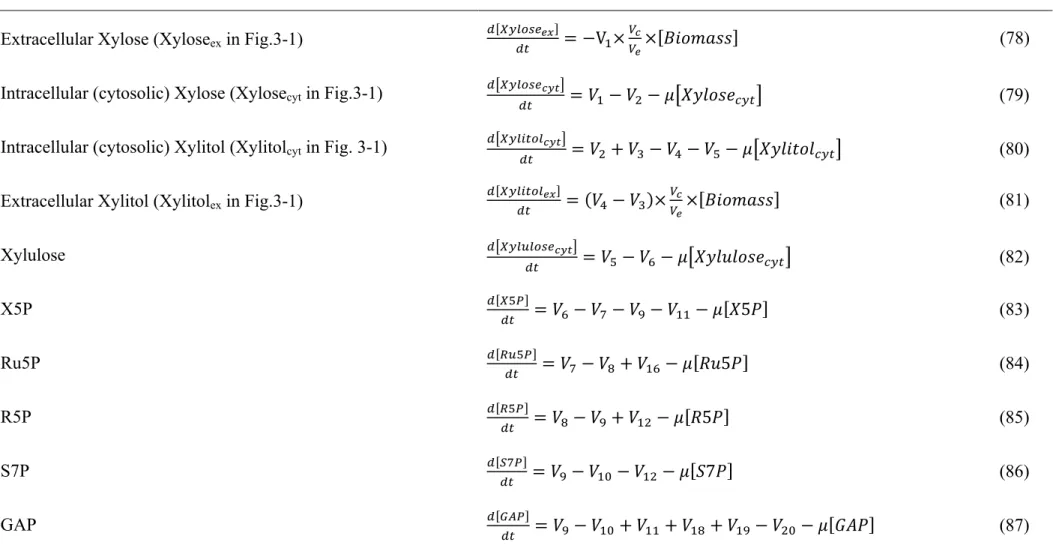
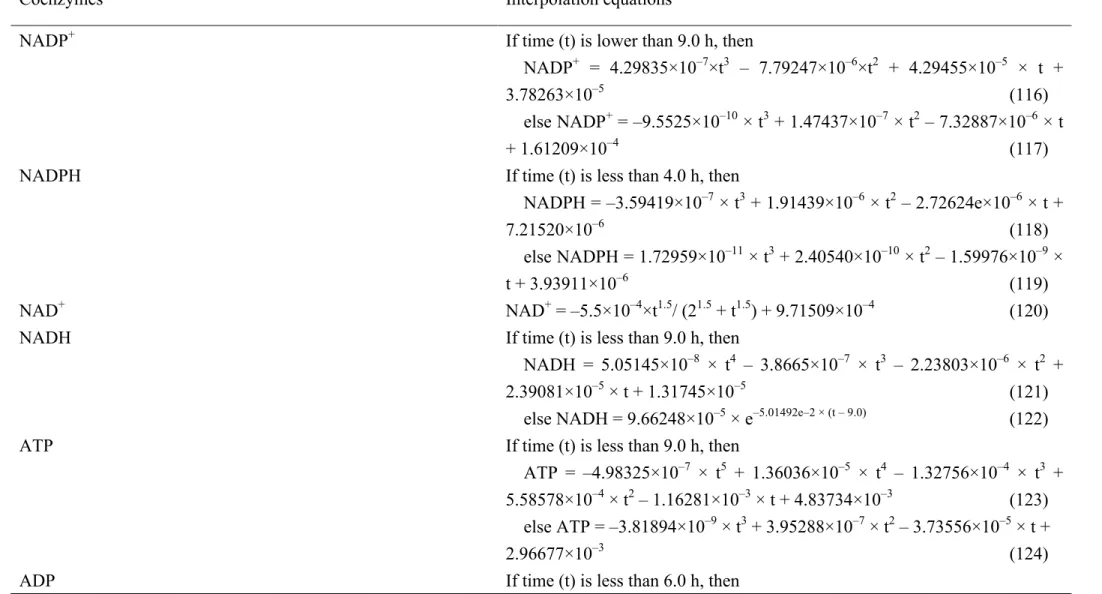
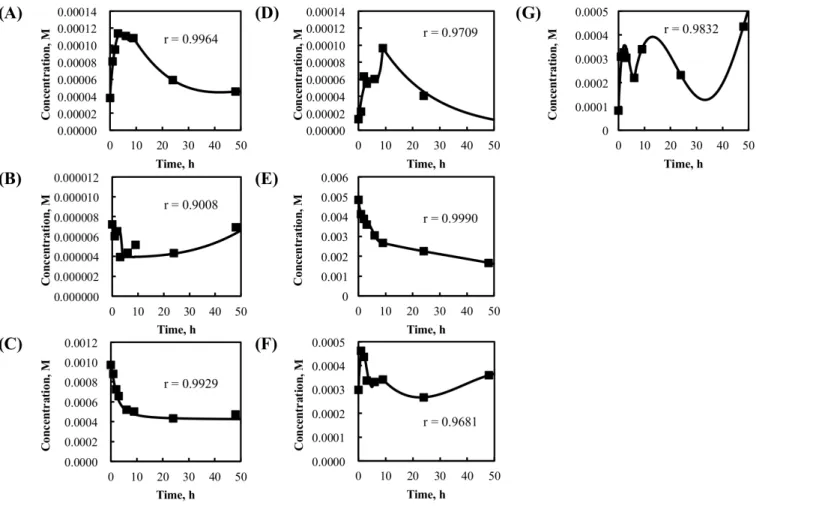
Mass balance of mathematical model shown in Fig. 3-1 was described in Table 3-2. Among the coenzymes included in the model, ATP, ADP, AMP, NAD+, NADH, NADP+ and NADPH concentrations were interpolated from experimental time course data and used for simulation in Table 3-3 and Fig. 3-2. Quinone, quinol, CoA, phosphoric acid and CO2 were assumed to be constant regardless of time in Table 3-2.
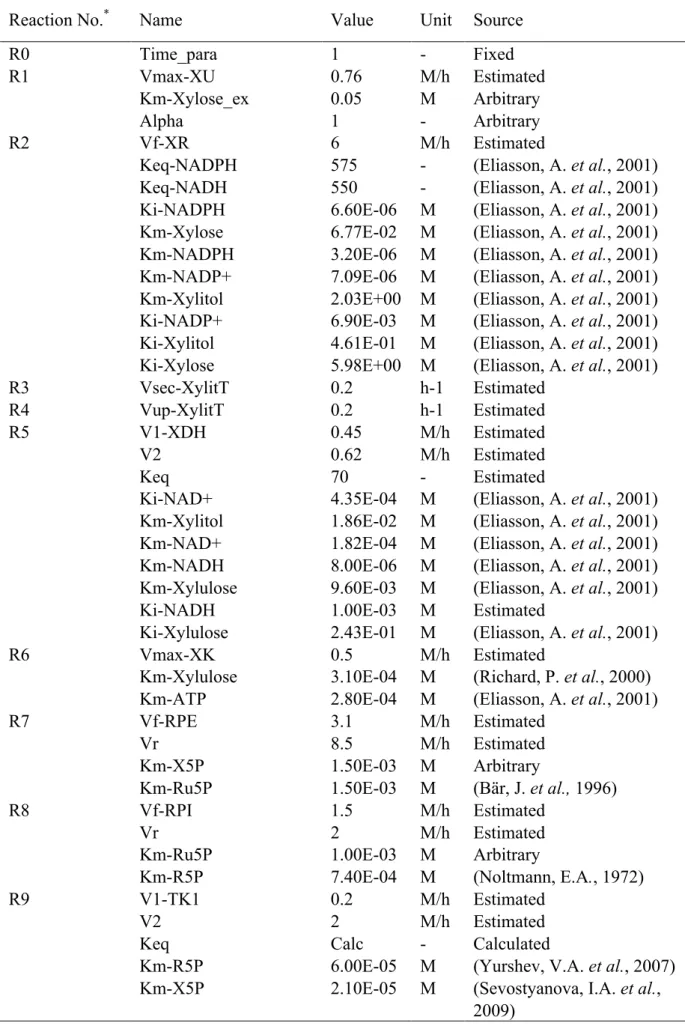
First, the kinetic parameter values for the mathematical model were investigated in enzyme reaction databases such as BRENDA (Schomburg, I. et al., 2013), and as many kinetic parameter values as possible were acquired in Table 3-4. Next, other parameters whose values were unknown were estimated using a real-valued genetic algorithm (Akimoto, Y. et al,, 2009) and manual operation to reproduce the experimental data obtained in flask culture with an initial xylose concentration of 50 g/L. Simulations were carried out with the Gear method (Gear, G. W., 1971). The initial values of dependent variables were listed in Table 3-5.
Forty-three reactions and forty-six metabolites were included in the mathematical model shown in Fig. 3-1. An original program developed in C language carried out the simulation. This model included allosteric regulations in 6-phosphofructokinase and pyruvate
kinase based on previous works (Teusink, B. et al., 2000; Rizzi, M. et al., 1997). Additionally cell growth rate equation had a term for growth shutdown to avoid excess growth in
simulation. For coenzymes, the time-course data of the coenzyme concentrations obtained by measurements were interpolated and expressed as the function of time t. As for the rest, constraints such as competitive inhibition by substrate(s) and/or product(s) and equilibrium constant were included based on enzyme kinetics and reactions.
3.2.6 Sensitivity analysis
Sensitivity analysis is a method for assessing the validity of a developed model and clarifying which pathway(s) have the most impact, in the present case on ethanol productivity.
The amount of ethanol production at 48 h was assessed in this study because all the xylose was consumed by 48 h.
The endpoint deviation (ED) of ethanol described below was assessed to reveal which reaction pathway(s) impact ethanol production. In this calculation, a 100% increase was assigned to each kinetic parameter in rate equations in the model; each kinetic parameter was tested individually in this way.
ED = 100 × ([Ethanol]change − [Ethanol]control)/[Ethanol]control
Where [Ethanol]change was the ethanol concentration at 48 h given a 100% increase in the kinetic parameter in the rate equation, and [Ethanol]control was the ethanol concentration without any change. The higher the absolute value of ED, the more a kinetic parameter affects the ethanol production. Various genetic manipulation strategies were developed based on the outcomes of this analysis.
Fig. 3-1 Metabolic pathway of ethanol production from xylose
Table 3-1 Rate equations of reaction number (R1 – R43) in mathematical model shown in Fig. 3-1
Reaction No. Rate equations
R1: Xylose uptake
R2: NADPH–dependent xylose reductase (Aldose reductase: Xylose → Xylitol)
R3: Xylitol secretion from intracellular space (cytosol) to extracellular space
R4: Xylitol uptake from extracellular space to intracellular space (cytosol)
R5: NAD+–dependent xylitol dehydrogenase (Sorbitol dehydrogenase: Xylitol → Xylulose)
V1 = V_Xylose_uptalose_uptake = Vmax_XU × (Xylose_ex – Xylose_cyt) / (Km_Xylose + Xylose_ex + Xylose_cyt +α× Xylose_ex × Xylose_cyt / Km_Xylose) (1)
V2 = V_XR = Vf_XR / (Ki_NADPH × Km_Xylose) × (NADPH_cyt × Xylose_cyt – Xylitol_cyt × NADP_cyt / Keq_NADPH) / (1.0 + Km_NADPH × Xylose_cyt / (Ki_NADPH × Km_Xylose + Km_NADP × Xylitol_cyt / (Km_Xylitol × Ki_NADP) + NADPH_cyt / Ki_NADPH + NADP_cyt / Ki_NADP + NADPH_cyt × Xylose_cyt / (Ki_NADPH × Km_Xylose) + Km_NADP × NADPH_cyt × Xylitol_cyt /(Ki_NADPH × Km_Xylitol × Ki_NADP) + Km_NADPH × Xylose_cyt × NADP_cyt / (Ki_NADPH × Km_Xylose × Ki_NADP) + Xylitol_cyt × NADP_cyt / (Km_Xylitol × Ki_NADP) + NADPH_cyt × Xylose_cyt × Xylitol_cyt / (Ki_NADPH × Km_Xylose × Ki_Xylitol) + Xylose_cyt × Xylitol_cyt × NADP_cyt / ( Ki_Xylose × Km_Xylitol × Ki_NADP)) (2)
V3 = V_Xylit_sec = Vsec_Xylit × Xylitol_cyt (3)
V4 = V_Xylit_up = Vup_Xylit × Xylitol_ex (4)
V5 = V_XDH = Vf_XDH × Vr × (NAD × Xylitol_cyt – Xylulose × NADH / Keq) / (Ki_NAD × Km_Xylitol × Vr + Km_Xylitol × Vr × NAD + Km_NAD × Vr × Xylitol_cyt + Vr × NAD × Xylitol_cyt + Km_NADH ×
R6: Xylulokinase (Xylulose + ATP ↔ X5P + ADP)
R7: Ribulose-5-phosphate epimerase
R8: Ribulose-5-phosphate isomerase
R9: Transketolase 1 (X5P + R5P ↔ GAP + S7P)
R10: Transaldolase (S7P + GAP ↔ E4P + F6P)
Vf_XDH × Xylulose / Keq + Km_Xylulose × Vf_XDH × NADH / Keq + Vf_XDH × Xylulose × NADH / Keq + Km_NADH × Vf_XDH × NAD × Xylulose / (Ki_NAD × Keq) + Km_NAD × Vr × Xylitol_cyt × NADH / Ki_NADH + Vr × NAD × Xylitol_cyt × Xylulose / Ki_Xylulose + Vf_XDH
× Xylitol_cyt × Xylulose × NADH / (Ki_Xylitol × Keq)) (5) V6 = V_XK = Vf_XK × ATP_cyt × Xylulose / (Km_Xylulose × Km_ATP × (1 + Xylulose / Km_Xylulose) × (1 + ATP_cyt / Km_ATP))
(6) V7 = V_RPE = (Vf_RPE / Km_X5P × X5P – Vr_RPE / Km_Ru5P × Ru5P) / (1 + X5P / Km_X5P + Ru5P / Km_Ru5P) (7)
V8 = V_RPI = (Vf_RPI / Km_Ru5P × Ru5P – Vr / Km_R5P × R5P) / (1 +
Ru5P / Km_Ru5P + R5P / Km_R5P) (8)
Keq calculation:
Keq = Vf_TKL1 × Vf_TKL1 / (Vr_TKL1 × Vr_TKL1) × Km_GAP ×
Km_S7P / (Km_R5P × Km_X5P) (9)
V9 = V_TKL1 = Vf_TKL1 × Vr_TKL1 × (X5P × R5P – GAP × S7P / Keq_TKL1) / (Km_R5P × Vr_TKL1 × X5P + Km_X5P × Vr_TKL1 × R5P + Vr_TKL1 × X5P × R5P + Km_S7P × Vf_TKL1 × GAP / Keq + Km_GAP
× Vf_TKL1 × S7P / Keq + Vf_TKL1 × GAP × S7P / Keq + Km_S7P × Vf_TKL1 × X5P × GAP / (Ki_X5P × Keq) + Km_X5P × Vr × R5P × S7P / Ki_S7P) (10) Keq calculation:
Keq = Vf_TAL × Vf_TAL / (Vr × Vr) × Km_E4P × Km_F6P / (Km_GAP
× Km_S7P) (11)
R11: Transketolase 2 (X5P + E4P ↔ GAP + F6P)
R12: Transketolase 3 (S7P + E4P ↔ R5P + F6P)
R13: Glucose phosphate isomerase (F6P ↔ G6P)
R14: Glucose 6–phosphate dehydrogenase
V10 = V_TAL = Vf_TAL × Vr × (S7P × GAP – E4P × F6P / Keq) / (Km_GAP × Vr × S7P + Km_S7P × Vr × GAP + Vr × S7P × GAP + Km_F6P × Vf_TAL × E4P / Keq + Km_E4P × Vf_TAL × F6P / Keq + Vf_TAL × E4P × F6P / Keq + Km_F6P × Vf_TAL × S7P × E4P / (Ki_S7P
× Keq) + Km_S7P × Vr × GAP × F6P / Ki_F6P) (12) Keq calculation:
Keq_TKL2 = Vf_TKL2 × Vf_TKL2 / (Vr_TKL2 × Vr_TKL2) ×
Km_GAP × Km_F6P / (Km_E4P × Km_X5P) (13)
V11 = V_TKL2 = Vf_TKL2 × Vr_TKL2 × (X5P × E4P – GAP × F6P / Keq_TKL2) / (Km_E4P × Vr_TKL2 × X5P + Km_X5P × Vr × E4P + Vr_TKL2 × X5P × E4P + Km_F6P × Vf_TKL2 × GAP / Keq_TKL2 + Km_GAP × Vf_TKL2 × F6P / Keq_TKL2 + Vf_TKL2 × GAP × F6P / Keq_TKL2 + Km_F6P × Vf_TKL2 × X5P × GAP / (Ki_X5P × Keq_TKL2) + Km_X5P × Vr_TKL2 × E4P × F6P / Ki_F6P) (14) Keq calculation:
Keq = Vf_TKL3 × Vf_TKL3 / (Vr × Vr) × Km_R5P × Km_F6P /
(Km_E4P × Km_S7P) (15)
V12 = V_TKL3 = Vf_TKL3 × Vr × (S7P × E4P – R5P × F6P / Keq) / (Km_E4P × Vr × S7P + Km_S7P × Vr × E4P + Vr × S7P × E4P + Km_F6P
× Vf_TKL3 × R5P / Keq + Km_R5P × Vf_TKL3 × F6P / Keq + Vf_TKL3 × R5P × F6P / Keq + Km_F6P × Vf_TKL3 × S7P × R5P / (Ki_S7P × Keq) + Km_S7P × Vr × E4P × F6P / Ki_F6P) (16)
V13 = V_GPI = (Vf_GPI / Km_F6P × F6P – Vr_GPI / Km_G6P × G6P) /
(1.0 + F6P / Km_F6P + G6P / Km_G6P) (17)
Vr calculation:
(G6P + NADP+ ↔ PGL + NADPH)
R15: 6–Phosphogluconolactonase (PGL + H2O → 6PG) R16: Phosphogluconate dehydrogenase
(6PG + NADP+ ↔ Ru5P + NADPH + CO2)
Vr_G6PDH = Vf_G6PDH × Ki_NADP × Km_G6P × Ki_6PGL × Km_NADPH / (Km_NADP × Ki_G6P × Km_6PGL × Ki_NADPH) (18) Keq calculation:
Keq_G6PDH = Vf_G6PDH × Km_6PGL × Ki_NADPH / (Vr_G6PDH ×
Ki_NADP × Km_G6P) (19)
V14 = V_G6PDH = Vf_G6PDH × Vr_G6PDH × (NADP_cyt × G6P – PGL × NADPH_cyt / Keq_G6PDH) / (Ki_NADP × Km_G6P × Vr_G6PDH + Km_G6P × Vr_G6PDH × NADP_cyt + Km_NADP × Vr_G6PDH × G6P + Vr_G6PDH × NADP_cyt × G6P + Km_NADPH × Vf_G6PDH × PGL / Keq_G6PDH + Km_6PGL × Vf_G6PDH × NADPH_cyt / Keq_G6PDH + Vf_G6PDH × PGL × NADPH_cyt / Keq_G6PDH + Km_NADPH × Vf_G6PDH × NADP_cyt × PGL / (Ki_NADP × Keq_G6PDH) + Km_NADP × Vr_G6PDH × G6P × NADPH_cyt / Ki_NADPH + Vr_G6PDH × NADP_cyt × G6P × PGL / Ki_6PGL + Vf_G6PDH × G6P × PGL × NADPH_cyt / (Ki_G6P × Keq_G6PDH)) (20)
V15 = V_6PGL = Vmax_6PGL × PGL / (Km_6PGL + PGL) (21) Vr calculation:
Vr_6PGDH = Vf_6PGDH × Ki_6PG × Km_CO2 / (Km_6PG × Ki_CO2) (22)
Keq calculation:
Keq_6PGDH =Ki_NADPH × Ki_Ru5P × Ki_CO2 / (Ki_NADP × Ki_6PG) (23)
V16 = V_6PGDH = Vf_6PGDH × Vr_6PGDH × (NADP_cyt × 6PG – CO2 × X5P × NADPH_cyt / Keq_6PGDH) / (Ki_NADP × Km_6PG × Vr_6PGDH + Km_6PG × Vr_6PGDH × NADP_cyt + Km_NADP ×
R17: 6–Phosphofructokinase (F6P + ATP → FBP + ADP)
R18: FBP–aldolase (FBP ↔ GAP + DHAP)
Vr_6PGDH × 6PG + Vr_6PGDH × NADP_cyt × 6PG + Ki_NADPH × Km_Ru5P × Vf_6PGDH × CO2 / Keq_6PGDH + Ki_Ru5P × Km_CO2 × Vf_6PGDH × NADPH_cyt / Keq_6PGDH + Km_NADPH × Vf_6PGDH × CO2 × X5P / Keq_6PGDH + Km_Ru5P × Vf_6PGDH × CO2 × NADPH_cyt / Keq_6PGDH + Km_CO2 × Vf_6PGDH × X5P × NADPH_cyt / Keq_6PGDH + Vf_6PGDH × CO2 × X5P × NADPH_cyt / Keq_6PGDH + Ki_NADPH × Km_Ru5P × Vf_6PGDH × NADP_cyt × CO2 / (Ki_NADP × Keq_6PGDH) + Km_NADP × Vr_6PGDH × 6PG × NADPH_cyt / Ki_NADPH + Ki_NADPH × Km_Ru5P × Vf_6PGDH × NADP_cyt × 6PG × CO2 / (Ki_NADP × Ki_6PG) + Km_NADPH × Ki_CO2 × Vf_6PGDH × NADP_cyt × 6PG × X5P / (Ki_NADP × Ki_6PG × Keq_6PGDH) + Km_NADP × Vr_6PGDH × 6PG × X5P × NADPH_cyt / (Ki_NADPH × Ki_Ru5P) + Km_NADPH × Vf_6PGDH × NADP_cyt × CO2 × X5P / (Ki_NADP × Keq_6PGDH) + Km_NADPH × Vf_6PGDH × NADP_cyt × 6PG × CO2 × X5P / (Ki_NADP × Ki_6PG × Keq_6PGDH) + Km_NADP × Vr_6PGDH × 6PG × CO2 × X5P × NADPH_cyt / (Ki_NADPH × Ki_Ru5P × Ki_CO2)) (24) V17 = V_PFK = Vmax_PFK × ATP_cyt × F6P / ((ATP_cyt + Km_ATP × (1 + ADP_cyt / Ki_ADP)) × (F6P + Km_F6P × (1 + ATP_cyt / Ki_ATP + ADP_cyt / KmB_ADP + AMP_cyt / KmB_AMP) / (1 + ADP_cyt / KmA_ADP + AMP_cyt / KmA_AMP)) × (1 + L_pfk / (1.0 + F6P × (1 + ADP_cyt / KmA_ADP + AMP_cyt / KmA_AMP) / (Km_F6P × (1 + ATP_cyt / Ki_ATP + ADP_cyt / KmB_ADP + AMP_cyt /
KmB_AMP)))n_pfk)) (25)
Vr calculation:
R19: Triose phosphate isomerase (DHAP ↔ GAP)
R20: Glyceraldehyde 3–phosphate dehydrogenase (GAP + NAD+ + Pi ↔ 1,3–BPG + NADH)
Vr_ALDo = 5.0 × Vf_ALDo (26)
V18 = V_Aldo = Vf_ALDo × (FBP – GAP × DHAP / Keq_ALDo) / (Km_FBP + FBP + GAP × Km_DHAP × Vf_ALDo/ (Keq_ALDo × Vr_ALDo) + DHAP × Km_GAP × Vf_ALDo / (Keq_ALDo × Vr_ALDo) + FBP × GAP / Ki_GAP + GAP × DHAP × Vf_ALDo / (Keq_ALDo ×
Vr_ALDo)) (27)
Vr calculation:
Vr_TPI = 22.0 × Vf_TPI × Km_GAP / Km_DHAP (28) V19 = V_TPI = (Vf_TPI / Km_DHAP × DHAP – Vr_TPI / Km_GAP × GAP) / (1 + DHAP / Km_DHAP + GAP / Km_GAP) (29) Vr calculation based on Vf:
Vr_GAPDH = Vf_GAPDH × Ki_Pi × Km_13BPG / (Km_Pi × Ki_13BPG) (30) Keq calculation:
Keq_GAPDH = Ki_13BPG × Ki_NADH / (Ki_NAD × Ki_GAP × Ki_Pi) (31)
V20 = V_GAPDH = Vf_GAPDH × Vr_GAPDH × (NAD_cyt × GAP × Pi_cyt – 13BPG × NADH_cyt / Keq_GAPDH) / (Ki_NAD × Ki_GAP × Km_Pi × Vr_GAPDH + Ki_GAP × Km_Pi × Vr_GAPDH × NAD_cyt + Ki_NAD × Km_GAP × Vr_GAPDH × Pi_cyt + Km_Pi × Vr_GAPDH × NAD_cyt × GAP + Km_GAP × Vr_GAPDH × NAD_cyt × Pi_cyt + Km_NAD × Vr_GAPDH × GAP × Pi_cyt + Vr_GAPDH × NAD_cyt × GAP
× Pi_cyt + Km_13BPG × Vf_GAPDH × NADH_cyt / Keq_GAPDH + Km_NADH × Vf_GAPDH × 13BPG / Keq_GAPDH + Vf_GAPDH × 13BPG × NADH_cyt / Keq_GAPDH + Km_NADH × Vf_GAPDH ×
R21: Phosphoglycerate kinase (1,3–BPG + ADP ↔ 3PG + ATP)
R22: Phosphoglycerate mutase (3PG ↔ 2PG)
R23: Enolase (2PG ↔ PEP + H2O)
R24: Pyruvate kinase (PEP + ADP → PYR + ATP)
NAD_cyt × GAP / (Ki_NAD × Keq_GAPDH) + Ki_NAD × Km_GAP × Vr_GAPDH × Pi_cyt × NADH_cyt / Ki_NADH + Km_NADH × Vf_GAPDH × NAD_cyt × GAP × 13BPG / (Ki_NAD × Ki_GAP × Keq_GAPDH) + Km_NAD × Vr_GAPDH × GAP × Pi_cyt × NADH_cyt / Ki_NADH + Km_NAD × Ki_Pi × Vr_GAPDH × GAP × 13BPG × NADH_cyt / (Ki_13BPG × Ki_NADH) + Ki_NAD × Km_GAP × Vr_GAPDH × Pi_cyt × 13BPG × NADH_cyt / (Ki_13BPG × Ki_NADH) + Km_NADH × Vf_GAPDH × NAD_cyt × GAP × Pi_cyt × 13BPG / (Ki_NAD × Ki_GAP × Ki_Pi × Keq_GAPDH) + Km_NAD × Vr_GAPDH
× GAP × Pi_cyt × 13BPG × NADH_cyt / (Ki_13BPG × Ki_NADH)) (32) Keq calculation:
Keq_PGK = Vf_PGK× Km_3PG × Ki_ATP / (Vr_PGK × Ki_ADP × Km_BPG (33) V21 = V_PGK = Vf_PGK × Vr_PGK × (ADP_cyt × BPG – ATP_cyt × 3PG / Keq_PGK) / (Ki_ADP × Km_BPG × Vr_PGK + Km_BPG × Vr_PGK
× ADP_cyt + Km_ADP × Vr_PGK × BPG + Vr_PGK × ADP_cyt × BPG + Km_3PG × Vf_PGK × ATP_cyt / Keq_PGK + Km_ATP × Vf_PGK × 3PG / Keq_PGK + Vf_PGK × ATP_cyt × 3PG / Keq_PGK) (34)
V22 = V_PGM = Vmax_PGM × (3PG – 2PG / Keq_PGM) / (Km_3PG ×
(1 + 2PG / Ki_2PG) + 3PG) (35)
V23 = V_ENO = (Vf_ENO / Km_2PG × 2PG – Vr_ENO / Km_PEP × PEP) / (1 + 2PG / Km_2PG + PEP / Km_PEP) (36)
V24 = V_PYK = Vmax_PYK × PEP × (PEP / Ki_PEP + 1.0)(n_pyk – 1.0) × ADP_cyt / (Km_PEP × (L_pyk × ((1.0 + ATP_cyt / Ki_ATP) / (FBP /
R25: Pyruvate decarboxylase (Pyrcyt → Acetaldehydecyt + CO2)
R26 (R26-1, R26-2): Alcohol dehydrogenase
(Acetaldehydecyt + NAD(P)H ↔ Ethanolcyt + NAD(P)+) R26-1: Cytosolic NADH–dependent alcohol dehydrogenase 1 (Acetaldehydecyt + NADH ↔ Ethanolcyt + NAD+)
Ka_FBP + AMP_cyt / Ka_AMP + 1.0))n_pyk + (PEP / Ki_PEP + 1.0)n_pyk) × (ADP_cyt + Km_ADP)) (37)
V25 = V_PDC = Vmax_PDC × Pyr_cyt × Pyr_cyt / (A + B × Pyr_cyt + Pyr_cyt × Pyr_cyt × (1.0 + Pyr_cyt / Ki_Pyr)) (38)
V26 = V_ADH_cyt = V_ADH1 + V_ADH1_NADPH (39)
Vr calculation:
Vr_ADH1 = Vf_ADH1 × Ki_Ethanol × Km_NAD × Ki_NADH × Km_Aldehyde / (Km_NADH × Ki_Aldehyde × Km_Ethanol × Ki_NAD)
(40) Keq calculation:
Keq_ADH1 = Vf_ADH1 × Km_Ethanol × Ki_NAD / (Vr × Ki_NADH × Km_Aldehyde) (41) If concentration of extracellular xylose (Xyloseex)is lower than 10-3 M then Vf_ADH1 = theta_NADH × Vf_ADH1 (42)
Vr_ADH1 = theta_NADH × Vr_ADH1 (43)
V_ADH1 = Vf_ADH1 × Vr_ADH1 × (NADH × Acetaldehyde – Ethanol_cyt × NAD / Keq_ADH1) / (Ki_NADH × Km_Aldehyde × Vr + Km_Aldehyde × Vr_ADH1 × NADH + Km_NADH × Vr_ADH1 × Acetaldehyde + Vr_ADH1 × NADH × Acetaldehyde + Km_NAD × Vf_ADH1 × Ethanol_cyt / Keq_ADH1 + Km_Ethanol × Vf_ADH1 × NAD / Keq_ADH1 + Vf_ADH1 × Ethanol_cyt × NAD / Keq_ADH1 + Km_NAD × Vf_ADH1 × NADH × Ethanol_cyt / (Ki_NADH × Keq_ADH1) + Km_NADH × Vr_ADH1 × Acetaldehyde × NAD / Ki_NAD + Vr_ADH1
× NADH × Acetaldehyde × Ethanol_cyt / Ki_Ethanol + Vf_ADH1 ×
R26-2: NADPH–dependent alcohol dehydrogenase 1 (Acetaldehydecyt + NADPH ↔ Ethanolcyt + NADP+)
Acetaldehyde × Ethanol_cyt × NAD / (Ki_Aldehyde × Keq_ADH1)) (44) Vr calculation:
Vr_ADH1_NADPH = Vf_ADH1_NADPH × Ki_Ethanol × Km_NADP × Ki_NADPH × Km_Aldehyde / (Km_NADPH × Ki_Aldehyde ×
Km_Ethanol × Ki_NADP) (45)
Keq calculation:
Keq_ADH1_NADPH = Vf_ADH1_NADPH × Km_Ethanol × Ki_NADP / (Vr × Ki_NADPH × Km_Aldehyde) (46) If concentration of extracellular xylose (Xyloseex)is lower than 10-3 M then
Vf_ADH1_NADPH = theta_NADPH × Vf_ADH1_NADPH (47)
Vr_ADH1_NADPH = theta_NADPH × Vr_ADH1_NADPH (48)
V_ADH1_NADPH = Vf_ADH1_NADPH × Vr_ADH1_NADPH × (NADPH × Acetaldehyde – Ethanol_cyt × NADP / Keq_ADH1_NADPH) / (Ki_NADPH × Km_Aldehyde × Vr_ADH1_NADPH + Km_Aldehyde × Vr_ADH1_NADPH × NADPH + Km_NADPH × Vr_ADH1_NADPH × Acetaldehyde + Vr_ADH1_NADPH × NADPH × Acetaldehyde + Km_NADP × Vf_ADH1_NADPH × Ethanol_cyt / Keq_ADH1_NADPH + Km_Ethanol × Vf_ADH1_NADPH × NADP / Keq_ADH1_NADPH + Vf_ADH1_NADPH × Ethanol_cyt × NADP / Keq_ADH1_NADPH + Km_NADP × Vf_ADH1_NADPH × NADPH × Ethanol_cyt / (Ki_NADPH
× Keq_ADH1_NADPH) + Km_NADPH × Vr_ADH1_NADPH × Acetaldehyde × NADP / Ki_NADP + Vr_ADH1_NADPH × NADPH ×