九州大学学術情報リポジトリ
Kyushu University Institutional Repository
フェキソフェナジン光学異性体の薬物動態に関与す る様々な薬物トランスポータ
赤嶺, 由美子
https://doi.org/10.15017/1441167
出版情報:Kyushu University, 2013, 博士(薬学), 課程博士 バージョン:
権利関係:Fulltext available.
Doctoral Dissertation
Various Drug-Transporters Related to the Fexofenadine Enantiomers Pharmacokinetics
March, 2014
Department of Clinical Pharmacokinetics, Graduate School of Pharmaceutical Sciences, Kyushu University
Yumiko Akamine
Contents
Abbreviations……… 1
General Introduction……… 3
Publications………... 8
List of Selected Relevant Publications……… 9
Chapter 1 Influence of Drug-Transporter Polymorphisms on the Pharmacokinetics of Fexofenadine Enantiomers 1.1. Introduction……….. 11
1.2. Subject and study design……….. 13
1.3. Results……….. 14
1.4. Discussion……… 21
1.5. Conclusion……….. 24
Chapter 2 The Role of P-glycoprotein on the Pharmacokinetics of Fexofenadine Enantiomers 2.1. Introduction……….. 26
2.2. Subject and study design……….. 27
2.3. Results……….. 29
2.4. Discussion……… 34
2.5. Conclusion……… 36
Chapter 3
The Role of Organic Anion Transporting Polypeptides on the Pharmacokinetics of Fexofenadine Enantiomers
3.1. Effects of multiple rifampicin 450 mg doses on the pharmacokinetics of fexofenadine enantiomers
3.1.1. Introduction……… 38
3.1.2. Subject and study design……… 41
3.1.3. Results……… 43
3.1.4. Discussion……….. 49
3.1.5. Conclusion……….. 52
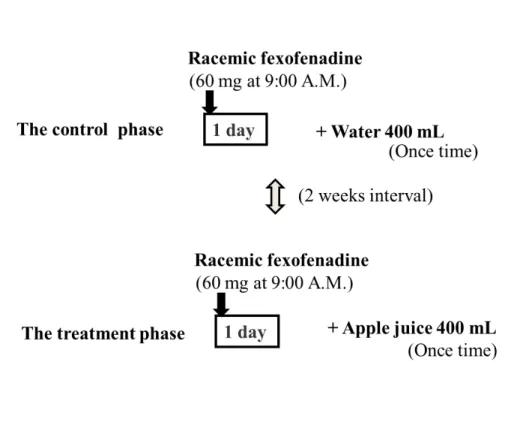
3.2. Effects of one-time apple juice ingestion on the pharmacokinetics of fexofenadine enantiomers 3.2.1. Introduction……… 53
3.2.2. Subject and study design……… 55
3.2.3. Results……… 57
3.2.4. Discussion……….. 67
3.2.5. Conclusion……….. 70
General Conclusion………... 71
Material and Methods………... 75
References……….. 83
Acknowledgments………. 95
Abbreviations
ABC ATP-binding cassette
Ae amount excreted into the urine
AUC area under the plasma concentration-time curve BCRP breast cancer resistance protein
CI confidence interval CL/F oral clearance CL
renalrenal clearance
C
maxmaximum plasma concentration cRNA complementary RNA
CYP cytochrome P450
HPLC high pressure liquid chromatography IQR interquartile range
ke elimination rate constant
LC–MS/MS liquid chromatography–tandem mass spectrometry MATE multidrug and toxic compound extrusion
MRP multidrug resistance protein N.S. not significant
OAT organic anion transporter
OATP organic anion transporting polypeptide OCT organic cation transporter
PCR-RFLP polymerase chain reaction–restriction fragment length polymorphism
P-gp P-glycoprotein
PPI proton pump inhibitor SD standard deviation
SEM standard error of the mean SLC solute carrier
SNP single nucleotide polymorphism t
1/2elimination half-life
t
maxtime to reach maximum plasma concentration
UV ultraviolet
General Introduction
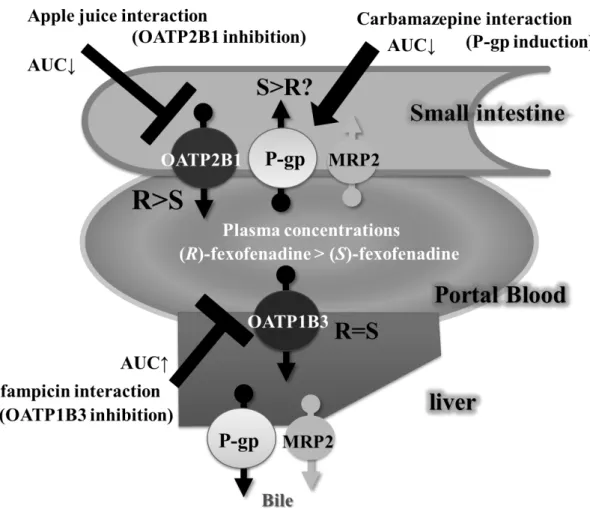
Drug-transporters play an important role in the clinical pharmacokinetics of many therapeutic agents [1-3]. In particular, ATP-binding cassette (ABC) and the solute carrier (SLC) superfamilies can be major determinants of the pharmacokinetic, safety and efficacy profiles of drugs [1]. There are located in various tissues (Fig. 1) [4], such as the luminal membrane of small intestinal enterocytes, the sinusoidal and canalicular membranes of hepatocytes, and the brush border membranes of proximal tubules, and play an important role in the absorption, distribution and excretion of therapeutic agents, which consequently alter their clinical effects [1-3].
P-glycoprotein (P-gp; also known as MDR1 and ABCB1) belongs to the ABC superfamily and is an efflux pump capable of transporting a wide range of compounds, such as digoxin, paclitaxel, cyclosporine, and HIV protease inhibitors [1,5-7]. P-gp is particularly expressed in the blood-brain barrier, small intestine, liver and kidney, wherein it is related to drug disposition and regulates the absorption and elimination of substrate drugs [1,8,9]. There has been considerable interest in the ABCB1 gene variation as a predictor of pharmacokinetic and/or treatment outcome of several drugs [10,11]. Moreover, P-gp-mediated transport activity is modulated by inhibition and induction, which can affect the pharmacokinetics [1,8].
In addition, drug interactions mediated by organic anion-transporting
polypeptides (OATPs) are also increasingly recognized as important clinical events
that may significantly change the bioavailability of orally administrated drugs, and
total body clearance [1,2]. OATPs belong to the SLC superfamily and are membrane
influx transporters expressed in the major organs related to the drug distribution, absorption and excretion, such as the blood-brain barrier, small intestine, liver, and kidney [2]. Therefore, OATPs mediated-drug interactions may occur at various organs.
Of the 11 human OATP transporters, OATP1B1, OATP1B3 and OATP2B1 are expressed on the sinusoidal membrane of hepatocytes and can facilitate the liver uptake of their substrate drugs [2,12-16]. While, OATP2B1 and OATP1A2 are expressed on the luminal membrane of small intestinal enterocytes, potentially participating in the active absorption of drugs [2,17-23].
Meanwhile, it is estimated that about half of all therapeutic agents are chiral, most of these drugs are administered as racemic mixtures, i.e. a 50/50 mixture of its enantiomers [24]. However, the racemate is not simply a mixture of the two enantiomers but rather is a distinct molecular entity with properties quite distinct from those of the two optical isomers [25-29]. Two enantiomers may show enantioselective pharmacokinetic and/or pharmacodynamic profiles [30,31]. There are many studies relative to the stereoselective pharmacokinetics of racemic mixture and most of them are related to cytochrome P450s (CYPs) [24,32]. For example, with the proton pump inhibitors (PPIs) omeprazole and lansoprazole, the plasma concentrations of (S)-omeprazole and (R)-lansoprazole are higher and are less influenced by CYP2C19 genetic polymorphisms as compared to their corresponding enantiomers [32-37]. This finding has led to the development of esomeprazole and dexlansoprazole, the (S)-enantiomer of omeprazole and (R)-enantiomer of lansoprazole, respectively, as single enantiomer PPIs.
In addition, although many studies on the stereoselective pharmacokinetics related to
CYPs have been reported, there has been little information of the stereoselective
pharmacokinetics related to drug-transporters.
Fexofenadine,(±)-2-[4-[1-hydroxy-4-[4-(hydroxydiphenylmethyl)piperidino]but yl] phenyl]-2-methylpropanoic acid, is one of the most widely used drugs for seasonal allergic rhinitis and chronic urticaria [38]. Metabolism accounts for less than 1% of fexofenadine elimination processes in humans since more than 95% of the drug is excreted in both urine and feces in non-metabolized form [39,40]. Based on several in vitro studies, many clinical studies on fexofenadine pharmacokinetics have been performed [40-51]. For example, carbamazepine [41], rifampicin [42,43], St. John’s wort [44], itraconazole [45-47], verapamil [48-50] and several fruit juices [51] affected fexofenadine pharmacokinetics. Since fexofenadine is poorly metabolized by CYPs, it has been suggested that drug-transporters play an important role in fexofenadine pharmacokinetics; including P-gp, OATPs, multidrug resistance protein 2 (MRP2), breast cancer resistance protein (BCRP) and multidrug and toxic compound extrusions (MATEs) [40,52-54].
Moreover, fexofenadine is therapeutically administered as a racemic mixture of
(R)- and (S)-enantiomers [55]. Our previous clinical studies have demonstrated that
the disposition of fexofenadine enatiomers shows the stereoselectivity; the plasma
concentration of (R)-fexofenadine in humans is about 1.5-fold higher than that of the
corresponding (S)-enantiomer [56,57]. Such differences among the
pharmacokinetics of fexofenadine enantiomers are likely to be influenced by the
difference of the affinity for drug-transporters. In a recent in vitro study, cetirizine
enantiomers that were applied to Caco-2 cells were transported differently in
comparison to one another, and the absorptive permeabilities of (R)- and
(S)-enantiomers were changed in the presence of P-gp inhibitors, such as verapamil
and quinidine [58]. In addition to this result, our in vivo studies have reported that
P-gp inhibitors, such as itraconazole and verapamil, significantly increase the plasma concentrations of both enantiomers, and the effect on the P-gp-mediated transport of (S)-fexofenadine may be greater in comparison to that of (R)-enantiomer [59,60].
However, almost clinical studies have been conducted using a racemic mixture of
fexofenadine, and consequently, information on the pharmacokinetic parameters of
individual fexofenadine enantiomers is lacking. Although P-gp and OATPs may have
major influences on fexofenadine pharmacokinetics, whether these transporters have
important roles in the stereoselective pharmacokinetics of fexofenadine has not yet been
determined. Therefore, we need to confirm the extent of drug-transporters contributing
to each fexofenadine enantiomer of pharmacokinetics. In the first chapter, we examined
whether drug-transporter polymorphisms influence on the pharmacokinetics of
fexofenadine enantiomers. Subsequently, in the second and third chapters, we have
evaluated the roles of P-gp and OATPs on the fexofenadine enantiomers
pharmacokinetics using these transporter inducers/inhibitors. The present results will
lead to further research concerning the chirality of racemic mixtures.
Fig. 1. The roles of drug transporters.
BCRP = breast cancer resistance protein; MATEs = multidrug and toxic compound
extrusions; MRPs = multidrug resistance-associated proteins; OATs = organic anion
transporters; OATPs = organic anion-transporting polypeptides; OCTs = organic cation
transporters; P-gp = P-glycoprotein.
Publications (Including preparations)
This doctoral dissertation is based on following papers.
1. Influence of drug-transporter polymorphisms on the pharmacokinetics of fexofenadine enantiomers.
Akamine Y, Miura M, Sunagawa S, Kagaya H, Yasui-Furukori N, Uno T.
Xenobiotica 2010; 40, 782-789.
(Chapter 1)
2. Carbamazepine differentially affects the pharmacokinetics of fexofenadine enantiomers.
Akamine Y, Miura M, Yasui-Furukori N, Kojima M, Uno T.
Br J Clin Pharmacol 2012; 3, 478-481.
(Chapter 2)
3. Effects of multiple rifampicin 450 mg doses on the fexofenadine enantiomers pharmacokinetics in Japanese volunteers
Akamine Y, Miura M, Yasui-Furukori N, Ieiri I, Uno T.
Manuscript in preparation (Chapter 3)
4. Effects of one-time apple juice ingestion on the pharmacokinetics of fexofenadine enantiomers
Akamine Y, Miura M, Komori H, Saito S, Yamada S, Shiohira H, Kusuhara H, Tamai I, Ieiri I, Uno T, Yasui-Furukori N.
Manuscript in preparation
(Chapter 3)
List of Selected Relevant Publications
1. Effect of coadministration of single and multiple doses of rifampicin of fexofenadine enantiomers.
Kusuhara H, Miura M, Yasui-Furukori N, Yoshida K, Yokochi M, Fukizawa S, Ikejiri K, Kanamitsu K, Akamine Y, Uno T, sugiyama Y.
Drug Metab Dispos, 2013; 41, 206-213.
2. Psychotropic drug-drug interactions involving P-glycoprotein.
Akamine Y, Yasui-Furukori N, Ieiri I, Uno T.
CNS drugs 2012; 6, 959-973.
3. Different effects of the selective serotonin reuptake inhibitors fluvoxamine, paroxetine, and sertraline on the pharmacokinetics of fexofenadine in healthy volunteers.
Saruwatari J, Yasui-Furukori N, Niioka T, Akamine Y, Takashima A, Kaneko S, Uno T.
J Clin Psychopharmacol 2012; 32, 195-199.
4. The role of drug-transporters on psychotropic penetration at the blood-brain barrier.
Akamine Y, China K, Uno T.
Clinical Neuropsychopharmacology and Therapeutics 2012; 3, 8-14.
5. A sensitive column-switching HPLC method for aripiprazole and dehydroaripiprazole and its application to human pharmacokinetic studies.
Akamine Y, Yasui-Furukori N, Kojima M, Inoue Y, Uno T.
J Sep Sci 2010; 33, 3292-3298.
6. Effects of the P-glycoprotein inducer carbamazepine on fexofenadine pharmacokinetics.
Yamada S, Yasui-Furukori N, Akamine Y, Kaneko S, Uno T.
Ther Drug Monit 2009; 31, 764-768.
Chapter 1
Influence of Drug-Transporter Polymorphisms on the
Pharmacokinetics of Fexofenadine Enantiomers
1.1. Introduction
P-glycoprotein (P-gp), encoded by ABCB1 genes, is a membrane efflux transporter normally expressed in human tissues such as the small intestine, the biliary canalicular front of hepatocytes, and the renal proximal tubules [1]. A few studies have investigated whether ABCB1 polymorphisms including 1236C>T, 2677G>A/T and 3435C>T mutations, could affect the pharmacokinetics of racemic fexofenadine and have yielded conflicting results [61,62]. Yi et al. have reported that the plasma concentrations of fexofenadine after a single oral administration of 180 mg fexofenadine were significantly lower in three subjects with ABCB1 2677AA/3435CC than in subjects with other genotypes (2677/3435: GG/CC, GT/CT, TT/TT, GA/CC, and TA/CT) [61]. On the other hand, Drescher et al. have reported that there were no statistically significant differences in the pharmacokinetic parameters of fexofenadine after single oral dose of 180 mg fexofenadine between subjects with 2677GG, GT and TT genotypes or 3435TT and CC genotypes [62].
In addition to P-gp, organic anion transporting-polypeptides (OATPs), encoded
by SLCO genes, may also be relevant to fexofenadine pharmacokinetics [40]. Of the
OATP drug-transporters, OATP1B1, 1B3 and 2B1 are reported to be involved in the
hepatic uptake of fexofenadine [63-65], and although OATP1A2 and 2B1 are
expressed in the small intestine, these transporters key intestinal uptake transporter
for fexofenadine absorption [40,66]. In a single report, the area under the plasma
concentration-time curve (AUC) of racemic fexofenadine was found to be
significantly higher in two subjects with the SLCO1B1 521CC (*15/*15) genotype
than in ten subjects with the TT genotype [67]. Therefore, studies of OATPs and
P-gp imply that the pharmacokinetics of fexofenadine enantiomers may be affected
by genetic polymorphisms of these drug transporters.
It has also been reported that multidrug resistance protein 2 (MRP2), encoded by ABCC2 genes, and breast cancer resistance protein (BCRP), encoded by ABCG2, may contribute to fexofenadine transport [52,53]. Fexofenadine is thought to be excreted into bile predominantly by MRP2 and to a minor extent by BCRP [52]. Therefore, genetic polymorphisms of MRP2 and BCRP may contribute to the stereoselective pharmacokinetics of fexofenadine enantiomers.
Thus, the intervention of multiple transporters in fexofenadine pharmacokinetics
makes an investigation of its transport mechanisms difficult, and the effect of chirality
on fexofenadine transport has not yet been addressed. Therefore, we needed to clarify
the effect of SLCO, ABCB1, ABCC2 and ABCG2 genetic polymorphisms associated
with pharmacokinetic differences for fexofenadine enantiomers.
1.2. Subjects and study design
Twenty-four healthy Japanese subjects (twelve males and twelve females) were enrolled in this study after giving informed written consent. Their mean age was 24.6 ± 3.7 years (range 22-36 years) and their mean weight was 57.4 ± 5.5 kg (range 46-65 kg). None of the subjects had a history of significant medical illness or drug hypersensitivity. All subjects were nonsmokers. None of the subjects had taken any drug for at least 1 week before or during the study. The study protocol was approved by the Ethics Committee of Hirosaki University School of Medicine.
Each subject received an oral dose of 60 mg of racemic fexofenadine (Allegra
®,
Sanofi Aventis, Tokyo, Japan) with a glass of tap water at 9:00 A.M.. All subjects
fasted for 10 hours before administration of fexofenadine and had a standard meal 4
hours after ingestion of fexofenadine. Beverages containing alcohol, caffeine, tea, or
fruit juice were forbidden during the test period.
1.3. Results
Clinical pharmacokinetics of fexofenadine enantiomers
After a single oral dose of racemic fexofenadine (60 mg), the plasma and urine concentrations of fexofenadine enantiomers were measured over the course of 24 hours in twenty-four healthy subjects. The plasma concentration of (R)-fexofenadine at all time points was higher than those of the corresponding (S)-enantiomer (Fig. 2A). The AUC
0-24and the maximum plasma concentration (C
max) of (R)-fexofenadine were significantly greater than those of the (S)-enantiomer (P < 0.001, respectively). The R/S ratios for the fexofenadine AUC
0-24and C
maxwere 1.62 [95% confidence interval (CI) 1.49-1.76] and 1.39 (95% CI 1.25-1.54), respectively. The oral clearance (CL/F) of (S)-fexofenadine was significantly greater than that of (R)-fexofenadine (P < 0.001).
The amount of (S)-fexofenadine urinary excretion was slightly higher but not
significantly different than that of (R)-fexofenadine (Fig. 2B). Renal clearance (CL
renal)
of (S)-fexofenadine was significantly greater than that of (R)-fexofenadine (P < 0.01).
Fig. 2.
(A) Mean + SD of the plasma concentration-time profiles of (R)-fexofenadine (solid
circles) and (S)-fexofenadine (open circles) after a 60 mg oral dose of racemic
fexofenadine. (B) Mean + SD of the amount of urinary excretion of (R)-fexofenadine
(solid circles) and (S)-fexofenadine (open circles) after a 60 mg oral dose of racemic
fexofenadine. Time points consisted of 0, 6, 12, and 24 hours after fexofenadine
administration.
Impacts of ABC genotype groups on the pharmacokinetics of fexofenadine enantiomers
There were no significant differences in the C
max, elimination half-life (t
1/2), and
AUC
0-24for (R)- and (S)-fexofenadine among the ABC polymorphisms including
ABCB1 1236C>T, 2677G>A/T and 3435C>T, ABCC2 -24C>T and ABCG2 421C>A
(data not shown). On the other hand, the AUC
0-24and C
maxof (S)-fexofenadine were
significantly lower in five subjects having a combination of ABCB1 1236CC/3435CC
and ABCC2 -24CC alleles than in subjects with other polymorphic genotypes (P =
0.036 and 0.015, respectively), but no significant differences of the (R)-enantiomer were
observed between the two groups (Fig. 3).
Fig. 3.
Comparison of the C
maxand AUC
0-24of (S)-fexofenadine (A and C, respectively) and (R)-fexofenadine (B and D, respectively) between two genotype groups. Graphical analysis was done using the SPSS box and whiskers plot. The box spans data between the two quartiles (IQR), with the median represented as a bold horizontal line. The ends of the whiskers (vertical lines) represent the smallest and largest values that are not outliers. Outliers (circles) are values between 1.5 IQRs and 3 IQRs from the end of a box. Values greater than 3 IQRs from the end of a box are defined as extreme (asterisk).
Other genotype group contains one or more polymorphism including ABCB1 1236CT or
TT, ABCB1 3435CT or TT, ABCC2 -24CT or TT.
Impact of OATPs genotype groups on the pharmacokinetics of fexofenadine enantiomers
The C
max, t
1/2and AUC
0-24of (R)- and (S)-fexofenadine in the OATPs genotype groups including SLCO1B1, SLCO1B3 or SLCO2B1 after a single oral administration of 60 mg racemic fexofenadine are shown in Table 1. The AUC
0-24of (S)-fexofenadine was significantly lower in fourteen subjects with the SLCO2B1*1/*1 allele than in ten subjects with the *3 allele (P = 0.031).
Table 2 shows the pharmacokinetic parameters of fexofenadine enantiomers in the OATP2B1 plus P-gp or MRP2 genotype groups after a single oral administration of 60 mg racemic fexofenadine. The AUC
0-24and C
maxof (S)-fexofenadine were significantly lower in four subjects having a combination of SLCO2B1*1/*1 and ABCB1 1236CC alleles than in subjects with other polymorphic genotypes (P = 0.010 and 0.029, respectively), and the AUC
0-24of (S)-fexofenadine in subjects with the two combinations of SLCO2B1*1/*1/ABCB1 3435CC and SLCO2B1*1/*1/ ABCC2 -24CC was significantly lower than in other polymorphic genotype groups (P = 0.033 and 0.022, respectively), while the AUC
0-24for (R)-fexofenadine in the combination SLCO2B1*1/*1/ABCB1 1236CC genotype was significantly lower than in other polymorphic genotypes (P = 0.045).
In addition, there was no significant difference in all parameters for the (R)- and
(S)-enantiomers between the OATP1B1 plus P-gp, MRP2 or BCRP genetic groups, and
the OATP1B3 plus P-gp, MRP2 or BCRP genetic groups (data not shown). On the other
hand, in the present study, we did not observe an influence of the SLCO1A2
polymorphism on fexofenadine enantiomer pharmacokinetics, presumably since SNPs
in SLCO1A2 affecting transport activity have not been observed in an Asian population.
Table 1.
Pharmacokinetic parameters of fexofenadine enantiomers in each transporter genotype group after a single oral administration of 60 mg racemic fexofenadine.
The values shown are the median (range).
a
Kruskal-Wallis test.
b
Mann-Whitney U test vs.wild-type.
n
Cmax (ng/mL) P-values P-values P-values
(S )-fexofenadine SLCO1B1
1a/1a+1a/1b+1b/1b 16 104 (27-186) 0.610
a2.8 (1.8-4.9) 0.066
a469 (112-1081) 0.569
a1a/*15+1b/*15+*15/*15 8 122 (50-135) 3.6 (2.4-7.7) 546 (310-1123)
SLCO1B3
334T/T+T/G 13 122 (27-186) 0.569
b3.3 (2.2-4.9) 0.320
b519 (112-777) 1.000
b334G/G 11 104 (49-152) 3.1 (1.8-7.7) 424 (298-1123)
SLCO2B1
*1/*1 14 111 (27-186) 0.931
b2.6 (2.0-4.9) 0.120
b446 (112-643) 0.031
b*1/*3+*3/*3 10 113 (53-152) 3.6 (1.8-7.7) 675 (298-1123) (R )-fexofenadine
SLCO1B1
1a/1a+1a/1b+1b/1b 16 144 (40-269) 0.528
a3.3 (2.5-5.7) 0.086
a812 (241-1366) 0.928
a1a/*15+1b/*15+*15/*15 8 136 (61-159) 4.5 (2.8-6.2) 848 (592-1004)
SLCO1B3
334T/T+T/G 13 138 (40-269) 0.494
b3.7 (2.5-5.3) 0.769
b832 (241-1328) 0.776
b334G/G 11 140 (76-182) 3.5 (2.5-6.2) 860 (493-1366)
SLCO2B1
*1/*1 14 148 (40-269) 0.183
b3.3 (2.5-5.7) 0.134
b764 (241-1113) 0.212
b*1/*3+*3/*3 10 133 (61-179) 4.0 (2.5-6.2) 916 (496-1366)
t1/2 (h) AUC0-24 (ng・h/mL)Table 2.
Pharmacokinetic parameters of fexofenadine enantiomers in each transporter genotype group after a single oral administration of 60 mg racemic fexofenadine.
The values shown are the median (range).
Mann-Whitney U test vs.wild-type.
n P-values P-values P-values
(S )-fexofenadine
SLCO2B1/ABCB1 C1236TSLCO2B1*1/*1/ABCB1 1236CC 4 67 (27-98) 0.029 2.1 (2.0-3.4) 0.097 334 (112-359) 0.010
other 20 108 (50-186) 3.2 (1.8-7.7) 556 (298-1123)
SLCO2B1/ABCB1 C3435T
SLCO2B1*1/*1/ABCB1 3435CC 6 74 (27-129) 0.090 2.4 (2.0-4.9) 0.343 357 (112-519) 0.033
other 18 109 (50-186) 3.2 (1.8-7.7) 579 (298-1123)
SLCO2B1/ABCC2 C-24T
SLCO2B1*1/*1/ABCC2 -24CC 11 89 (27-135) 0.228 2.9 (2.0-4.9) 0.733 359 (112-643) 0.022
other 13 112 (53-186) 3.3 (1.8-7.7) 610 (298-1123)
SLCO2B1/ABCG2 C421A
SLCO2B1*1/*1/ABCG2 421CC 6 92 (27-135) 0.581 2.3 (2.0-4.9) 0.224 446 (112-643) 0.224
other 18 105 (50-186) 3.3 (1.8-7.7) 576 (298-1123)
(R )-fexofenadine
SLCO2B1/ABCB1 C1236TSLCO2B1*1/*1/ABCB1 1236CC 4 115 (40-148) 0.431 2.9 (2.7-4.1) 0.157 556 (241-860) 0.045
other 20 140 (61-269) 3.8 (2.5-6.2) 870 (493-1366)
SLCO2B1/ABCB1 C3435T
SLCO2B1*1/*1/ABCB1 3435CC 6 120 (40-159) 0.537 3.4 (2.7-4.9) 0.454 681 (241-877) 0.090
other 18 142 (61-269) 3.7 (2.5-6.2) 880 (493-1366)
SLCO2B1/ABCC2 C-24T
SLCO2B1*1/*1/ABCC2 -24CC 11 126 (40-182) 0.494 3.5 (2.7-5.7) 0.459 764 (241-1032) 0.063
other 13 145 (61-269) 3.9 (2.5-6.2) 902 (493-1366)
SLCO2B1/ABCG2 C421A
SLCO2B1*1/*1/ABCG2 421CC 6 130 (40-182) 0.626 2.8 (2.7-4.9) 0.122 764 (241-1032) 0.199
other 18 138 (61-269) 3.9 (2.5-6.2) 855 (493-1366)
Cmax (ng/mL) t1/2 (h) AUC0-24 (ng・h/mL)
1.4. Discussion
This is the first report investigating the association of drug-transporter polymorphisms with fexofenadine enantiomers pharmacokinetics. In this study, the OATP2B1 polymorphism is a key determinant of (S)-fexofenadine pharmacokinetics, and polymorphisms of P-gp and MRP2 in addition to OATP2B1 were associated with altered plasma concentrations of (S)-fexofenadine after a single oral administration of 60 mg fexofenadine.
In our previous papers, we suggested that P-gp could play a key role in the differences of fexofenadine enantiomer pharmacokinetics [59,60]. However, in the present study, other transporters besides P-gp were observed to affect fexofenadine enantiomer pharmacokinetics. This result suggests that P-gp genetic polymorphisms are somewhat less important factors in determining the stereoselectivity of fexofenadine enantiomers. Previous papers have reported that the co-administration of itraconazole and verapamil decreased the mean R/S ratio for the fexofenadine AUC from 1.84 to 1.43 and from 1.76 to 1.32, respectively [59,60]. An R/S ratio not around 1.00 implies that the difference between fexofenadine enantiomers cannot be completely explained only on the basis of chiral discrimination by P-gp and suggests the involvement of multiple drug-transporters.
In the present study, only the OATP2B1 genetic polymorphism was associated
with fexofenadine enantiomer pharmacokinetics, and the AUC
0-24of
(S)-fexofenadine was significantly lower in subjects with the SLCO2B1*1/*1 allele
than in those with the *3 allele (P = 0.031) (Table 1); however, there were no
significant differences in the AUC
0-24of (R)-fexofenadine between the SLCO2B1
genotypes. This finding suggests that OATP2B1 contributes more to the transport of
(S)-fexofenadine than of the (R)-enantiomer. In addition, SLCO2B1*3 allele decreases the transport function of OATP2B1 [68]. A decrease in the function of OATP2B1 in the small intestione, if any, ought to cause a reduction in intestinal uptake and a resultant decrease in plasma concentrations of both enantomers. Thus, these results support that (S)-fexofenadine transport by OATP2B1 may be greater in the liver than in the small intestine because OATP2B1 expression is most abundant in human liver [63], and the influence of the OATP2B1 polymorphism on (S)-fexofenadine transport in the small intestine may be minimal. Therefore, hepatic uptake of fexofenadine may be enantioselective and the subsequent hepato-biliary transport would be enantioselective irrespective of biliary excretion selectivity.
In the present study as analyzed by the pharmacokinetic parameters in OATP2B1
plus P-gp or MRP2 genotype groups, the AUC
0-24of (S)-fexofenadine was significantly
lower in subjects with the triple combination of SLCO2B1*1/*1/ABCB1 1236CC,
SLCO2B1*1/*1/ABCB1 3435CC, and SLCO2B1*1/*1/ ABCC2 -24CC than in subjects
with other polymorphic genotype groups, while the AUC
0-24of (R)-fexofenadine was
significantly lower in subjects with a combination of SLCO2B1*1/*1/ABCB1 1236CC
than in subjects with other polymorphic genotypes (Table 2). These findings suggest
that differences of fexofenadine enantiomer pharmacokinetics may be affected by
combinations of OATP2B1, P-gp, and MRP2 genetic polymorphisms. Furthermore,
mean AUC
0-24and C
maxvalues of (S)-fexofenadine were significantly lower in subjects
with the ABCB1 1236CC/3435CC/ABCC2 -24CC genotypes than with other genotype
groups (P = 0.036 and 0.015, respectively) (Fig. 3), but there was no significant
difference in the t
1/2of (S)-fexofenadine between the two groups (P = 0.367). This
finding shows that the oral absorption of (S)-fexofenadine is mainly influenced by the
intestinal expression of P-gp and MRP2 based on their genetic polymorphisms.
The regulation by transporters such as P-gp, OATPs, MRP2, and minorly BCRP for fexofenadine exposure is complex; therefore, we may not find definitive transporter polymorphisms for (R)-fexofenadine. Other single-nucleotide polymorphisms in addition to the transporter polymorphisms observed in the present study may influence the pharmacokinetics of (R)-fexofenadine. This study was carried out in a small clinical trial with only twenty-four healthy Japanese subjects;
hence, further study using a larger sample size is necessary, and our results should
be interpreted within the context of the study limitations.
1.5. Conclusion
In conclusion, the pharmacokinetics of (S)-fexofenadine is associated with a single
polymorphism of SLCO2B1, and combinations of several polymorphisms of ABCB1
C1236T, C3435T and ABCC2 C-24T. Our findings suggest that the combination of
multiple transporters involving OATPs, P-gp, and MRP2 reacts strongly to fexofenadine
exposure in the small intestine and liver, resulting in different disposition between both
enantiomers.
Chapter 2
The Role of P-glycoprotein on the Pharmacokinetics of
Fexofenadine Enantiomers
2.1. Introduction
Recently, we have reported that itraconazole or verapamil co-administration altered the plasma concentrations of (R)- and (S)-fexofenadine enantiomers through the probable inhibition of P-gp-mediated transport [59,60]. Because the C
maxand the plasma concentration at the first sample point of both enantiomers were increased, these findings imply that the P-gp-mediated transport of fexofenadine may be primarily inhibited by P-gp inhibitors in the small intestine. In the first chapter, ABCB1 polymorphisms were associated with altered plasma concentrations of (S)-fexofenadine after a single oral administration of 60 mg fexofenadine.
Meanwhile, carbamazepine is known to be a potent CYP3A inducer, several in vitro
and in vivo reports regarding drug-drug interactions have shown that carbamazepine is
also a P-gp inducer [69] that can markedly reduce plasma concentrations and the
efficacy of talinolol as a P-gp substrate [70]. Therefore, if the stereoselective disposition
of fexofenadine is caused by P-gp-mediated transport, carbamazepine may alter the
different properties of each fexofenadine enantiomer. To date, no information is
available to suggest an in vivo contribution of a P-gp inducer in the stereoselective
effects of racemic mixtures. Therefore, the principal aim was to evaluate the possible
effects of the P-gp inducer carbamazepine on fexofenadine enantiomer
pharmacokinetics in healthy volunteers. The present results may indicate how the
stereoselectivity of fexofenadine will be changed by P-gp inducers and will lead to
further research concerning the chirality of racemic mixtures.
2.2. Subjects and study design
Twelve healthy Japanese volunteers (males) were enrolled in this study after giving informed written consent. Each subject was deemed physically healthy by a clinical examination and routine laboratory testing and had no history of significant medical illnesses or hypersensitivity to any drugs. The mean (± SD) age and body weight of the volunteers were 25.2 (± 5.9) years (range 20–39 years) and 62.4 (±
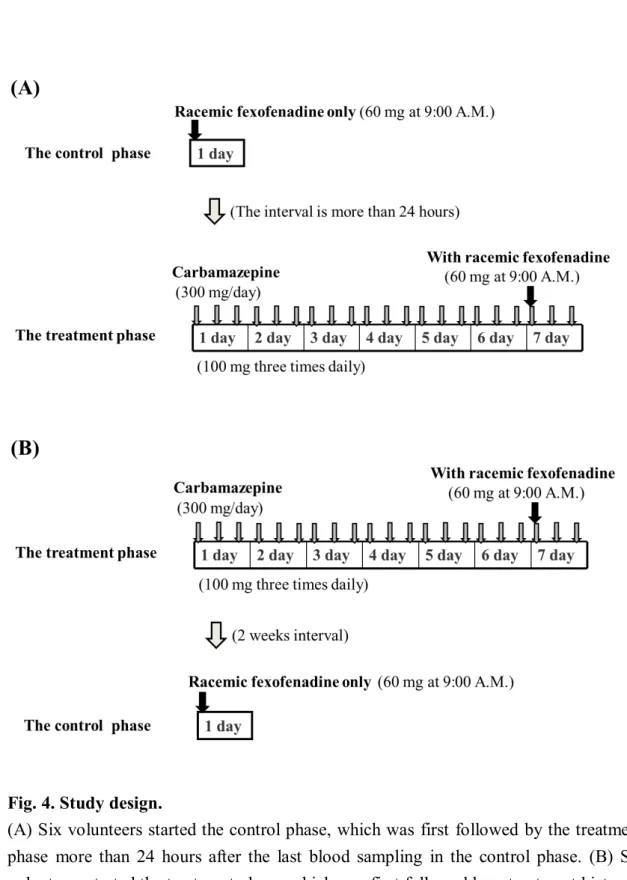
4.1) kg (range 58–70 kg), respectively. This study was approved by the Ethics Committee of the Hirosaki University School of Medicine. This randomized, open-label study consisted of two phases (a control and a 7-day treatment) and 2 study days in which 60 mg of fexofenadine hydrochloride was administered (Fig. 4).
In the control phase, volunteers received 60 mg of fexofenadine hydrochloride (Allegra
®; Sanofi-Aventis K.K., Tokyo, Japan) at 9:00 A.M. after an overnight fast.
In the treatment phase, carbamazepine was dosed at 100 mg 3 times daily (for a total
daily dose of 300 mg) for 7 days. On day 7, a single 60 mg dose of fexofenadine
was co-administered with a 100 mg dose of carbamazepine (Tegretol
®; Novartis
Pharma Ltd., Tokyo, Japan) at 9:00 A.M. after an overnight fast. In a second
volunteer group, fexofenadine was administered alone after a 2-week washout
period. The order of the two phases was randomly assigned to each volunteer. Six
volunteers started the control phase, which was first followed by the treatment phase
more than 24 hours after the last blood sampling in the control phase (Fig. 4A). The
other volunteers started the treatment phase, which was first followed by a treatment
hiatus of at least 2 weeks and the control phase (Fig. 4B). Volunteers did not take
any medication or fruit juices for at least 7 days before both study phases, and no
meal or beverages were allowed until 4 hours after fexofenadine administration.
Fig. 4. Study design.
(A) Six volunteers started the control phase, which was first followed by the treatment
phase more than 24 hours after the last blood sampling in the control phase. (B) Six
volunteers started the treatment phase, which was first followed by a treatment hiatus of
at least 2 weeks and the control phase. The order of the two phases was randomly
assigned to each volunteer.
2.3. Results
Effects of the carbamazepine on the plasma concentrations of fexofenadine enantiomers
Four subjects in the carbamazepine phase experienced somnolence, which is consistent with known reactions to carbamazepine; however, these drug-related adverse events were mild in intensity, and the subjects completed all phases according to the study protocol.
The mean (+ SD) plasma concentration-time profiles of the fexofenadine enantiomers in both phases are shown in Fig. 5, and the pharmacokinetic parameters are summarized in Table 3. In the control phase, the plasma concentration of (R)-fexofenadine at all time points was higher than the corresponding (S)-enantiomer, and the mean AUC
0-24R/S ratio was 1.58 (95% CI 1.48-1.68) (Table 3). Similar to the results of our previous reports [56,57,59,60], the mean AUC
0-24(P
< 0.001) and C
max(P < 0.05) of (R)-fexofenadine were significantly greater than the (S)-enantiomer. The mean CL/F (P < 0.001) of (S)-fexofenadine was significantly greater than that of (R)-fexofenadine (Table 3).
Carbamazepine co-administration significantly decreased plasma concentrations of both fexofenadine enantiomers at the final sample point from the initial sample point in comparison to the enantiomers that were measured during the control phase (Fig. 5) and altered all pharmacokinetic parameters except the time to reach C
max(t
max) (Table 3). Although the mean AUC
0-24(P < 0.001 for (S)-fexofenadine, P <
0.001 for (R)-fexofenadine, respectively) values of both enantiomers were
significantly decreased in the carbamazepine phase, the mean individual differences
between the control and carbamazepine phases for the AUC
0-24(P < 0.001) of
(S)-fexofenadine were significantly greater than those of (R)-fexofenadine (Table 3). In addition, although the t
1/2values were not different between the (R)- and (S)-enantiomers in the control phase (P = 0.231), carbamazepine significantly shortened the mean t
1/2(P < 0.05) of (S)-fexofenadine without affecting (R)-fexofenadine (Table 3). There were significant differences in the t
1/2(P < 0.001) between both enantiomers in the carbamazepine phases (Table 3).
Fig. 5.
(A) Mean (+ SD) plasma concentration–time curves of (R)-fexofenadine following a
single oral administration of 60 mg fexofenadine hydrochloride in twelve healthy
volunteers treated with placebo (open squares) or carbamazepine (closed squares). (B)
Mean (+ SD) plasma concentration–time curves of (S)-fexofenadine following a single
oral administration of 60mg fexofenadine hydrochloride in twelve healthy volunteers
treated with placebo (open circles) or carbamazepine (closed circles).
Effect of the carbamazepine on the urinary excretion of fexofenadine enantiomers In contrast to the ratios of (R)- and (S)-fexofenadine plasma concentrations, the urine concentration of (S)-fexofenadine was slightly higher than that of (R)-fexofenadine in the control phase (Fig. 6); the pharmacokinetic parameters are summarized in Table 3. In the control phase, there were significant differences in the mean CL
renal(P < 0.01) of both enantiomers; however, the mean Ae
0-24(P = 0.541) values were not different between the (R)- and (S)-enantiomers (Table 3).
Similar to the results of the plasma concentrations, carbamazepine
co-administration significantly decreased the urine concentrations of both
enantiomers (Fig. 6), and the mean Ae
0-24values of both enantiomers were
significantly decreased in the carbamazepine phase (P < 0.01 for (R)-fexofenadine,
P < 0.05 for (S)-fexofenadine, respectively). Although the CL
renal(P = 0.154) of
(R)-fexofenadine did not change between the control and carbamazepine phases,
that of (S)-fexofenadine (P < 0.01) was significantly increased in the carbamazepine
phases in most of the volunteers (Table 3). In addition, the mean individual
differences in the CL
renal(P < 0.001) of (S)-fexofenadine between the control and
carbamazepine phases were significantly greater than those of (R)-fexofenadine. The
mean CL
renalR/S ratio of 0.64 (95% CI 0.51-0.77) in the control phase decreased
significantly to 0.46 (95% CI 0.41-0.50) in the carbamazepine phase (P < 0.001)
(Table 3).
Fig. 6.
(A) Mean (+ SD) cumulative amount of (R)-fexofenadine excreted into urine following
a single oral administration of 60 mg fexofenadine hydrochloride in twelve healthy
volunteers treated with placebo (open squares) or carbamazepine (closed squares). (B)
Mean (+ SD) cumulative amount of (S)-fexofenadine excreted into urine following a
single oral administration of 60mg fexofenadine hydrochloride in twelve healthy
volunteers treated with placebo (open circles) or carbamazepine (closed circles).
Table 3.
Effect of carbamazepine on pharmacokinetic parameters of fexofenadine enantiomers
*
P < 0.05,
**P < 0.01,
***P < 0.001, between control phase and carbamazepine phase.
†
P < 0.05,
††P < 0.01,
†††P < 0.001, between (R)-fexofenadine and (S)-fexofenadine.
Data are shown as mean and 95 % confidence interval ; t
maxdata are shown as a median
with a range.
2.4. Discussion
We investigated the effects of the P-gp inducer carbamazepine on the pharmacokinetics of fexofenadine enantiomers. Similar to the results of previous reports [56,57,59,60], the present study demonstrated that the plasma concentration of (R)-fexofenadine was higher than the corresponding (S)-enantiomer during the control phase, and the stereoselectivity was altered by carbamazepine treatment (Fig. 5).
Carbamazepine significantly decreased the mean AUC
0-24of both enantiomers, but this effect was greater for (S)-fexofenadine, resulting in a mean increase in AUC
0-24R/S ratio from 1.58 to 1.93 (P < 0.01) (Table 3). Previous in vitro studies have suggested that P-gp plays a major role in the efflux of fexofenadine in the small intestine, whereas it has a limited role in biliary excretion [53]. Therefore, the present result may suggest that the P-gp-inductive effect of carbamazepine in the small intestine could result in a decrease of the mean AUC
0-24of both enantiomers and these different effects may be due to the affinity of P-gp for each enantiomer.
In addition, although the t
1/2values were not different between the (R)- and (S)-enantiomers in the control phase, there were significant differences in the t
1/2between both enantiomers in the carbamazepine phases (Table 3). These results may suggest that the present findings of decreasing the t
1/2is due to the combinative induction of the intestinal- and hepatic-efflux transporters including P-gp by carbamazepine, because about two-thirds of bioavailable fexofenadine is estimated to be excreted into bile.
Interestingly, the mean R/S ratio of AUC
0-24did not approach 1.00 in the
carbamazepine phases, implying that a carbamazepine dose of 300 mg may be
insufficient to achieve substantial inductive effects of P-gp-mediated transport.
Furthermore, in the present study, although we did not measure carbamazepine concentration, an assessment of the relationship between plasma carbamazepine concentration and fexofenadine pharmacokinetics would be more informative.
Alternatively, the enantioselective disposition of fexofenadine may not be completely explained solely on the basis of chiral discrimination by P-gp, because fexofenadine is also a substrate of other drug transporters, including OATPs and MRP2. Consequently, the present results suggest that these drug transporters might play roles in the stereoselective pharmacokinetics of fexofenadine [40]. Additionally, although carbamazepine is also known to be an MRP2 inducer [70], little is known about whether carbamazepine is a substrate or an inducer of OATPs. Therefore, the different effects of carbamazepine on the pharmacokinetics of fexofenadine enantiomers may be partially attributed to MRP2, in addition to P-gp.
In the first chaper, we indicated that SLCO (the gene encoding OATP)
polymorphisms strongly associated with the pharmacokinetics of fexofenadine
enantiomers. The pharmacokinetics of (S)-fexofenadine are affected by a
polymorphism of SLCO2B1 in the first chapter. Therefore, these results suggest that
OATP2B1 plays an important role in (S)-fexofenadine pharmacokinetics. Our
findings suggest that a combination of multiple transporters, including OATP2B1,
P-gp, and MRP2, may be strongly influenced by fexofenadine exposure and result in
different dispositions between the enantiomers.
2.5. Conclusion
In conclusion, this study indicates that intestinal P-gp is a key determinant for the
stereoselective pharmacokinetics of fexofenadine, and such stereoselectivity is altered
by carbamazepine, a recognized inducer of P-gp. In addition, because the inductive
effect of carbamazepine to P-gp may be different between the fexofenadine enantiomers
can not eliminate, it is likely that other transporters, including OATP2B1 and MRP2,
also contribute to the stereoselective pharmacokinetics of fexofenadine.
Chapter 3
The Role of Organic Anion Transporting Polypeptides on the
Pharmacokinetics of Fexofenadine Enantiomers
3.1. Effects of multiple rifampicin 450 mg doses on the pharmacokinetics of fexofenadine enantiomers
3.1.1. Introduction
Rifampicin is a potent inducer of the CYP enzyme system and the P-gp transport system, and it markedly reduces the plasma concentrations and the efficacy of these substrate drugs [71,72]. Moreover, since CYP3A substrates considerably overlapped with P-gp substrates, the inductive effects by rifampicin may be occurred through the combination of CYP3A and P-gp [73]. However, recent in vivo studies have shown that rifampicin produces an increase in the exposure to several drugs [16] because rifampicin inhibits 4 types of OATPs i.e., OATP1A2, 1B1, 1B3 and 2B1, in both the gut and liver at several in vitro studies [2,17]. In a recent study, a single dose of rifampicin significantly increases both the C
maxand the total AUC of atorvastatin [74]. Although atorvastatin is a substrate of CYP3A, P-gp and OATPs [74,75], this result indicates that rifampicin may be inhibited the OATPs-mediated hepatic uptake of atorvastatin because the OATPs-inhibition of the intestinal uptake decreases the concentrations of OATPs substrates as shown by fruit juices studies [18,76]. Consistent with this finding, further clinical studies have also shown that a single dose of rifampicin increases the plasma concentration of several OATPs substrate drugs, such as atrasentan, bosentan, glyburide and repaglinide [12-15]. Consequently, these findings are consistent with several in vitro reports [17,77] and suggest that rifampicin is a potent OATPs inhibitor whose effects may be greater on the hepatic uptake than the intestinal uptake.
In multiple-dose rifampicin studies, interactions between rifampicin and OATPs
substrates are caused by various factors. Both ambrisentan and atorvastatin are
substrates of CYP3A, P-gp and OATPs, and multiple doses of rifampicin have no effects on the AUC of ambrisentan [78] but markedly reduce the AUC of atorvastatin [79]. These different influences may be due primarily to the involvement of CYPs and P-gp induction in drug interactions, and followed the extent of OATPs inhibition [16]. In addition, pitavastatin is a substrate of OATPs and P-gp but not CYP3A4, and the AUC is significantly increased to 1.3-fold by multiple doses of rifampicin [80]. This result may be greater in the hepatic OATPs-inhibition than the P-gp induction. In additive to these potential OATPs inhibition, these findings may imply that the multiple-dose rifampicin induces OATPs-mediated transport on biliary and kidney elimination in addition to intestinal absorption [16,71]. Therefore, because of the inhibitory and/or inductive effects of multiple-dose rifampicin on the transports and metabolisms, complex drug-drug interactions have been observed between rifampicin and these substrate drugs.
The first chapter indicated that SLCO (encording OATP) polymorphisms are more associated with the pharmacokinetics of fexofenadine enantiomers than ABCB1 (also MDR1 encoding P-gp) polymorphisms. In addition, single and multiple 600 mg doses of rifampicin significantly increase the concentrations of both enantiomers through the probable inhibition of the OATPs transporters [43].
However, although this study [43] and other previous OATPs-interactions reports used rifampicin 600 mg dose [12-15,74], there is no information of the effect by a simultaneous and clinical doses (450 mg) of rifampicin well used by Japanese patients.
Therefore, the principal aim of the present study was to evaluate the possible
effects of multiple 450 mg doses of rifampicin on fexofenadine enantiomer
pharmacokinetics in Japanese healthy volunteers. Subsequently, by comparing both the
P-gp-inductive and the OATPs-inhibited effects after rifampicin dosing, we examined
which drug transporters contributed to the stereoselectivity of fexofenadine
pharmacokinetics.
3.1.2. Subjects and study design
Ten healthy Japanese volunteers (seven males and three females) were enrolled in this study after giving informed written consent. Each subject was deemed physically healthy by a clinical examination and routine laboratory testing and had no history of significant medical illnesses or hypersensitivity to any drugs. The mean (± SD) age and body weight of the volunteers were 26.1 (± 6.0) years (range 21–39 years) and 60.5 (± 14.3) kg (range 44–95 kg), respectively. This study was approved by the Ethics Committee of the Hirosaki University School of Medicine.
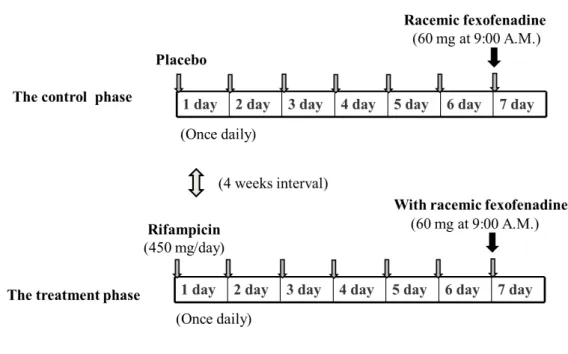
A randomized, double-blinded placebo-controlled cross-over study design with
two phases (a control and a 7-day treatment) was used with an interval of 4 weeks
(Fig. 7). Ten healthy volunteers received either 450 mg of rifampicin in capsule
form (three 150 mg rifampicin capsules, Rifadin
®, Daiichi-Sankyo Pharmaceutical,
Tokyo, Japan) or a matched placebo in capsule form with the same appearance and
size as rifampicin orally once daily at 9:00 A.M. for 7 days. On day 7, a single 60
mg dose of racemic fexofenadine hydrochloride (Allegra
®, Sanofi-Aventis K.K.,
Tokyo, Japan) was co-administered with 200 mL water at 9:00 A.M. after an
overnight fast. Volunteers did not take any medication or fruit juices for at least 7
days before both study phases, and no meals or beverages were allowed until 4
hours after racemic-fexofenadine administration.
Fig. 7. Study design.
Ten healthy volunteers received either 450 mg of rifampicin in capsule form or a
matched placebo in capsule form with the same appearance and size as rifampicin orally
once daily. The order of the two phases was randomly assigned to each volunteer.
3.1.3. Results
Effect of the rifampicin on the plasma concentrations of fexofenadine enantiomers None of the enrolled subjects reported any adverse events during the study, and they completed all phases according to the study protocol.
The mean (+ SD) plasma concentration-time profiles of the fexofenadine enantiomers after a single oral administration of 60 mg fexofenadine hydrochloride in both the control and rifampicin-treated phases are shown in Fig. 8, and the pharmacokinetic parameters are summarized in Table 4. In the control phase, the mean plasma concentrations of (R)-fexofenadine were higher than those of the the (S)-enantiomer (Fig. 8). Similar to our previous results [56,57,59,60], the mean AUC
0-24(P < 0.01) and C
max(P < 0.001) of (R)-fexofenadine were greater than those of the (S)-enantiomer (Table 4). The mean AUC
0-24R/S ratio was 1.54 (95%
CI, 1.38-1.73) (Table 4).
Rifampicin co-administration markedly raised the plasma concentrations of both enantiomers at the final sample point from the initial sample point compared to the enantiomers that were measured during the control phase (Fig. 8). Rifampicin significantly altered the pharmacokinetic parameters, except for the t
1/2and t
max, of both enantiomers (Table 4). Although rifampicin strongly elevated the mean AUC
0-24values of both enantiomers (P < 0.01 for both enantiomers), the mean individual differences between the control and rifampicin phases for the AUC
0-24of (S)-fexofenadine were greater than those of (R)-fexofenadine (P < 0.01) (Fig. 10A).
Rifampicin decreased the mean AUC
0-24R/S ratio from 1.54 to 1.39 (95% CI,
1.30-1.48), but this difference was not significant (Table 4). Although there was no
significant difference in the mean t
1/2between the (R)- and (S)-enantiomers in the
control phase, the mean t
1/2of the (S)-enantiomer was shortened in the rifampicin phase (P < 0.01) (Table 4).
Fig. 8.
(A) Mean (+SD) plasma concentration–time curves of (R)-fexofenadine following a
single oral administration of 60 mg fexofenadine hydrochloride in ten healthy
volunteers treated with placebo (open squares) or rifampicin (closed squares). (B) Mean
(+SD) plasma concentration–time curves of (S)-fexofenadine following a single oral
administration of 60 mg fexofenadine hydrochloride in ten healthy volunteers treated
with placebo (open circles) or rifampicin (closed circles).
Effect of the rifampicin on the urinary excretion of fexofenadine enantiomers The time profile means (+ SD) Ae
0-24of fexofenadine enantiomers in both phases are shown in Fig. 9, and the urine pharmacokinetic parameters are summarized in Table 4. In contrast to the majority of (R)-fexofenadine plasma concentrations in the control phase, the Ae
0-24of (S)-fexofenadine was slightly higher than that of (R)-fexofenadine (Fig. 9). Although the mean CL
renalof (S)-fexofenadine was significantly higher than that of (R)-fexofenadine (P < 0.01), the mean Ae
0-24values were not different between the (R)- and (S)-enantiomers.
During the rifampicin pretreatment phase, the Ae
0-24of (S)-fexofenadine was not
different between the control and rifampicin phases, even though rifampicin
significantly increased the plasma concentrations of both fexofenadine enantiomers
(Fig. 9). While the Ae
0-24of (R)-fexofenadine was markedly decreased in the
rifampicin phases (P < 0.05) (Fig. 9 and Table 4), and then there were significant
differences in the mean Ae
0-24values between the (R)- and (S)-fexofenadine
enantiomers (P < 0.001) (Table 4). Although rifampicin significantly decreased the
CL
renalof both enantiomers (P < 0.01 for both enantiomers), the mean individual
differences for the CL
renalof (R)-fexofenadine had a greater trend compared with
those of (S)-fexofenadine (P < 0.001) (Fig. 10B). From the above-mentioned results,
the mean CL
renalR/S ratio of 0.64 (95% CI, 0.58-0.69) was slightly decreased to 0.59
(95% CI, 0.52-0.66) in the rifampicin phase; however, the mean CL
renalR/S ratio
was not different between control and rifampicin phase (Table 4).
Fig. 9.
(A) Mean (+ SD) cumulative amount of (R)-fexofenadine excreted into urine following
a single oral administration of 60 mg fexofenadine hydrochloride in ten healthy
volunteers treated with placebo (open squares) or rifampicin (closed squares). (B) Mean
(+ SD) cumulative amount of (S)-fexofenadine excreted into urine following a single
oral administration of 60mg fexofenadine hydrochloride in ten healthy volunteers
treated with placebo (open circles) or rifampicin (closed circles).
Fig. 10.
(A) The differences between the control (open bars) and rifampicin-treated groups (closed bars) for the mean AUC
0-24of (R)- and (S)-fexofenadine. (B) The differences between the control (open bars) and rifampicin-treated groups (closed bars) for the mean CL
renalof (R)- and (S)-fexofenadine.
Data are shown as the mean + SEM.
*
P < 0.05,
**P < 0.01,
***P < 0.001, between control phase and rifampicin phase.
†
P < 0.05,
††P < 0.01,
†††P < 0.001, between (R)- and (S)-fexofenadine.
Table 4.
Effect of rifampicin on pharmacokinetic parameters of fexofenadine enantiomers
*
P < 0.05,
**P < 0.01,
***P < 0.001, between control phase and rifampicin phase.
†