厚生労働行政推進調査事業費補助金(厚生労働科学特別研究事業)
分担研究報告書
諸外国のフィジシャン・アシスタント(PA)に関する研究
(分担項目:米国におけるフィジシャン・アシスタント)
研究分担者 小曽根早知子 筑波大学医学医療系・講師
研究代表者
武田裕子順天堂大学医学部医学教育研究室・教授
研究要旨
A.
研究目的医師の働き方改革を進める中で、日本に は存在しない職種であるフィジシャン・ア シスタント(Physician Assistant: PA)に ついて、業務範囲や医師の負担軽減への効 果、医療の質への影響などを明らかにし、わ が国への
PA
の適用の検討に必要な資料を 作成する。B.
研究方法イ ン タ ー ネ ッ ト を 用 い た 検 索 及 び
PubMed
による文献検索、書籍による情報収集を行った。また、2017 年
10
月26-28
日 に
Physician Assistant Education Association
(PAEA)年次総会に参加し、米国の
PA
養成課程の教育責任者、参加者 から情報収集を行った。また2018
年2
月2
日、4日にStanford
大学のPA
養成課程の 責任者、教育担当者等から情報収集を行う とともに、適宜、電子メールにて質問事項を 送りさまざまな資料提供、および回答を得 た。2月5
日にはVIA office
にて非医療関 係者からPA
に関する認識について情報を 得た。インターネットを用いた情報収集では、
American Association of Physician Assistants
(AAPA)(1)、
米国医学会(AMA)(2)
、Physician Assistant History
研究要旨:医師の働き方改革を進める中で、日本では存在しない職種であるフィジシャン・アシ スタント(PA)の適用を検討するために、米国のPA
について、文献検索や関連機関のホーム ページの検索、資料収集、および現地訪問により関係者へのインタビューを実施した。米国で は、1960
年代に医療ニーズの増大に伴いプライマリ・ケアの担い手としてPA
養成が開始され、医師を補助する専門職としての地位及び存在感を着実に向上させてきた。特に
2003
年のレジデ ント勤務時間制限、オバマケア導入による医療者不足と医療ニーズの増大がPA
増員に影響し、現在では約
10
万人のPA
が、プライマリ・ケアに留まらず、内科、外科ほか各専門分野で、医 師の監督下に患者の診療や手技などを幅広く行っている。PA
は医師及び他職種の業務負担軽減 に貢献し、他職種及び患者からの評価も高い。米国での各医療現場でPA
への期待は高く、今後 も年間約1
万人ずつPA
が養成される見込みである。Society(3)
、Physician Assistant Education Association
(PAEA
)(4)
、National Commission of Certification of Physician Assistants
(NCCPA
)(5)
、United States Department of Labor (6)な
らびにPA
養成課程を有する大学のウェブ サイトを活用した。C.
結果1.
米国におけるPA
(Physician Assistant)の定義
American Association of Physician Assistants
(AAPA)House of Delegates
は、PA
は以下のように定義している(1995年)(7)。
“PAs are health professionals licensed to practice medicine with physician supervision. PAs are qualified by graduation from an accredited PA educational program and/or certification by the National Commission on the Certification of Physician Assistants.
Within the physician-PA relationship, PAs exercise autonomy in medical decision- making and provide a broad range of diagnostic and therapeutic services. The clinical role of PAs includes primary and specialty care in medical and surgical practice settings in rural and urban areas.
PA practice is centered on patient care and may include educational, research, and administrative activities.”
(PA は医師の監督を受けて医療を提供す る認可された医療従事者である。
PA
は認定 されたPA
教育プログラムの卒業および/また は
National Commission on the Certification of Physician Assistants
の認 定を受けることで資格を得る。医師とPA
と の関係において、PA
は医学的意思決定に置 いて自立性を発揮し、幅広い診断および治 療的サービスを提供する。PA
の臨床的役割 には、農村部および都市部における医療お よび外科的診療環境でのプライマリおよび 専門的ケアが含まれる。PA
は患者中心のケ アを提供し、それには教育、研究、行政活動 も含まれる。)2.PA
の統治組織米 国 医 学 会 (
American Medical Association
:AMA)に支持される形で発足
し たAmerican Academy of Physician Assistants
(AAPA)がPA
の組織を構成し て い る 。 資 格 認 定 試 験 はNational Commission on Certification of Physician Assistants(NCCPA)が実施している。
Physician Assistant Education Association
(PAEA)は教育に関する学会で あ り 、 教 育 機 関/
プ ロ グ ラ ム の 認 定 は 、Accreditation Review Commission On Education for the Physician Assistants
(ARC-PA)が実施している。
3.PA
設立の経緯、歴史的背景(3) (7) (8) 医療資源が乏しい環境で医師以外の者が 医療を提供する状況については、へき地や 軍隊を中心に1650
年代から長い歴史があ る。特に戦時中の軍隊ではその需要が大き く、医師でない者が軍隊や軍艦内での急性 期治療を行っていた。第二次世界大戦中には戦地での医師不足 が深刻となり、米国では医師の代わりに、今 日 の
PA
と 非 常 に 類 似 し た 業 務 を 担 うMedical Administration Corps (MAC)を
配置していた。1960
年代には米国医学会(AmericanMedical Association:AMA)が PA
のコン セプトを支持してPA
養成プログラム認定 が始まり、1968
年にはAmerican Academy of Physician Assistants(AAPA)が発足し
た。PA
養成が支持された背景には、戦時中 に養成された医療技術を持った退役軍人の 存在の他、医師の専門分化、プライマリ・ケ アを担う医師の不足、貧困、メディケアとメ ディケイド創設による医療ニーズの増大な どがあった。このためPA
には、医師の監督 下でジェネラリストとして幅広く診療を提 供することが求められた。1970
年代には専門職としてのPA
の地位 が徐々に確立し、1980年代にはPA
は全米 に広がった。この頃にはほぼ全ての州で医 師自身の業務の範囲であればPA
にその役 割を委任することと、医師の監督下でPA
が 処方する権利を認める法改正が行われた。また、プライマリ・ケア領域の診療が主な役 割であった
PA
の中でも専門分化が進むよ うになった。1990
年代には地域病院が提携 する小さな大学でも認定プログラムが発足 するようになり、1999
年には認定プログラ ム数は114、認定 PA
数は45,000
人となっ た。PA
の需要は供給を上回る勢いで増加し、認定
PA
養成プログラム、修了者数とも順 調に増加した。2000
年代からは、米国以外の国々でもPA
が注目されるようになり、カナダ、英国、ドイツなどでも
PA
養成プログラムが発足 した。米国でもこの時期に特にPA
数が増 加したが、これにはいくつかの社会的事情 の影響もあった。一つは2003
年に米国レジ デントの勤務時間を週80
時間以内に制限 するduty hour regulation
が導入されたこ とである。これにより、これまで研修として 長時間労働を担っていたレジデントの業務 を代替する人員として、病院に多くのPA
が 採用されるようになった。もう一つは、オバ マ 大 統 領 に よ る2010
年 のPatient Protection and Affordable Care Act
の制定 である。これにより、米国の医療保険受給対図 1 1
象者が約
3000
万人増加することが予想さ れ、急激な医療ニーズの増大が見込まれた のである。2017年現在、全米の認定PA
プ ログラム数は200
以上、認定PA
数は累計10
万人以上となり、約1
万人/年が新たにPA
になると見込まれる(図1、2)
。4. PA
養成課程(年数、カリキュラム) (1)(4) (9)
米国での
PA
資格取得には、学士取得後 にPA
養成プログラムに進学して修了し、認定試験(Physician Assistant National
Certifying Exam:PANCE)に合格する必
要がある。PA
養成プログラムの多くでは、応募要件 に化学、生理学、解剖学、微生物学、生物学 などの基礎科目修了と、3 年間の医療現場 での患者ケア経験を課している。医療現場 経験としては、医療助手、救急医療技術者、救 命 士 、 医 療 隊 員 (
medic or medical corpsman)
、平和部隊ボランティア(PeaceCorps volunteer)、研究助手 /
採血者(labassistant/phlebotomist)
、登録看護師、救急 室技術者、外科技術者、認定看護助手などが ある。標準的なプログラムは約
26
か月(3年間)で、約
1-1.5
年間の講義と2000
時間以上の 臨床実習からなる。プログラム修了にて修 士資格が与えられる。講義の内容は、解剖 学、生理学、生化学、薬理学、臨床診断、病 理学、微生物学、臨床検査学、行動医学、医 療倫理などである。臨床実習は、クリニッ ク、急性期または慢性期ケア施設でのプラ イマリ・ケアに重点が置かれ、家庭医療、内 科、産婦人科、小児科、一般外科、救急医療、精神科などで行われる。
図 2 1
PA
養成プログラムでは、プライマリ・ケ アに従事することに主眼をおいた教育が行 われる。医学生が4
年間で学ぶ内容のうち 基礎的かつ実践的な内容を中心に扱いなが ら、医学部と同じモデルの内容を2
年間に 凝縮して教育する。医療環境の変化に対応 して貧困層への医療提供を見据えたプログ ラムや、予防医学、中毒とその予防、ホーム レスへのケア、女性医学、老年医学、環境医 学、精神医学、健康教育、疫学、臨床倫理な どを取り入れるプログラムもある。(7)PA
養成プログラムが設立された当初は、医師が教育の中核を担っていたが、近年で は
PA
および医師の教員が教育に従事する ようになっている。また、一部の講義につい ては医学生とPA
学生とが一緒に講義を受 ける体制をとるプログラムもある。臨床実 習では、PA
学生は基本的に医学生と同等に 扱われ、一緒に同じ内容の実習を受けてい る。医学生とPA
学生とで臨床実習での到 達レベルに目立った差異はないようである。PA
学生が経験するスキル一覧を表1に示 す(7)。PA
養成プログラムへの入学倍率は平均3.5
倍(2015年)と医学部と同程度であり、最も人気のある専攻の一つとなっている。
入学前の専攻は生物学、心理学、健康科学、
運動、看護、医療科学、
premedical、科学な
どが多い。他職種からの移行について、編入 などの特別な措置はない。人気の理由は、医 学部と比べて受験要件が厳しくないが患者 診療に直接携われること、就学年数が短く 資格取得後も長期間の研修を必要とせずに 専門職として勤務できること、専門領域を表1
比較的容易に変更できること、給与レベル が高いことが挙げられている。
志望者の平均年齢は
26
歳(2014年)であり、約
75%が女性であった。PA
に女性が占める割合も
75%程度であり、1985
年 以降その割合は増加傾向にある。全米の
PA
養成プログラムのうち、約4
分 の1
が公立、その他は私立である。公立で の授業料は平均で約6-7
万ドル、私立で4- 13
万ドルである。1学年あたりの生徒数は18
人から100
人余と幅がある(表2)(7)。
5. PA
資格試験・CPD・再認定試験(1) (5)PA
の 資 格 認 定 ・CPD
(Continuing Professional Development)
・再認定試験はNational Commission on Certification of Physician Assistants (NCCPA)が行って
いる。認定PA
養成プログラムの修了生は、NCCPA
が 実 施 す る 認 定 試 験 で あ るPhysician Assistant National Certifying
Exam (PANCE)の受験資格を得る。試験
は1
日間(6時間)で300
問のMCQ
とな っている。以前は、臨床技能テストも実施さ れていたが現在は行われていない。試験合 格率は例年96%程度である。
PANCE
に合格し、定期的に認定を維持す れ ば 認 定
PA
(Physician Assistant- Certified:PA-C)と名乗ることができる。
実際に
PA
として診療するためには、各州 でライセンスを得る必要がある。州のライ センス取得には、認定PA
プログラム修了と
PANCE
合格が求められる。認定維持には
2
年ごとに100
時間以上のCME
(Continuing Medical Education)単 位を取得し、6
年または10
年ごとに再認定 試 験 (Physician Assistant National Recertifying Exam:PANRE)受験が必要
である。最近では、PANRE
に代わる新たな パイロットプログラムも予定されている(10)。
CME
ではself-assessment CME
とPI
表2
(Performance Improvement)-CMEに重 点が置かれる。
Self-assessment CME
では、主に知識、患者ケア、診療に基づく学習と改 善について、
PA
の能力を見直すことを目的 としている。PI-CME では診療現場での質 改善活動を計画・実施・評価し、診療に基づ く学習・改善に関するコンピテンシーに取 り組むことを目的としている。CME
単位取 得に関する情報はNCCPA
ホームページに て情報提供され、各PA
はログインしてCME
単位登録を行う。近年では専門分化して診療する
PA
も多 いが、PANRE では全ての領域の知識を問 う内容となっており、PA
は定期的に幅広い 知識のアップデートが求められる。これは ジェネラリストとしてあらゆる医療現場に 従事することが可能なPA
の特性を担保す るものである。6.
実施可能な医行為の範囲及びその範囲 が決定された経緯一般に
PA
は医師の監督下で以下のよう な業務を行う。・患者の病歴聴取、身体診察、検査オーダー とその解釈、診断、治療、処方
・予防医療の提供
・手術の補助
・病院や施設の回診
・臨床研究
PA
が実際に行う業務内容は、米国の各州 の法律、診療のセッティングや専門領域、そ れぞれの経験や専門性、監督する医師との 関係性、現場でのニーズにより大きく異な る。PA
の業務範囲を規定する各州の法律で は、州により、診療録に医師のカウンターサ インを求める程度(不要、全体の5%、 PA
の 経験により異なる、全例に必要、など)、医 師1
人あたりの監督可能なPA
数(規定な し、2
人、4
人、6
人までなど)、処方可能な 薬剤の範囲(処方不可、一部の薬剤、多くの 薬剤など)、医師の監督・協働要件などがそ れぞれ異なる(11)。PA
の業務範囲は診療のセッティングに よっても異なる。病院や診療所であれば、医 師と直接または電話等でやり取りをして診 療する。一方、へき地の診療所で医師が常駐 しないようなセッティングでは、医師が不 在時には必要に応じて遠隔指示を仰ぎなが らプライマリ・ケアを提供する。へき地に勤 務するPA
は、患者教育、処方と調剤、画像 診断、診断、患者の紹介など幅広い業務を行 う(表3、図 3)(7) (12) (13)。
表
3
診療科ごとにも
PA
が行う業務の内容は 大きく異なる。プライマリ・ケアでは、PA は医師と並列で急性および慢性疾患をもつ 患者の診療を行い、診療のアクセシビリテ ィや継続性の向上に貢献している。外科で は手術創の閉創、術前から術後管理などを提供する。小児科は小児の診療や予防接種、
健診などを行う。その他、
PA
が皮膚科、神 経内科、整形外科、放射線治療科で診療する 症状と疾患、手技を表に示す(表4-9) (7) (14)。
図
3
表
4
表
5
表
6
表
7
表
8
この他、PAの業務範囲は、PAの診療経験 とその適性、監督する医師との関係性、現場 でのニーズによりその時々でも変化してき た。またそれに応じて、医師の診療や研修の あり方にも大きく影響してきた。以下にそ の一例を挙げる。
外科領域では、研修医の就業時間が週
80
時間以内に制限された前後で、医師とPA
の 業務範囲は大きく変化した。就業時間制限 前には、外科研修医は長時間勤務し、術後管 理やオーダー、書類業務など様々な業務を 行っていた。しかし制限後、外科医はより手 表9
術の中心的な手技(例えば心臓冠動脈バイ パス術であれば、冠動脈とバイパス血管を 縫合する手技)に集中するようになり、それ 以外の業務(手術室の準備、麻酔状態の確 認、開創、閉創、術後の病棟管理、オーダー 記載、書類作業、術後外来など)の大部分を
PA
が行うようになった。さらにPA
の中で も、それぞれの適性に応じて、心臓冠動脈バ イパス術であればバイパス用の静脈採取を 中心的に行う人がいるなど、より専門分特 化した役割を担うようになった。これによ り、医師はより専門に特化した研修、業務を 行うようになった。このように、
PA
の普及と時代の変化とと もに、PA
に求められる役割は多様化してき ている。最近ではPA
の裁量権の拡大や、自 立した診療を推進しようとする動きもある が、米国医学会(AMA)はこれに否定的で あり、PA
はあくまでも医師の指示・監督下 で診療を行うよう声明を発表している。7.
実施した医行為に関する責任の所在PA
は他の医療専門職同様、州のライセン スを得た医療従事者として自身の医療過誤 に対して個々に責任が発生する。また、状況 に応じてPA
の雇用主、監督する医師にも 責任が発生する。米国医学会(AMA)は、医師と
PA
による診療の責任の所在につい て以下のようなガイドラインを発表してい る(2011年)(7)。・医師には、すべての診療現場において、患 者ケアをマネジメントする責任がある。
・医師と
PA
により提供される診療行為は、州法により規定された各職種の診療範囲
内でなければならない。
・医師には、患者へのケアの調整やマネジ メント、および
PA
からの適切な情報提 供により患者のケアの質を担保すること への最終責任がある。・医師は、全ての診療現場で
PA
の監督責 任を負う。・
PA
が診療で担う役割は、医師とPA
とで 合意が得られ、医師の委任様式に基づい た指針により規定されるべきである。・医師は、対面または遠隔、その他の方法で、
PA
からの相談を受けられる体制を取る 必要がある。・
PA
がアセスメントや治療に関わる範囲は、患者の状態の複雑性や的確さ、
PA
の経験 や準備状態に応じて医師が調整すべきで ある。・患者に対して、医師か
PA
による診療か を常に明確にする必要がある。・医師と
PA
は、診療について互いに合意 した指針と、委任された診療について常 に振り返る必要がある。・医師は、自身の監督方法と患者ケアの委 任方法について、
PA
に明示し慣れさせる 責任がある。すなわち
PA
と医師が協働して診療を行 う際には、PA
と医師共に、それぞれに見合 っ た 役 割 を 全 う す る 責 任 が 発 生 す る 。AAPA
は診療を行うPA
に対して職業賠償 責任保険に加入することを推奨している。保険には、個人加入と雇用主によるグルー プ加入とがある。
PA
の職業賠償責任保険にかかる費用は、雇用主が全額支払う場合がほとんど(97%
以上)である。
8.
従事場所2013
年のAAPA
による調査によると、診療を行う
PA
の主たる専門領域は以下の 通りである(15)。・プライマリ・ケア
32%
・外科サブスペシャリティ
27%
・その他サブスペシャリティ
19%
・救急医療
11%
・内科サブスペシャリティ
10%
・小児科サブスペシャリティ
2%
診療現場種別の内訳は以下の通りである。
・単一専門科のグループ診療
18.7%
・病院の内科(ICU/CCU以外)
10.6%
・単独外来診療
10.4%
・病院救急外来
9.5%
・複数専門科のグループ診療
9.2%
・病院外来
7.3%
・病院手術室
6.0%
・その他
28.3%
1980
年代はPA
の約50%がプライマリ・
ケアに従事していたが、
PA
の全体数が増え るにつれて外科系や専門診療科に勤務するPA
の割合が増加しており、PAの専門分化 と多様化が進んでいることが分かる(表10、
11)(7)。一方で精神科、麻酔科、病理、小
児科、産婦人科、老年科、放射線科などでは まだ少ないなど、専門領域によりその普及 の度合には差がある。PA
は全米で着実に増加傾向ではあるもの の、PAの地域偏在は大きい。州ごとのPA
数には人口10
万人対5.7
人から71.2
人と 幅が大きい(2015 年)。都市部への偏在も 大きく、PA
の85.3%が都市部(うち 52.6%
が人口
100
万人以上の大都市)にいる一方、田舎や僻地で診療する者は
14.6%に留まっ
ている(AAPA、2015年)(16)。表
10
表
11
9.
給与水準(7) (16)PA
の給与水準は2000
年から2015
年ま で一貫して上昇傾向である。PA
の給与の中 央値は$92,970($62,030 から$130,620)であり、米国の平均給与の約
2
倍である(表12)
(2014年)。時給では、平均$44.70であった(2013年)。
診療する州や専門によっても給与は異な
る(表
13、14)。プライマリ・ケアでは
$90,000
に対し、外科サブスペシャリティでは$102,000であった(2015年)。
表
13
表14
表
12
10.
他の職種との業務の棲み分け・役割分 担、特に看護師やナース・プラクティショナ ー(NP)との違い(7) (6)PA
と類似した職種として、NP、Nurseanesthetist
( 麻 酔 専 門 看 護 師 )、Nurse
midwife
(看護助産師)があり、これらを総称 し て
advanced practice registered nurses (APRNs)と呼ぶ。以下では最も一般
的なNP
とPA
との関係性について記載す る。PA
とNP
は、その確立時期、理念とも共 通する部分が多く、提供する医療サービス も類似している。2013年時点で、PAの約3
分の1、NP
の約3
分の2
がプライマリ・ケア(家庭医療、総合内科、小児科、産婦人 科)で勤務するが、
NP
の方がPA
よりも小 児科、婦人科、女性医療で勤務する割合が高 い。PA
とNP
は、養成課程は異なるものの、医療現場において担う役割は類似しており、
同じセッティングでは給与も同等である。
PA
と異なりNP
は独立して診療すること が可能であるが、いずれの職種もその制限 は随時変化しているため、その差異を一概 に定義することは難しい。いずれの職種も同様に周囲の環境により その役割を定義されるため、類似点の方が 多いと言える。実際、経験を積んだ
PA
とNP
では現場の医療チーム内で担う役割に は大きな違いがない場合も多く、現場レベ ルでは職種ごとの棲み分けよりも個々の適 性に応じた役割が期待されているようであ る。また、
PA
やNP
のようにより専門性の高 い医療職種をAdvanced Practice Provider
(APP)と総称する。スタンフォード大学 病院には
Center for Advanced Practice
部門があり、
APP
に認められるより高度な手 技等について、病院独自のstandardized procedure(標準手順書)を作成している。
このような職種によらない手技等の標準化 に加えて、この部門では入職時より各
APP
がそれぞれに実施可能な手技等の情報を管 理している。このように職種横断的に各人 の技能の標準化を図っているため、現場レ ベルでのPA
とNP
の差異はさらに小さく なっている。11.
医師の業務負担軽減効果・医療アウト カムの非劣性医師の業務負担軽減効果
2001
年から2010
年の全米を対象とした 調査では、全外来診療のうち5.3%を PA
が、9.1%を NP
が担っていた。さらに非大都市(non-metropolitan statistical area: non-
MSA)
では、全外来診療の17.3%を PA
が、18.4%を NP
が担っており、特にPA
が非 大都市での医療を支えていることがうかが える(表15)(7) (17)。
この他、以下のような報告がある。
・研修医の勤務時間制限が開始される以前 から、
PA
は研修医により行われていた業 務を代替する傾向にあった(表16) (7, 18)。
・
PA
やNP
がプライマリ・ケア診療を行う 割合が高いほど、一診療あたりの医療職 の労働コストおよび全体の労働コストが 低くなる(図4)(7) (19)。
表
15
・PA が病院外科に配属されたことにより、
レジデントの勤務時間が半年間で平均
102
時間/週から87
時間/週に減少した(20)。
・プライマリ・ケアでの
PA
の貢献に関す るレビューでは、PA により医師の生産性が向上したとの報告がある一方、医師が
PA
を監督する時間が係るようになったと の報告もあった。PA の監督業務について は、患者診療に関して医師の即座なサポー トを必要とする確率は低いとの報告が多 かった(21)。表
16
図
4
医療アウトカムの非劣性
PA
による医療アウトカムについては、医 師と比較して劣らないと報告されている。・PA/NPによる
HIV
診療は、HIVを専門 とする医師と同等であり、HIV専門では ない医師よりも優れていた(22)。・家庭医療での糖尿病患者の診療で、
NP
が いる診療では医師のみの診療よりもヘモグロビン
A1c、脂質を測定する割合が高
く、脂質の管理目標値達成率が高かった。
PA
がいる診療は医師のみの診療と比較 して、糖尿病患者の管理について差がな かった(23)。・COPDによる緊急入院を経験した患者に
対する
PA
とNP、および医師による診療
とでは、
PA
とNP
の方が短時間作用方気 管支拡張薬の処方、酸素治療、呼吸器専門 医への紹介が多かったが、救急外来受診 は少なかった(24)。・救急外来での創傷治療に対する創部感染 率は、医師と
PA
の診療で差がなかった(25)。
・
PA
と研修医とで、脳血管障害、肺炎、心 筋梗塞生存例、うっ血性心不全、上部消化 管出血に対する入院治療での検査等の病 院資源の使用、入院期間を比較したとこ ろ、PA
の方が肺炎治療に用いる資源が少 なかったが、それ以外では差がなかった(表
17)(7) (26)。
表
17
12.
他職種によるPA
の評価医師をはじめ他職種の
PA
導入に対する 評価は高く、患者のPA
の診療に対する満 足度も高い(27)。また、PA自身の職業満足 度も概して高い(28)。PA
を導入した医療機関からは、PA導入 に対する否定的な意見はほとんど聞かれな いようである。あえて挙げれば、
PA
の存在を最も脅威と 感じるのは研修医のようである。数ヶ月単 位で科をローテーションする研修医に対し て、PA
は単一の部署で同じ業務を繰り返す 事が多いため、その業務に関しては研修医 よりも熟達度が高い場合が多い。熟練したPA
の存在が、臨床経験を積みたい研修医の 機会を奪う可能性を危惧する声や、PA
に指 導を受けることに抵抗感を示す研修医もい るという声もある。一方、PA にとっては、日常業務の一部を研修医に提供することに 特に抵抗はない。むしろ良き指導者、あるい は研修医にとってのコアな学習領域以外の 業務の担い手として、研修医教育に貢献し たいというスタンスをとり、技術を伝える 役割を果たしている。
PA
が適切なコミュニ ケーションおよびチームワークを発揮すれ ば、研修医の研修の質を向上させられる可 能性がある。D.
考察米国では
1960
年代と最も古く正式なPA
導入が始まり、医療ニーズの増大などを背 景に着実に医療現場での地位を獲得し、現 在ではPA
数で約10
万人にまで発展した。米国では
PA
養成プログラム、PA
国家資格 制度が確立している。PA
は医師の監督下で診療を行い、その業 務は各州の州法により規定されているが、実際には個々の
PA
の経験や、監督する医 師との関係性によりその診療範囲は異なる。PA
は導入当初のプライマリ・ケアの担い手 としての存在から、徐々に各専門領域に特 化した働き方が増え、PA
の地域偏在も見ら れている。外科領域では、PA
の存在により 外科医はより専門的な手技にのみ集中する ようになるなど、医師の専門特化を促進す る要因となっている可能性があると考えら れた。PA
の存在による他職種の業務負担軽減 効果、PA
の医療アウトカムについての報告 は多数あり、いずれもPA
の効果に前向き な報告が多いが、研究上の制約からエビデ ンス・レベルの高いものは限られている。医療現場での
PA
のニーズは引き続き増 加傾向であり、それに伴いPA
の給与水準 も上昇傾向にある。今後もこの傾向が続き、米国の医療システムの中で
PA
の存在感が 増大していくことが予想される。患者満足 度も高いが、その背景には、信頼に足る医療 の提供に加え、医師による診療を受けるに は時間がかかるなど、医療へのアクセスが 困難な背景もあると思われた。PA
の存在により医師の業務負担が軽減 している点からは、日本でもPA
のような 高い専門性を持った医療職が現場に貢献で きる可能性は高い。一方、PA
は医療チーム の一員として、高い臨床能力と、医師をはじ め他職種と対等な立場でチームを作れるコ ミュニケーション能力が求められる専門職 である。そのようなPA
を養成し現場で機 能させるためには、質の高い教育体制と、PA
の専門性についての現場への教育が不可欠となると考えられる。また、医療の受け 手である国民の理解も不可欠である。
E.
結論米国では
PA
が幅広く普及し、高い専門 性を持った医療職として診療をしていた。PA
はプライマリ・ケアに留まらず幅広い分 野で診療し、今後もそのニーズは高まるこ とが予想される。F.
健康危険情報-該当なしG.
H.
研究発表-該当なしI.
知的財産権の出願・登録状況(予定を 含む)なし
参考資料(添付資料)
1. American Association of Physician Assistants. Available from:
https://www.aapa.org/.
2. American Medical Association.
Available from: https://www.ama-assn.org/.
3. Physician Assistants History Society. Available from: https://pahx.org/.
4. Physician Assistant Education Association. Available from:
http://paeaonline.org/.
5. National Commission of Certification of Physician Assistants.
Available from: https://www.nccpa.net/.
6. United States Department of Labor. Available from: https://www.dol.gov/.
7. Hooker SR, Cawley FJ, Everett
MC. Physician Assistants: Policy and Practice. Fourth Edition ed. Philadelphia, PA: F. A. Davis Company; 2017.
8. Piemme ET, Sadler MA, Carter DR, Ballweg R. The Physician Assistant: An Illustrated History. Gilbert, Arizona: Acacia Publishing; 2013.
9. Accreditation Review Commission on Education for the Physician Assistant.
Available from: http://www.arc-pa.org/.
10. NCCPA Certification Maintenance
Process. Available from:
https://www.nccpa.net/maintaincertificatio n.
11. American Medical Association.
Physician assistant scope of practice. 2018.
Available from: https://www.ama- assn.org/sites/default/files/media-
browser/public/arc-public/state-law- physician-assistant-scope-practice.pdf.
12. Hooker RS, Dehn R. Procedures performed by Iowa family practice physician assistants. Journal of the American Academy of Physician Assistants.
1999;12(4):63-77.
13. Aspery D. Clinical skills utilized by physician assistants in rural primary care settings. Journal of Physician Assistant Education. 2006;17(2):45-7.
14. Taft JM, Hooker RS. Physician assistants in neurology practice. Neurology.
1999 Apr 22;52(7):1513.
15. American Association of Physician
Assistants. 2013 AAPA Annual Survey
Report. Available from: http://kc.edu/wp-
content/uploads/2015/11/2013-AAPA-
annual-report.pdf.
16. American Association of Physician Assistants. 2016 AAPA Salary Report. 2016.
17. Hooker RS, Benitez JA, Coplan BH, Dehn RW. Ambulatory and chronic disease care by physician assistants and nurse practitioners. The Journal of ambulatory care management. 2013 Oct-Dec;36(4):293- 301.
18. Riportella-Muller R, Libby D, Kindig D. The substitution of physician assistants and nurse practitioners for physician residents in teaching hospitals.
Health affairs. 1995 Summer;14(2):181-91.
19. Roblin DW, Howard DH, Becker ER, Kathleen Adams E, Roberts MH. Use of midlevel practitioners to achieve labor cost savings in the primary care practice of an MCO. Health services research. 2004 Jun;39(3):607-26.
20. Victorino GP, Organ CH, Jr.
Physician assistant influence on surgery residents. Archives of surgery. 2003 Sep;138(9):971-5; discussion 5-6.
21. Halter M, Drennan V, Chattopadhyay K, Carneiro W, Yiallouros J, de Lusignan S, et al. The contribution of physician assistants in primary care: a systematic review. BMC health services research. 2013 Jun 18;13:223.
22. Wilson IB, Landon BE, Hirschhorn LR, McInnes K, Ding L, Marsden PV, et al.
Quality of HIV care provided by nurse practitioners, physician assistants, and physicians. Annals of internal medicine.
2005 Nov 15;143(10):729-36.
23. Ohman-Strickland PA, Orzano AJ, Hudson SV, Solberg LI, DiCiccio-Bloom B, O'Malley D, et al. Quality of diabetes care in family medicine practices: influence of nurse-practitioners and physician's assistants. Annals of family medicine. 2008 Jan-Feb;6(1):14-22.
24. Agarwal A, Zhang W, Kuo Y, Sharma G. Process and Outcome Measures among COPD Patients with a Hospitalization Cared for by an Advance Practice Provider or Primary Care Physician. PloS one. 2016;11(2):e0148522.
25. Singer AJ, Hollander JE, Cassara G, Valentine SM, Thode HC, Jr., Henry MC.
Level of training, wound care practices, and infection rates. The American journal of emergency medicine. 1995 May;13(3):265-8.
26. Van Rhee J, Ritchie J, Eward AM.
Resource use by physician assistant services versus teaching services. JAAPA : official journal of the American Academy of Physician Assistants. 2002 Jan;15(1):33-8, 40, 2.
27. Henry LR, Hooker RS. Caring for the disadvantaged: the role of physician assistants. JAAPA : official journal of the American Academy of Physician Assistants.
2014 Jan;27(1):36-42.
28. Hooker RS, Kuilman L, Everett CM. Physician Assistant Job Satisfaction: A Narrative Review of Empirical Research.
The journal of physician assistant education : the official journal of the Physician Assistant Education Association.
2015 Dec;26(4):176-86.
添付資料
米国 PA の全国データの要約
出典: American Academy of Physician Assistants: Salary Report 2016
(抜粋 p. 5-21)
SALARY REPORT As. All rights reserved. Not for distribution or reproduction.5
SUMMAR Y OF N A TION A L FINDINGS
2016AAPA SALARY REPORT © 2016 American Academy of PAs. All rights reserved. Not for distribution or reproduction.6Who Ar e P A s?
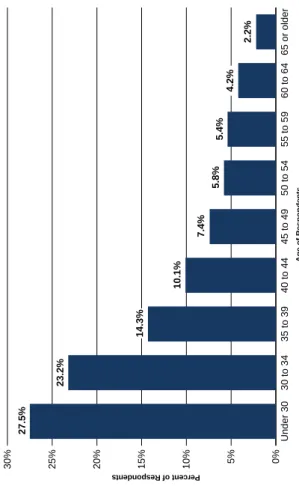
PAs are state licensed and nationally certified to practice medicine. For nearly 50 years, PAs have been part of the healthcare team in American medicine. PAs are educated at the graduate level, and they practice in every medical and surgical specialty and setting. With a strong foundation in general medicine, PAs are able to adapt to changing healthcare needs and adapt to a wide variety of clinical practice settings and specialties. In their clinical roles, PAs obtain medical histories, perform physical examinations, diagnose and treat illnesses, order and interpret lab tests, assist in surgery, prescribe medications, coordinate care, provide patient education and counseling, and make rounds in hospitals and other inpatient facilities. PAs are educated in medical schools, colleges and universities in rigorous, nationally accredited programs that comprise classroom and laboratory instruction and clinical rotations. Programs average about 27 months in length. The program begins with one year of didactic instruction in the basic medical and clinical sciences, including anatomy, physiology, pathology, microbiology, pharmacology, behavioral sciences, medical ethics and clinical medicine. The second year comprises clinical rotations in all of the major specialties of medicine, including internal medicine, general surgery, pediatrics, women’s health, emergency medicine, psychiatry and family medicine. Entering students typically possess a bachelor’s degree, along with an average of four years of healthcare experience. PA program graduates must pass a national PA certifying exam (administered by the NCCPA) and obtain a state license in order to practice. To maintain national certification, PAs must log 100 hours of CME every two years and pass a recertifying exam every 10 years. In this survey, two out of three respondents were female (Figure 1), in line with the trend of the profession for the past 20 years or more. Close to nine in 10 PAs were white (Figure 2) and less than one in 10 was Hispanic. About two in three PAs were under 40 years of age (Figure 3). Reflecting the recent growth in the number of PA programs and new graduates, nearly half (47.3%) of all respondents have between two and nine years’ experience as a PA (Figure 4). Finally, three specialties accounted for almost 40% of the PAs in this survey: family medicine (18.0%), orthopaedic surgery (10.9%) and emergency medicine (10.5%) (Figure 5). These numbers have changed only slightly from those reported in the 2015 AAPA Salary Report,1 and are also comparable to the workforce data reported by the NCCPA on all certified PAs.2Who Ar e P A s?
PAs are state-licensed and nationally certified healthcare providers, educated in the medical model to practice medicine on healthcare teams. The profession has seen explosive growth in recent years and 65% of the profession is under 40 years old. The majority of PAs are white (87.2%), female (69.4%), and work in urban settings (81.3%). 1. American Academy of PAs. 2015 AAPA Salary Report: National Findings. AAPA: Alexandria, VA. /BUJPOBM$PNNJTTJPOPO$FSUJkDBUJPOPG1IZTJDJBO"TTJTUBOUTTUBUJTUJDBMQSPkMFPGDFSUJkFEQIZTJDJBOBTTJTUBOUT"OBOOVBMSFQPSUPGUIF/BUJPOBM $PNNJTTJPOPOUIF$FSUJkDBUJPOPG1IZTJDJBO"TTJTUBOUTIUUQXXXODDQBOFU6QMPBETEPDT4UBUJTUJDBM1SPkMFPG$FSUJkFE1IZTJDJBO"TTJTUBOUTQEG 1VCMJTIFE.BSDI"DDFTTFE+VOFSALARY REPORT As. All rights reserved. Not for distribution or reproduction.7
Dis tribution o f P A s b y Gender Dis tribution o f P A s b y R a c e
Female 69.4%
Male 30.6% 0%5%10%15%20%
Two or more races
Native Hawaiian and other Pacific Islander
Asian
American Indian and Alaskan Native
or African American
White 2.6% 0.4% 5.1% 0.3% 4.5%
87.2% Percent of Respondents 2016AAPA SALARY REPORT © 2016 American Academy of PAs. All rights reserved. Not for distribution or reproduction.8
Figur e 3 . Dis tribution o f P A s b y Ag e
0%5%10%15%20%25%30% 65 or older60 to 6455 to 5950 to 5445 to 4940 to 4435 to 3930 to 34Under 30Percent of Respondents
Age of Respondents
27.5% 23.2% 14.3% 10.1% 7.4% 5.8%5.4% 4.2% 2.2%
SALARY REPORT As. All rights reserved. Not for distribution or reproduction.9
. Dis tribution o f P A s b y Y e ar s o f Clinic al E xperienc e Dis tribution o f P A s b y Mo s t F requently P ractic ed Specialty
0%5%10%15%20%25%30%
0 to 1 year Percent of Respondents
14.9%
10.9% 22.3% 25.7% 11.3% 14.8% 0%5%10%15%20%
Hospital medicine
Dermatology
Urgent care
Emergency medicine
Surgery: Orthopaedics
Family medicine Percent of Respondents
18.0% 10.9% 10.5% 5.6% 4.5% 3.5% 3.4% 2.8% 2016AAPA SALARY REPORT © 2016 American Academy of PAs. All rights reserved. Not for distribution or reproduction.10
P A s W ork E v er ywher e
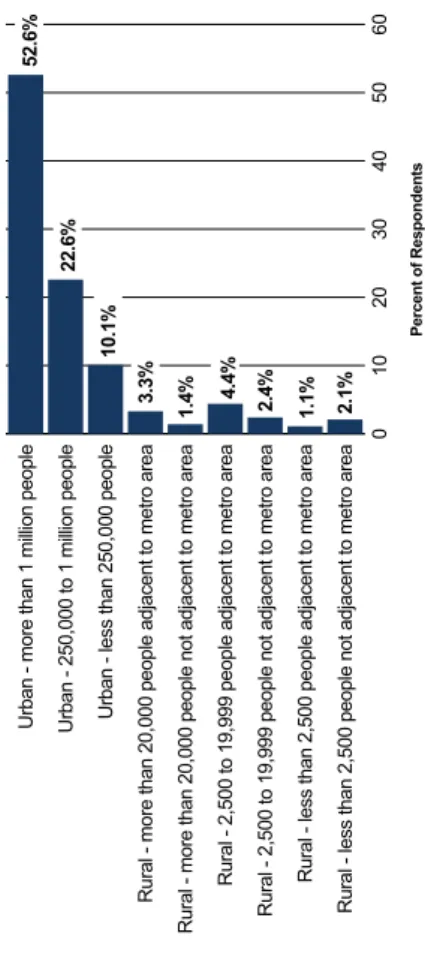
PAs practice throughout the United States and its territories. Alaska, with 71.2 PAs per 100,000 people, South Dakota (60.8), Pennsylvania (55.8), Maine (55.3), and New York (54.8) head the list of states in terms of PAs per capita. With respect to absolute numbers of PAs, New York (10,843), California (8,605), Texas (7,335) Pennsylvania (7,143) and Florida (6,765) top the charts. The states with the lowest numbers of PAs per 100,000 are Mississippi (5.7), Arkansas (11.0), Alabama (13.9), Missouri (15.6) and Indiana (17.7). Mississippi is also on the list of the lowest absolute number of PAs, with 172; this list also includes the District of Columbia (232), Wyoming (233), Hawaii (290) and Delaware (299).3 Figure 6 shows the per capita distribution of PAs by state and the District of Columbia. PAs are located predominantly in urban areas. More than half of all respondents (52.6%) to the survey were located in an urban area with more than 1 million people, while 85.3% of all PAs were in an urban area of any size (Figure 7), down 2.7 percentagepoints from 2014. With the aging U.S. population, especially in rural communities, the aging physician workforce and shortage of primary care physicians,4 as well as the increased demand for primary care services following the passage of the Affordable Care Act, more PAs will be needed in every state—and laws and regulations will need to permit them to practice at the top of their experience and education. /BUJPOBM$PNNJTTJPOPO$FSUJkDBUJPOPG1IZTJDJBO"TTJTUBOUTTUBUJTUJDBMQSPkMFPGDFSUJkFEQIZTJDJBOBTTJTUBOUT"OBOOVBMSFQPSUPGUIF/BUJPOBM $PNNJTTJPOPOUIF$FSUJkDBUJPOPG1IZTJDJBO"TTJTUBOUTIUUQXXXODDQBOFU6QMPBETEPDT4UBUJTUJDBM1SPkMFPG$FSUJkFE1IZTJDJBO"TTJTUBOUTQEG 1VCMJTIFE.BSDI"DDFTTFE+VOF5IFQFSDBQJUBJOGPSNBUJPOJOUIFkSTUQBSBHSBQIJTGSPNUIF/$$1"SFQPSUSFDBMDVMBUFEBOEDPOkSNFE CZ""1" "TTPDJBUJPOPG"NFSJDBO.FEJDBM$PMMFHFT5IFDPNQMFYJUJFTPGQIZTJDJBOTVQQMZBOEEFNBOE1SPKFDUJPOTGSPNUPIUUQTXXXBBNDPSH EPXOMPBEEBUBJITSFQPSUEPXOMPBEQEG DN@NND"".$@4DJFOUJkD"GGBJST@1%'@JITSFQPSU1VCMJTIFE.BSDI"DDFTTFE+VOF
P A s b y State
PAs practice in every U.S. state and territory. While New York has the greatest number of PAs (10,843), Alaska has the highest number of PAs per capita (68.8 per 100,000 population).3 PAs are most abundant in urban areas of more than 1 million people. In 2015, 14.6 % of PAs reported working in a rural area.SALARY REPORT As. All rights reserved. Not for distribution or reproduction.11
. Dis tribution o f P A s per Capita b y State
Numbers in states refer to number of PAs per 100,000 population 0–24.950+45–49.940–44.935–39.930–34.925–29.9AL 13.9MS 5.7 GA 31.7 SC 27.6 NC 52.1 VA 33.5
WV 51.4 PA 55.8
ME 55.3 NY 54.8 OH 24.6IN 17.7
MI 45.0 IL 23.0
IA 32.8 MN 39.7
ND 40.2 SD 60.8 NE 52.3 KS 36.1 OK 34.2 TX 26.7 AK 71.2 HI 20.3
NM 34.0 CO 52.3
WY 39.8
MT 53.1 ID 51.7 NV 24.7UT 39.0 AZ 34.8
WI 39.8 MO 15.6KY 27.8 TN 26.4AR 11.0 LA 21.6
DE 31.6 MD 44.3
DC 34.5 NJ 27.4 RI 29.8 CT 53.4 MA 39.9
VT 53.5
NH 49.1 FL 33.4 PNNJTTJPOPO$FSUJkDBUJPOPG1IZTJDJBO"TTJTUBOUTTUBUJTUJDBMQSPkMFPGDFSUJkFEQIZTJDJBOBTTJTUBOUT"OBOOVBMSFQPSUPGUIF JPOPOUIF$FSUJkDBUJPOPG1IZTJDJBO"TTJTUBOUTXXXODDQBOFUSFTFBSDI"DDFTTFE4FQUFNCFS 2016AAPA SALARY REPORT © 2016 American Academy of PAs. All rights reserved. Not for distribution or reproduction.12
0102030405060
Rural - less than 2,500 people not adjacent to metro area
Rural - less than 2,500 people adjacent to metro area
Rural - 2,500 to 19,999 people not adjacent to metro area
Rural - 2,500 to 19,999 people adjacent to metro area
Rural - more than 20,000 people not adjacent to metro area
Rural - more than 20,000 people adjacent to metro area
Urban - less than 250,000 people
Urban - 250,000 to 1 million people
Urban - more than 1 million people 90%
Percent of Respondents
Urban-Rural Area Status
52.6% 22.6% 10.1% 3.3% 1.4% 4.4% 2.4% 1.1% 2.1%
Figur e 7 . Dis tribution o f P A s b y Urb an-R ur al Ar e a Status
SALARY REPORT As. All rights reserved. Not for distribution or reproduction.13
ompens ation s b y Multiple s ation
f full-time clinical PAs were paid an eceived an hourly wage, with ay based on productivity (Figure 8). alary was $97,000, while the age was $55.00. Compensation aphic region, with PAs practicing in the ed States receiving the highest median 02,000) and PAs in the Midwest the see Figure 9). The amount of PA o varied by work setting, employer y (see figures 10, 11, and 12).Highlights o f the 2 015 S alar y R eport: National Finding s
In 2015, the median annual salary for PAs working full-time in the United States was $97,000 and 78.3% of PAs were paid an annual salary. PAs who reported receiving an hourly wage rather than an annual salary reported earning a median of $55.00 per hour. PAs working in emergency medicine, urgent care and convenient care, as independent contractors or for medical staffing agencies, were more likely to receive an hourly wage versus a salary. In addition to their base salary or hourly wage, 48.7% of full-time clinically practicing PAs received a bonus; half of these respondents reported a bonus of $5,000 or more.. Dis tribution o f P A s b y Mode o f C ompens ation Figur e 9 . Median Bas e S alar y F rom P rimar y Clinic al E mplo y e r b y R egion
Salary 79.8%Productivity 3.7% Salary 78.3% 90,00092,00094,00096,00098,000100,000102,000$104,000 $97,000$97,500 $95,000$96,000
$102,000 Region of U.S.
Median Base Salary
West
South
Midwest
Northeast
National median 2016AAPA SALARY REPORT © 2016 American Academy of PAs. All rights reserved. Not for distribution or reproduction.14
Figur e 1 0 . Median Bas e S alar y F rom P rimar y Clinic al E mplo y er b y P rimar y W ork S etting
$020,00040,00060,00080,000100,000120,000School/college/university
Correctional facility
Extended care facility/nursing home
Physician office/clinic
Other freestanding outpatient facility
Ambulatory surgical center
Rehabilitation facility
National median
Hospital: Inpatient unit (not ICU/CCU)
Other
Hospital: Outpatient unit
Hospital: Emergency department
Urgent care center
Hospital: Operating room
Hospital: Other unit not specified
Hospital: Intensive care/critical care unit
Industrial facility/work site
Hospital: Critical access Median Base Salary
Primary Work Setting
$120,000 $114,003 $108,000 $107,000 $105,000 $100,000 $100,000 $99,000 $99,000 $98,893 $97,000 $97,000 $95,680 $89,000$90,381$92,096$94,000$95,000
SALARY REPORT As. All rights reserved. Not for distribution or reproduction.15
Median Bas e S alar y F rom P rimar y Clinic al E mplo y er b y E mplo y er T ype
$020,00040,00060,00080,000100,000120,000Federally Qualified Health Center
Physician practice: Solo practice
Community health clinic
College or university
Government
Other
Certified Rural Health Clinic
Research organization
National median
HMO
Medical staffing agency Median Base Salary
$117,000 $108,286 $105,000 $104,000 $100,307 $98,250 $97,000 $96,000 $95,850 $95,000 $95,000 $95,000 $90,000$90,000$91,250$92,000$94,000 2016AAPA SALARY REPORT © 2016 American Academy of PAs. All rights reserved. Not for distribution or reproduction.16
Figur e 12. Median Bas e S alar y F rom P rimar y Clinic al E mplo y er b y Major Specialty Ar e a
In terms of work setting, the top median compensation was reported by PAs at critical access hospitals ($120,000), industrial facilities ($114,003) and hospital intensive care/critical care units (108,000) (see Figure 10). The lowest was reported by PAs working at school/college/university health centers ($89,000), correctional facilities ($90,381) and extended care facilities or nursing homes ($92,096). The type of employer was also related to the amount of compensation a PA received. PAs who worked for a physician solo practice ($90,000) or Federally Qualified Health Center ($90,000) reported the lowest median compensation levels. Conversely, PAs who are independent contractors or self-employed or who work for a medical staffing agency reported earning the highest base salaries ($117,000 and $108, 286 respectively) (see Figure 11). PAs in surgical specialties are some of the highest paid PAs, in terms of median base salary (Figure 12). Five of the top 10 highest paid specialties are surgical specialties; rounding out the top 10 are interventional radiology, internal medicine: critical care, internal medicine: infectious disease, emergency medicine, and internal medicine: other (see Table 10).$90,00091,40092,80094,20095,60097,00098,40099,800101,200102,600104,000
Surgical subspecialties
Emergency medicine
Pediatric subspecialties
All other specialties
National median Median Base Salary
Major Specialty Area
$90,000 $96,000 $97,000 $97,000 $97,600 $101,250 $102,000
Internal medicine subspecialties
Primary care
SALARY REPORT As. All rights reserved. Not for distribution or reproduction.17
e s in P A C ompens ation
ofessions have seen stagnant or falling ast decade, the PA profession has see steady growth in compensation es in compensation for ombined and inflation (as measured e index). The median PA salary ate much faster than inflation, AAPA data from 2000 to 2015. Overall, e buying power today than they did e 13 shows the increase in median , relative to the increase in the e index over the same period. The totalinflation rate from 2000 to 2015 was 37.6%. PA salaries increased by 55.2% over the same time period. And demand for PAs is projected to continue to increase for the foreseeable future. The BLS projects a 30% increase in PA jobs between 2014 and 2024, far outpacing the average projected growth rate for all professions over that time period. Over the past 50 years, the PA profession has grown and thrived, and PAs are poised to be a critical part of the solution to projected health workforce shortages.5 OTUPUIFMBCPSGPSDFJTHSPXJOHCVUTMPXMZ.POUIMZ-BCPS3FWJFX#VSFBVPG-BCPS4UBUJTUJDT64%FQBSUNFOUPG-BCPS CMTHPWPQVCNMSBSUJDMFMBCPSGPSDFQSPKFDUJPOTUPIUN%FDFNCFS"DDFTTFE+VOF
. P A S alar y T rends O v er Time
Median PA salaryMedian PA salary adjusted to 2000 dollars 2000200520102015 Year$62,500$62,500
$72,500
$87,500
$97,000 $70,884
$79,143
$86,025 2016AAPA SALARY REPORT © 2016 American Academy of PAs. All rights reserved. Not for distribution or reproduction.18
P A Car eer Fle xibility
PAs are educated and certified as generalists. This generalist orientation allows PAs to change specialties, often more than once, over the course of their careers. The clinical flexibility of PAs allows them to move quickly to where the demand is in the healthcare system, helps employers meet temporary needs, and provides individual PAs with variety and enhanced career satisfaction. AAPA examined changes in PA career status during 2015, for specialty, but also for a number of other work characteristics, including role (e.g., from clinician to educator), work setting and employer. About a sixth (16.2%) of PAs made a change in one or more of these areas in 2015. The most common change was of employer; 11% of PAs found a new employer during 2015, while roughly 5% of PAs switched their role, setting or specialty. The movement of PAs among specialties is not overwhelmingly from primary care specialties to non- primary care specialties, as is sometimes assumed. Nearly three-quarters (73.4%) of all PAs who changed specialty in 2015 moved either from a non-primary care specialty to another non-primary care specialty, or from one primary care specialty to another primary care specialty. The percentage of specialty-changing PAs who who moved from a primary care specialty to a non-primary care specialty was 15.7%, which was indeed higher than PAs moving the other direction. It is notable, however, that nearly 11% of specialty- changers actually moved from a non-primary care specialty into primary care (see Figure 14).P A s E njo y Clinic al Fle xibility
The PA profession is flexible in ways many healthcare professions are not, allowing PAs to change specialties and work settings relatively easily throughout their careers. Different specialties and settings enjoy different benefits and compensation patterns, however, and it is important to understand these and make an informed decision before making a career change.Figur e 1 4 . P A Mo v ement W ithin and B e tw een Specialty T ype s in 2 015
Note: The data reflect all PAs who responded to the 2016 AAPA Salary Survey and indicated the specifics of their career change.NON-PRIMARY CARE SPECIALTYPRIMARY CARE SPECIALTY 67.5% 5.9%10.8%
15.7%
SALARY REPORT As. All rights reserved. Not for distribution or reproduction.19
elationship B e tw een S alar y or P A s
e in salary between men and women A profession, as in many sions. We found that in 2015 total ase salary and bonus) for men and ed significantly, even after controlling for actors that might be expected to affect including years of experience as a PA, s worked, specialty, postgraduate training, egion, hours taking call and whether or as received. ase salary of full-time clinically emale PAs differed by $11,000 ered by 7,000; women: $5,000). Women s likely than men to receive a bonus at all omen versus 52.3% for men). And these s were present regardless of experience 6) and specialty (see Figure 17); there e level or major specialty area in the omen had a higher median alary disparity beginning in the actice, this difference becomes ver time as PAs’ future employers w salary in part on their previous one. arity that begins on a PA’s first day on ve lifelong implications for the PA’s vel. sible contributing factor to the PA gender y may be that women tend to negotiate contracts less aggressively than men.6, 7 We hope that armed with the information in this report, female PAs may be able to negotiate more equal salaries and begin to redress this imbalance. With this in mind, female PAs should do all they can to negotiate the highest possible starting salary.Gender -Bas ed S alar y Dis cr ep ancie s
Female PAs are paid less than male PAs. Even after controlling for compensation-relevant factors such as years of experience, hours worked per week, specialty, geographic region and whether or not a PA receives a bonus, there is an unexplained difference between male and female PAs’ salaries. In 2015, the median base salary for female PAs was $11,000 lower than male PAs, and median bonus was $2,000 lower. In the PA profession, accurate compensation information and an openness to negotiate are important first steps in reducing compensation disparities. For PA employers, a commitment not to discriminate by gender when determining salaries, transparency in compensation and less reliance on past salaries may begin to address the disparities. TU+"%PXPNFOBWPJETBMBSZOFHPUJBUJPOT &WJEFODFGSPNBMBSHFTDBMFOBUVSBMkFMEFYQFSJNFOU/#&3XPSLJOHQBQFS OCFSPSHQBQFSTX .PSSJT.8/FHPUJBUJOHHFOEFSSPMFT(FOEFSEJGGFSFODFTJOBTTFSUJWFOFHPUJBUJOHBSFNFEJBUFECZXPNFOTGFBSPGCBDLMBTIBOE PUJBUJOHPOCFIBMGPGPUIFST+1FSTPOBMJUZ4PDJBM1TZDIPM 2016AAPA SALARY REPORT © 2016 American Academy of PAs. All rights reserved. Not for distribution or reproduction.20Figur e 15 . Median Bas e S alar y F rom P rimar y Clinic al E mplo y er b y Gender Figur e 1 6 . Median Bas e S alar y F rom P rimar y Clinic al E mplo y er b y Gender and E xperienc e
Female All PAs Male
Median Base Salary
50,000
60,000
70,000
80,000
90,000
100,000
110,000
$120,000 $97,000 $94,000
$105,000
Median Base Salary
0 to 1 year2 to 4 years5 to 9 years10 to 14 years15 to 19 years20 or more years Years of Experience
$85,547
$90,000
$99,992
$104,201
$107,000
$110,000
$90,000
$93,000
$106,000
$114,500
$115,000
$114,000
70,000
75,000
80,000
85,000
95,000
105,000
115,000 90,000100,000110,000
$120,000
Female All PAs Male
$85,000
$90,000
$96,500
$101,889
$100,000
$104,949