D-4, D-5 Meso Analysis
(JMA)
Lambert map 5km (Japan region
only)
50 z*
hybrid-
levels Every 3 hour NuSDaS --- GSM 1-Week
EPS RSMC Tokyo region
(JMA)
1.25 x 1.25
deg. 12 p-levels
Initial:
12UTC valid: every
6hour
NuSDaS 51
GSM 1-Week EPS Global Troposphere
(JMA)
1.25 x 1.25
deg. 11 p-levels
Initial:
12UTC valid: every
12hour
NuSDaS 51 D-4
GSM Forecast (JMA)
0.5 x 0.5 deg.
(1.25 x 1.25 before 2007- deg.
11-21)
18 p-levels
Initial: every 6 hour valid: every
6 hour
GRIB2 (GRIB1 for
1.25deg.) --- D-1, D-2,
D-3, D-4
MSM Forecast (JMA)
0.1 x 0.125 (Japan region deg.
only)
17 p-levels
Initial: every 3 hour valid: every
3hour
GRIB2 ---
GSM forecast (JMA) (only for WMO
Region II)
0.5 x 0.5 deg. 22 p-levels
Initial: every 6 hour valid: every
3hour
GRIB2 ---
GFS Forecast
(NCEP) 1.0 x 1.0 deg.
0.5 x 0.5 deg. 27 p-levels
Initial: every 6 hour valid: every
3 hour
GRIB1 GRIB2 for
0.5 deg. --- C-1, C-2
C-8 GFS (Final)
Analysis (NCEP)
1.0 x 1.0 deg.
0.5 x 0.5 deg. 27 p-levels Every 6 hours
GRIB1 GRIB2 for
0.5 deg. --- C-7
NHM outputs
(JMA) any any any NuSDaS ---
Exponential growth of computer power allows us to perform high resolution forecasts and increase the number of ensemble members (Yoden et al. 2008). Southeast Asia region is threatened by meteorological disasters such as flood, strong wind, storm surge, and torrential rain caused by tropical cyclones and other tropical disturbances. Accurate prediction in weather would help risk management. Ensemble forecasting helps to generate a representative sample of the possible future status.
Raw output of ensemble NWPs is not suitable for dissemination to public because the size of information is much larger than that of deterministic NWPs. This requires data conversion to the user-friendly form before dissemination. The actual form depends on each user of the information.
Decision support system is a system that conveys information from the NWP sector to decision makers in social, political, and economical sectors in an appropriate way. Especially, commercial decisions are often made, not on the basis of events which are likely to occur, but on the basis of events which are unlikely to occur, but which, if they did occur, would involve serious financial loss (Palmar 2002). This fact requires us to provide reliable probabilistic forecasts. We have to consider not only the development of ensemble prediction systems, but also the development of decision support systems to utilize the output from ensemble NWPs.
For this purpose, we started to develop an experimental decision support system. We have developed tools to store ensemble NWP data on a database and handle probabilistic information obtained from ensemble NWP data, depending on purposes. This report briefly introduces the system, based on Otsuka and Yoden (2010).
1
S. Otsuka and S. Yoden
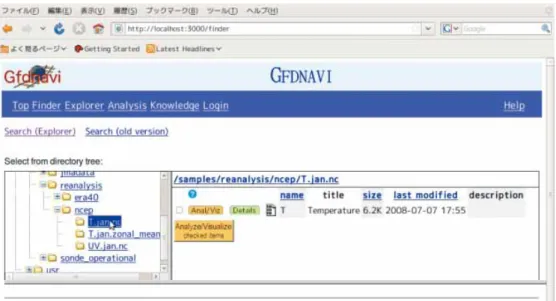
Fig. F-1-1.
Data finder on Gfdnavi. Left panel shows data tree. Right panel shows items in the selected
folder. After Otsuka and Yoden (2010).
F-1-2. Test data
Cyclone Nargis attacked Myanmar in May 2008. More than 13,800 people were killed and economical loss was reported more than 10 billion dollars. This is the worst natural disaster in Myanmar’s recorded history (Webster 2008; Fritz et al. 2009). This meteorological disaster is used as an example of analyses to make a tutorial document, in which analyses of ensemble NWP data are demonstrated to obtain information which is useful for prevention and mitigation of meteorological disasters when disasters are likely to occur.
Output from the experimental ensemble NWP on cyclone Nargis is used as the test data of the decision support system. The atmospheric model is Japan Meteorological Agency Non-Hydrostatic Model (JMA-NHM, Saito et al. 2007). The period of the experiment is from 30 April 2008 12 UTC to 3 May 12 UTC. The horizontal resolution is 10 km. The initial and boundary conditions for the control run of NHM are taken from JMA's high resolution global analysis and forecast, and the initial and boundary perturbations are produced from JMA's one-week global ensemble prediction system. The Princeton Ocean Model (POM, Blumberg and Mellor 1987) is used for the simulation of the storm surge. The input to POM is the output from NHM (wind at 10 m and sea level pressure). The horizontal resolution in POM is 3.5 km. See details in sections D-1 and D-3.
F-1-3. Experimental development of decision support system a. Unified database and visualization server
We use Gfdnavi (Horinouchi et al. 2010; Nishizawa et al. 2010) for the experimental development of a decision support system. Gfdnavi works as a database server and enables us to distribute and share geophysical fluid data on a computer network. It is also useful for personal use because it has analysis tools and visualization tools which work on web browsers. Gfdnavi is distributed at http://www.gfd-dennou.org/arch/davis/gfdnavi/index.en.htm. Gfdnavi has basic analysis functions such as mean and standard deviation and visualization tools such as contour plot and line plot so that we can analyze NWP data.
Data for analyses is selected via the tree view as shown in Fig. F-1-1. If a dataset is selected in the left panel, available variables are shown in the right panel. When variables are selected, the analysis/visualization window will appear.
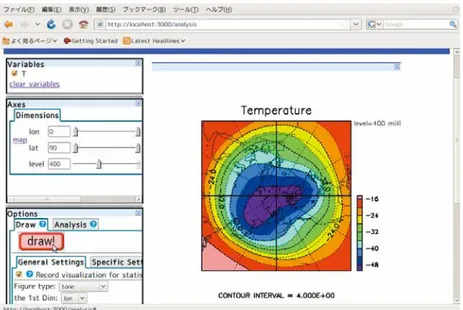
Fig. F-1-2.
Visualization window on Gfdnavi. Control panels are located in the left column. Right panel
shows the results. After Otsuka and Yoden (2010).
(1) 1D-diagrams of ensemble data
A plume diagram consists of superimposed 1D line plots. Typically, time series of a quantity is superimposed for all the ensemble members. At the initial time, the differences among the ensemble members are small. As time evolves, the difference becomes large (the reliability of the forecast becomes low), which makes the superimposed line plots spread away with each other. This looks like a plume rising from a chimney. The plume diagram is often used to display 1D time series of ensemble NWP data.
Box plot or box-and-whisker plot is introduced by Tukey (1977). This plot shows five quantities:
the minimum, the lower quartile, the median, the upper quartile, and the maximum. There are many variations.
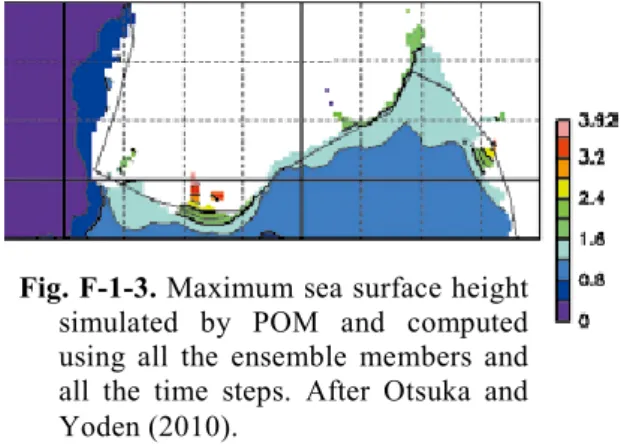
In this section, analyses with the decision support system are demonstrated using sea surface height simulated by POM. Figure F-1-3 shows the horizontal distribution of the maximum sea surface height for all the time steps and all the ensemble members. The largest sea surface height is obtained at the mouth of the Irrawaddy River (Ayeyarwady River). Next, the time evolution of sea surface height at the mouth of the Irrawaddy River (95.07E, 16.1N), where the maximum sea surface height is obtained, will be shown.
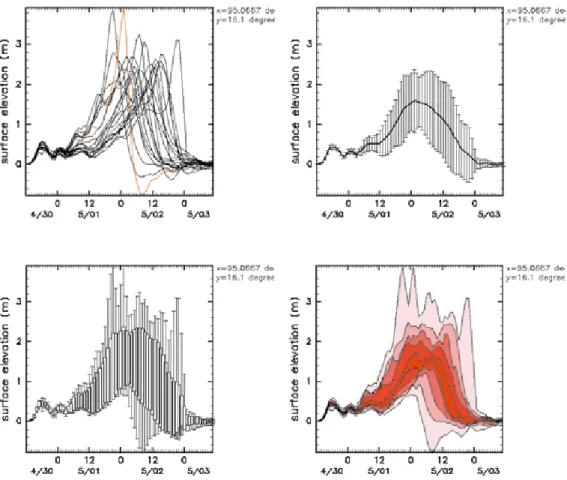
The top-left panel of Fig. F-1-4 is the plume diagram of the sea surface height at the mouth of the Irrawaddy River. The ensemble member that shows the largest sea surface height is highlighted with the red color. The value and timing of the maximum sea surface height vary much from member to member. The top-right panel of Fig. F-1-4 shows the ensemble mean and spread (standard deviation) of the same data. The spread becomes larger when the sea surface height becomes higher. The bottom-left panel of Fig. F-1-4 shows a box plot for the same data, in which the maximum, the minimum, and the standard deviation are shown. With this plot, it is possible to see the distribution of extreme values (outliers), which are not shown in the spread. The bottom-right panel of Fig. F-1-4 shows the percentiles of the distribution of the same data. For example, most of the members show the sea surface height of about 1 m at around 2 May 00UTC, whereas some members show the sea surface height of nearly 4 m. After 2 May 00UTC, on the other hand, ensemble members show a variety of sea surface heights. As seen above, we can extract many kinds of information from 1D diagrams of the same ensemble NWP data by using different plotting methods.
Fig. F-1-3.
Maximum sea surface height
simulated by POM and computed
using all the ensemble members and
all the time steps. After Otsuka and
Yoden (2010).
(2) 2D-diagrams of ensemble data
Three kinds of 2D plots for ensemble NWP data are implemented: ensemble mean and spread, so-called spaghetti plot, and distributions of probability exceeding a threshold value. The spaghetti plot shows the same isopleth lines for all the ensemble members in a single plot. Higher density of the contour lines means higher reliability of the forecast, and the lower density of the lines, which look like spaghetti on a plate, means lower reliability. For example, a spaghetti plot of the geopotential height at 500 hPa with isopleth lines of 5,640 m is shown as the cover illustration of Kalnay (2003).
In this section, analyses with the system are demonstrated using the sea level pressure simulated by NHM. Figure F-1-5 shows a
spaghetti plot of the sea level pressure with the contour lines of 1000 hPa at the initial time, 24 hours, and 48 hours. As time evolves, the low pressure region, which corresponds to cyclone Nargis,
Fig. F-1-4.
Sea surface height at the mouth of the Irrawaddy River (95.07E, 16.1N). Top left: plume diagram. Top right: mean and spread. Bottom left: box plot. Bottom right: percentile. After Otsuka and Yoden (2010).
Fig. F-1-5.
Spaghetti diagram of sea level pressure of NHM. Each contour shows 1000 hPa in each ensemble member. Red:
initial time. Green:
t=24 h. Blue: t=48 h.After Otsuka and Yoden (2010).
F-1-3-3. User’s guide of the decision support system
We created an interactive tutorial document on how to analyze ensemble NWP data by using the experimental version of the decision support system to obtain information which is necessary for prevention and mitigation of meteorological disasters (see I-2).
The user’s guide consists of systematic explanations of drawing methods on the system. As generic draw methods, there are explanations for 1D plots (line, marker, and bar), 2D plots (contour, tone, and vector arrow), and statistical plots (scatter and histogram). Especially, how to extract information by slicing data along each axis is demonstrated for five-dimensional ensemble NWP data as a function of latitude, longitude, height, time, and ensemble member.
As draw methods which are specific to ensemble NWP data, 1D diagrams such as plume diagram and 2D diagrams such as the spaghetti plot are described. As analyses with simple mathematical operations, how to compute the ensemble mean and spread is explained.
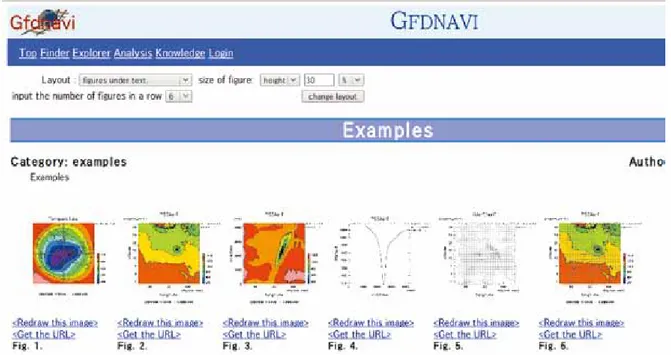
These sample diagrams shown in the tutorial document are also provided in an interactive document on the decision support system, using the knowledge documenting system of Gfdnavi (Fig. F-1-6). This enables us to modify parameters of the diagrams and redraw them. This also enables us to save the diagrams on the database and write documents on the diagrams. By using this tool, it is possible to archive and share knowledge which are needed to analyze and interpret NWP data. By archiving many case studies, the system will provide useful information and tools for specialists of ensemble NWP data, and the system will also serve as a tool for education.
F-1-4. Summary
We have developed an experimental decision support system for prevention and mitigation of meteorological disasters, using a unified database and visualization tool Gfdnavi. The system
Fig. F-1-6.