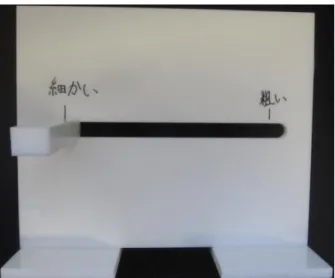
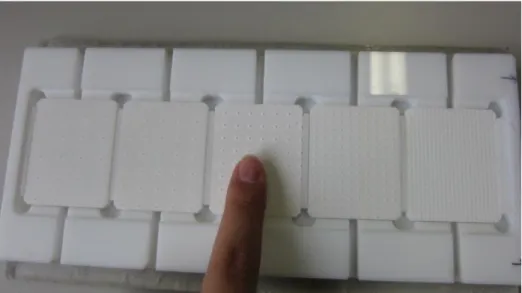
Behavioral and fMRI Studies on Visuotactile Roughness Perception
2017, September
Mohd Usairy Syafiq bin Samain
Graduate School of
Natural Science and Technology (Doctor’s Course)
OKAYAMA UNIVERSITY
Behavioral and fMRI Studies on Visuotactile Roughness Perception
視触覚による粗さ知覚に関する 行動学および fMRI 研究
Mohd Usairy Syafiq bin Samain
モハマド ウサイリー シャフィック ビン サマイン
Graduate School of
Natural Science and Technology (Doctor’s Course)
OKAYAMA UNIVERSITY
Contents
Chapter 1 Introduction ... 1
Chapter 2 Human Characteristics of Tactile-Visual Cross-modal on Roughness Perception ... 5
Abstract ... 5
2.1 Introduction... 6
2.2 Experimental stimuli ... 7
2.2.1 Tactile stimuli ... 8
2.2.2 Visual stimuli ... 9
2.2.3 Visual indication stimuli ... 10
2.3 Experimental setup and device ... 11
2.3.1 Setup ... 11
2.3.2 Tactile presentation device ... 12
2.4 Materials and method ... 14
2.4.1 Subjects ... 14
2.4.2 Apparatus and stimuli ... 14
2.4.3 Procedures ... 17
2.4.4 Data processing and analysis ... 20
2.5 Results ... 21
2.5.1 Reaction time... 21
2.5.2 Proportion of “rougher” response... 23
2.6 Discussion ... 30
2.6.1 Tactile dominant roughness perception of fine surface ... 30
2.6.2 Influence of interference stimulus in each other modality during cross modalities ... 31
2.6.3 “Smooth” and “rough” in fine textures ... 32
2.7 Conclusion ... 34
Chapter 3 Neural mechanisms of Roughness Perception by Tactile Visual Cross-modal dot pattern... 35
Abstract ... 35
3.1 Introduction... 36
3.2 Experimental stimuli ... 37
3.2.1 Tactile stimuli ... 37
3.2.2 Visual stimuli ... 38
3.2.3 Visual indication stimuli ... 39
3.3 Experimental setup ... 40
3.3.1 Pre experiment... 41
3.3.2 Functional MRI experiment ... 41
3.4 Materials and method ... 43
3.4.1 Subjects ... 43
3.4.1 Apparatus and stimuli ... 44
3.4.2 Procedures ... 44
3.4.3 Data processing and analysis ... 47
3.5 Results ... 48
3.5.1 Behavioral results ... 48
3.5.2 Neural activation in specific stimuli cognition ... 51
3.5.3 Neural activation during visual and tactile input ... 61
3.5.3 Common neural activation during target stimulus cognition ... 62
3.6 Discussion ... 63
3.6.1 Effects of input by each modality ... 63
3.6.2 Cross modal integration process ... 64
3.7 Conclusion ... 66
Chapter 4 Effects of Temporal Frequency toward Roughness Perception by Visual Stimuli ... 67
Abstract ... 67
4.1 Introduction... 68
4.2 Effects of temporal frequency towards roughness perception by visual drifted grating stimuli ... 69
4.2.1 Subjects ... 69
4.2.2 Stimuli ... 69
4.2.3 Procedures ... 70
4.3 Effects of temporal frequency towards roughness perception by visual flicked scramble stimuli ... 72
4.3.1 Subjects ... 72
4.3.2 Scramble stimuli ... 73
4.3.3 Procedures ... 74
4.4 Results ... 74
4.4.1 Grating ... 74
4.4.2 Scramble stimuli ... 80
4.5 Discussion ... 84
4.5.1 Temporal roughness factor in grating and scramble ... 85
4.5.2 Irregularity of spatial factor in temporal roughness ... 85
4.6 Conclusion ... 86
Chapter 5 Summary ... 87
Publications ... 90
References ... 91
Acknowledgements ... 99
1
Chapter 1 Introduction
On the other hand, tactile recognition experiments have been carried out worldwide for years. When examining the state of human touch, due to a variety of complex tactile information input by touch, we determine by analyzing the shape and condition of the surface. When touching something in the shape of a character, we imagine and visualize the shape based on tactile information while matching its similar shape and character to the brain require an advanced network of brain.
Haptic and visual information contribute to our texture perception, lead human to recognize surface characteristics of objects by single glance or particular touch. In addition, we generally recognize object’s texture by using multisensory inputs, combining both modalities to produce final judgement into understanding the texture.
During the processes, how do those different modalities affects each other? Are they integrated or disconnect inside our brain?
Perception of textures can be divided into two; fine (spatial features smaller than 200µm) and coarse textures. Texture depends on spatial and temporal cues and is mediated by different tactile receptors in the skin. According to the duplex theory, the perception of a surface with element size lower than 100 µm is impaired in the absence of movement. In tactile texture perception, roughness is one of the most important characteristics of a textured surface and it is evident that, at least for fine surfaces, motion plays an important role in extracting roughness information from textured surfaces. Recent studies on the haptic perception of roughness have indicated that even temporal coding is involved in the haptic perception of a coarse surface (200 μm) and that encoded spatial properties are likely a key factor. Information about the roughness of a surface can be encoded not only through active exploration of that surface but also by the surface rubbing passively against one’s skin.
Plenty of psychological studies investigating tactile texture perception have been conducted using artificial stimuli such as dot surfaces, grating patterns or abrasive papers. In addition, a lot of research has been devoted to tactile rough-ness, in particular with respect to the role of vibration cues and to the neural mechanisms. Visual roughness is likely a factor that contributes to the perception of visual gloss. To date,
2
many studies investigated texture perception in separate visual and haptic paradigms and the effect of simultaneous visual and haptic exploration of textures has always been overlook. Overlap of visual and haptic texture may represent in some brain areas, but whether visual and haptic information interacts in these cortical regions is still subtle.
Behavioral studies also indicate the existence of such cross modal interaction and matching effects in visuo-haptic tasks. It was shown that people consistently and absolutely match specific tactile vibration rates (simulating manual exploration of a textured surface) to visual spatial frequencies, indicating some kind of cross modal association effect in visual and haptic texture perception.
To differentiate a surface texture, human apply both visual and haptic information for the perception. We are focusing in roughness, one of significant domain in the perception of textures. In addition, we generally recognize object’s texture by using multisensory inputs, combining both modalities to produce final judgement into understanding the texture. During the processes, how do those different modalities affects each other? Are they integrated or disconnect inside our brain? Cognition of surface roughness at the same time in the two senses (tactile and visual) is still undeclared, and how both effects on each other could be intriguing. Moreover, human sensations during roughness perception always involve in interaction, but a lot of brain’s response during the interaction is still unknown. Additionally, the perception of roughness has been studied primarily in the haptic domain. Plenty of psychological studies investigating tactile texture perception have been conducted using artificial stimuli such as dot surfaces, grating patterns or abrasive papers. In addition, a lot of research has been devoted to tactile roughness, in particular with respect to the role of vibration cues and to the neural mechanisms. Visual roughness is likely a factor that contributes to the perception of visual gloss, mainly focusing on spatial factors This raises the question on how the temporal factors affect the roughness perception. Does the spatial factors are more significance than temporal? How do we code the temporal code in visual roughness?
This thesis is divided into five chapters. In the first chapter, literature review on texture perception is explained. The main objective of the first study in the second chapter was to explore how the two modalities influence each other during roughness perception of fine surface. We designed two unimodal tasks and four bimodal tasks
3
within both modalities using six different fine surfaces and six different grayscale photos. In unimodal visual task (V-V), subjects were asked to judge rougher visual stimuli between two stimuli that were presented in sequential order. In bimodal visual task, (V-Vt), subjects needed to do the same visual roughness judgement while perceiving an interference tactile stimulus at the second order of the presented stimuli.
We expected to measure the influence of each modality by considering how subjects were interrupted by the emergence of the tactile interference stimulus. Furthermore, bimodal visual task are divided into two tasks, which applied rough tactile interference stimulus (V-Vt-rough) and smooth one (V-Vt-smooth). Unimodal and bimodal tactile task (T-T, T-Tv-rough, and T-Tv-smooth) were the opposite, which subjects need to do tactile rough-ness judgement. We propose that the roughness of the interference stimulus from different modality may affects subjects judgment and different between the two types. We found that tactile sensory was dominant in the perception of roughness by fine surface. During cross modalities, visual information has almost no effects toward tactile sensory, but in the other hand tactile information had significance effects onto visual sensory. Furthermore, we found that stimuli with smaller particles bring more interference into subject’s perception compared to bigger particles in fine surface. We suggest that particles sizes are as significant as the modalities in visual, tactile, or multisensory integration of both, in roughness perception of fine surface.
In the third chapter, we measured brain activity during pattern perception using functional magnetic resonance imaging (fMRI). Human sensations always involve in interaction, but a lot of brain’s response during the interaction is still unknown. This study was designed to discover the unresolved part of the brain during performing visual and tactile interaction roughness recognition experiments. We designed four types of tasks: visual task (VV), tactile task (TT), visual - tactile task (VT), tactile - visual task (TV). The common area of each of the brain activation during each task was analyzed; and the results showed that activations located in the frontal and parietal, suggesting these regions were actively involved in the cross-modal processing. Specific activation for the information from the tactile and visual modality was seen in the frontal and parietal lobe, respectively, suggesting the particular activation in each at this region.
4
In the fourth chapter, we designed a visual base stimulation to investigate the temporal factors of roughness perception. Visual stimulation with regularity and irregularity of spatial spacing were used in this study. In the present study, we used computer-assembled gratings and scrambles images to define time characteristics of visual roughness. The parameters of the grating including pixels per cycle, spatial frequency, and visible size were calculated and one single static grating image was generated. The actual sine grating and drift speed (in cycles per second) were then computed and the amount of pixels to be shifted is specified to perform a perception of movement. We then investigated the effects of changes in those gratings and scrambles parameters to subjects’ roughness perception. In the first experiment, we investigated the effects of temporal frequency towards roughness perception by visual drifted grating stimuli. We could understand that gratings do have several limitations for roughness perception to human visual. In the second experiment, we changed our stimulation to scramble stimulation which originated from the grating stimuli. In order to examine the results of the second experiment, we carried out a magnitude estimation experiment on each of the difference temporal frequency of scramble stimuli. The results showed a more converged results during the perception of irregular spacing in scramble stimuli, suggesting the significance of spatial coding. However, we also found the evidence of how visual temporal factors influence the perception of roughness.
5
Chapter 2 Human Characteristics of Tactile-Visual Cross-modal on Roughness Perception
Abstract
Cognition of surface roughness at the same time by the two senses (tactile and visual) is still undeclared, and how both effects on each other could be intriguing. The main factor for roughness estimation of fine surface (spatial features below 200µm) is also unknown until present. In order to see the difference between cognition of both condition, we conducted two unimodal and two bimodal tasks involving both modalities using fine sandpapers. Tactile stimuli consisted of six types of different sandpapers that varied in their roughness, while visual stimuli are images of the correspondence tactile stimuli. In unimodal task, subjects need to compare which stimulus perceived were rougher, visually and tactually, while multiple sensory of visual and tactile were mixed in bimodal task. We also varied the type of roughness in bimodal task into two categories to discover whether there is any acceleration or suppression by different stimuli. We found that tactile sensory was dominant in the perception of roughness by fine surface. During cross modalities, visual information has almost no effects toward tactile sensory, but in the other hand tactile information had significance effects onto visual sensory. Furthermore, we found that stimuli with smaller particles bring more interference into subject’s perception compared to bigger particles in fine surface. We suggest that particles sizes are as significant as the modalities in visual, tactile, or multisensory integration of both, in roughness perception of fine surface.
6
2.1 Introduction
Haptic and visual information contribute to our texture perception, lead human to recognize surface characteristics of objects by single glance or particular touch. In addition, we generally recognize object’s texture by using multisensory inputs, combining both modalities to produce final judgement into understanding the texture.
During the processes, how do those different modalities affects each other? Are they integrated or disconnect inside our brain?
Perception of textures can be divided into two; fine (spatial features smaller than 200µm) and coarse textures [1][2]. Texture depends on spatial and temporal cues and are mediated by different tactile receptors in the skin [3][4][5][6]. According to the duplex theory, the perception of a surface with element size lower than 100 µm is impaired in the absence of movement. In tactile texture perception, roughness is one of the most important characteristics of a textured surface and it is evident that, at least for fine surfaces, motion plays an important role in extracting roughness information from textured surfaces. Recent studies on the haptic perception of roughness have indicated that even temporal coding is involved in the haptic perception of a coarse surface (200 μm) and that encoded spatial properties are likely a key factor [7]. Information about the roughness of a surface can be encoded not only through active exploration of that surface but also by the surface rubbing passively against one’s skin.
Plenty of psychological studies investigating tactile texture perception have been conducted using artificial stimuli such as dot surfaces, grating patterns or abrasive papers. In addition, a lot of research has been devoted to tactile rough-ness, in particular with respect to the role of vibration cues and to the neural mechanisms. Visual roughness is likely a factor that contributes to the perception of visual gloss [8][9]. To date, many studies investigated texture perception in separate visual and haptic paradigms and the effect of simultaneous visual and haptic exploration of textures has always been overlook. Overlap of visual and haptic texture may represents in some brain areas, but whether visual and haptic information interacts in these cortical regions is still subtle. Behavioural studies also indicate the existence of such cross modal interaction and matching effects in visuo-haptic tasks. It was shown that people consistently and absolutely match specific tactile vibration rates (simulating manual
7
exploration of a textured surface) to visual spatial frequencies [10], indicating some kind of cross modal association effect in visual and haptic texture perception.
The main objective of the present chapter was to explore how the two modalities influence each other during rough-ness perception of fine surface. We designed two unimodal tasks and four bimodal tasks within both modalities using six different fine surfaces and six different grayscale photos. In unimodal visual task (V-V), subjects were asked to judge rougher visual stimuli between two stimuli that were presented in sequential order. In bimodal visual task, (V-Vt), subjects needed to do the same visual roughness judgement while perceiving an interference tactile stimulus at the second order of the presented stimuli. We expected to measure the influence of each modality by considering how subjects were interrupted by the emergence of the tactile interference stimulus. Furthermore, bimodal visual task is divided into two tasks, which applied rough tactile interference stimulus (V-Vt-rough) and smooth one (V-Vt-smooth).
Unimodal and bimodal tactile task (T-T, T-Tv-rough, T-Tv-smooth) were the opposite, which subjects need to do tactile roughness judgement. We propose that the roughness of the interference stimulus may affects subjects judgment and different between the two types. In addition, small or big particles size of fine textures may also influence the perception of roughness in both modalities. Stimulus presentation was always bimodal, but the sensory information content differed as texture information was varied either in the haptic, visual or in both channels.
As discussed in previous chapter, cross modality between visual and tactile in human have been reviewed by many. The intention of this study is to demonstrate the theorem. Cross modality effects are different according to individual and the effects activated by it are also believed to be various. In this chapter, we expect to find the characteristics of those effects related to the cross modal of tactile and visual, during the perception of roughness.
2.2 Experimental stimuli
In this study, we outlined two types of stimuli throughout the experiment;
tactile stimuli and visual stimuli. Along with these stimuli, we also arranged the
8
indication stimuli which functioned as the instructor for the subjects. The indication stimuli make sure that a smooth and continuous experiment can be performed.
2.2.1 Tactile stimuli
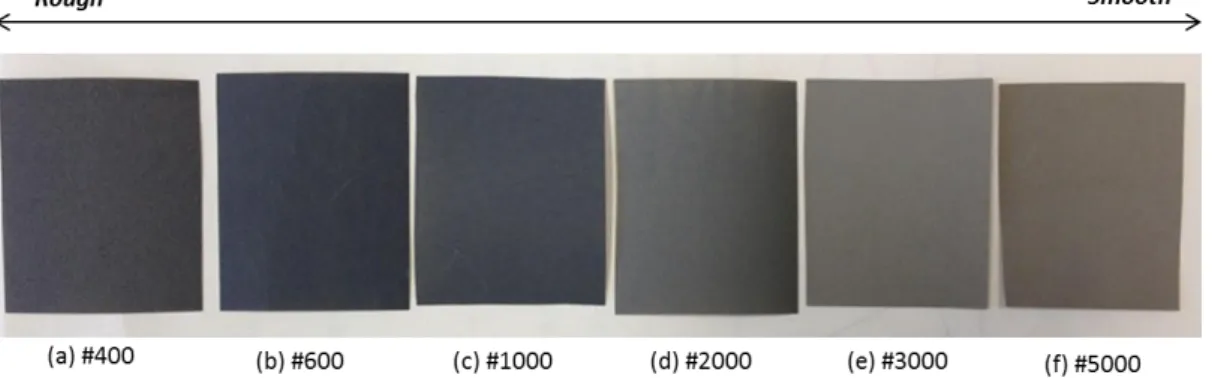
Tactile stimuli consisted of six type of different sandpaper which varied in their roughness. Deliberately, the tactile roughness is exactly the same with the correspondence visual stimuli. The number of tactile stimuli presented is written under the stimulus count of file used in each stimulus is a (#). The numbers are: #400, #600,
#1000, #2000, #3000, and #5000.
Table 1 Grades of sandpaper
Stimulus number (#) 400 600 1000 2000 3000 5000
Average particle diameter (μ m)
34 24 15.5 8.5 5.7 1.5
Index finger of the right hand of subjects contacted with the tactile stimuli. .Figure 2.1 is the samples of sandpapers that we used during examination. With 4.5cm width, 0.5mm thick, and 3.5cm of length, the six types variation are referring to the size of particles of abrading materials embedded in the sandpaper based on the Japanese Industrial Standards Committee (JIS).
Fig 2.1 Samples of tactile stimuli
9
(a) Grit number #400, the roughest sandpaper (b) Grit number #5000, the smoothest sandpaper Fig 2.2 Close up of roughest stimuli (#400) and smoothest (#5000)
2.2.2 Visual stimuli
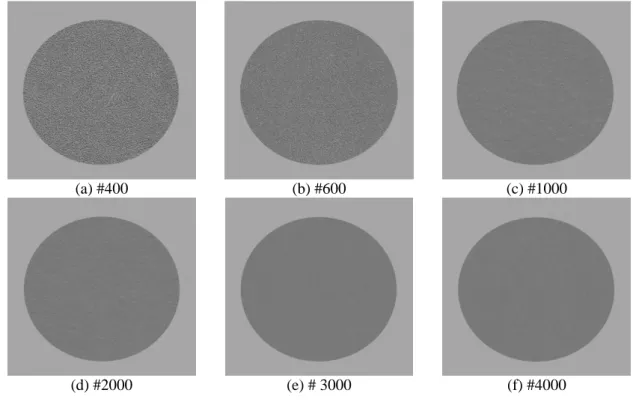
We used sandpaper with the same grade as tactile stimuli for all types of visual stimuli. Circle of those sandpapers with diameter of 22.2mm and central angle 25 ° was captured by scanner and their brightness of grey scale were fixed into one scale.
Distance of presented visual stimuli from computer’s display to subject’s face is 500mm, and the visual roughness is exactly the same with the correspondence tactile stimuli.
The circles were presented on a grey screen. The number of tactile stimuli presented in the display, is written in (#), while Reference Stimuli and Comparison Stimuli are randomized according to the task (refer 3.6)
10
(a) #400 (b) #600 (c) #1000
(d) #2000 (e) # 3000 (f) #4000
Fig 2.3 Six samples of visual stimuli
2.2.3 Visual indication stimuli
Our future plans include exploring the neural substrates when subjects perceived roughness. To maximize the smoothness of presentation of tactile and visual stimuli, we designed an automated experimental system for maximum smoothness during fMRI experiments. For this reason, we arranged the visual indication stimuli. These stimuli can be divided into three colors. The three colors indicating three different instructions.
For every task whether it is visual or tactile task, subjects will be presented two times.
The initial stimulus is the Reference Stimulus while the secondary stimulus is the Comparison Stimulus.
As shown in (Figure 2.4), visual indication stimuli are three types of plus symbol (+), presented in the center of display, with 17.5mm size at 2 ° central angle. In what is shown in Figure 2.4 (a), white plus symbol indicates the initial stimulus will be presented in a little while. Black is a sign or reminder for comparison stimulus will be presented. Lastly, red visual indication stimulus is for subjects to touch the tactile stimuli presented to their right hand. Resultantly, red indicators will only be presented
11
during presence of tactile stimuli. Figure 2.4 shown is the visual indication stimuli in an enlarged view which was used in the experiment.
(a) White indication stimulus (b) Black indication stimulus (c) Red indication stimulus Fig 2.4 Visual indication Stimuli. From left: white (before Reference Stimulus presented), black
(before Comparison Stimulus presented), and red (contact with tactile stimulation)
2.3 Experimental setup and device 2.3.1 Setup
General view is as in Figure 2.5. A display, an experimenter’s computer, the experimental device, a jaw stand, and a partition plate all involved into the environment.
Subjects needed to place their right hand on top of the cover-plate of the device, and we needed to place their jaw 50 cm from the display. The display was connected to the experimenter’s computer and outputs of visual indication stimuli and visual stimuli were displayed and controlled by the experimenter through the computer.
Fig 2.5 General view of experiment
12
The display and jaw stand were divided with experimenter’s PC and the device by a partition plate. With the mouse on the left hand as the response key, the partition plate certainly prevents any visual information from the device and PC. The right hand, get placed on top of the cover-plate of the tactile presentation device and the arm was supported by elbow stand, located at certain location which can be moved according to the subject’s hand’s length (Figure 2.6).
Fig 2.6 Experimental scene
2.3.2 Tactile presentation device
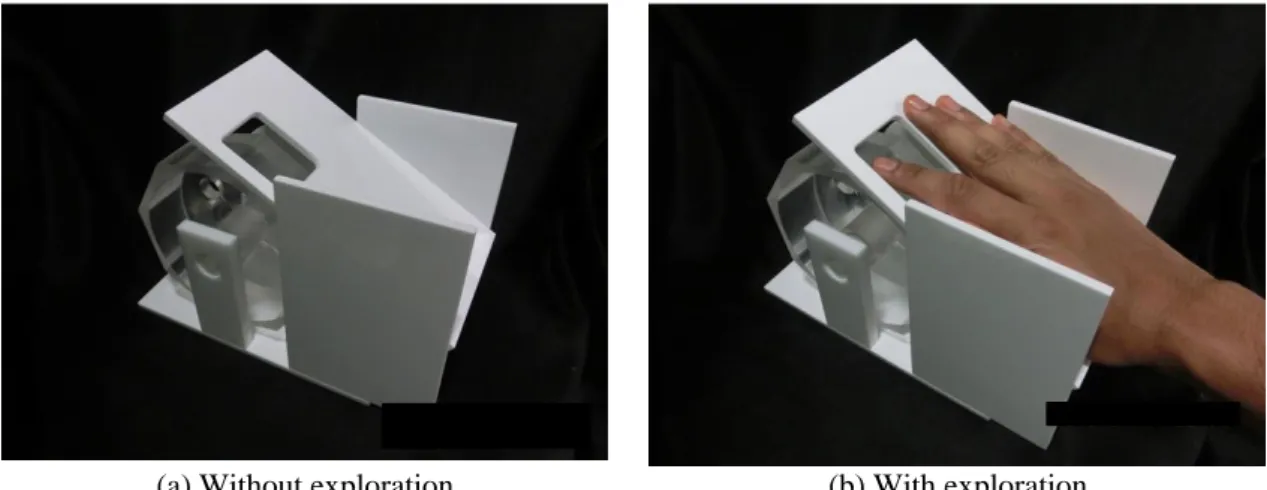
Figure 2.7 is the detailed elements of the tactile presentation device. Material of the device was all acrylic. The cover-plate allowed subjects to explore only one texture at a time and served as the resting position for the hand in between exploration trials.
Beneath the cover-plate is an octagonal prism; fixed at the center as an axis and the presence of two stands with two bearings inside executed a rotation mechanism. The presentation of tactile stimulation was fully controlled by Presentation R software (Neurobehavioral Systems, Inc., Albany, CA, USA).
The octagonal prism is being supported by two stands with height of 90 mm each. Two bearings were inserted in each stands 75mm from the bottom. The axis of the octagonal prism was inserted into both ends of bearings, making it possible for rotation
13
mechanism. One end of the axis was being connected to a gear; which is 90mm of diameters. The 90mm gears then were connected to another smaller gear (20mm diameters). The smaller gears connected to an ultrasonic motor (Canon precision Co., Ltd)
(a) Without exploration (b) With exploration
Fig 2.7 Tactile presentation device
.
Eight surfaces were there in the prism. For this research, we only used six of them. The remaining two surfaced were unused but were built considering any possibilities in future fMRI studies. The surface is exactly the same size with the tactile stimuli (sandpapers) which is 35 mm long and 45 mm width.
(a) Without tactile stimuli (b) With tactile stimuli Fig 2.8 The octagonal prism, without (left) and with tactile stimulation (Right)
14
The ultrasonic motor was used in this research as a preparation for fMRI study.
Because the MRI contains strong magnets, metal objects are not allowed into the room with the MRI scanner. That is also why we used plastics as the main material of the device. The ultra-sonic motor was connected to the controller and experimenter’s computer, and all of activity by the motor can be controlled by the experimenter, using the computer. Figure 2.9 is the top side view and lateral side view of the ultra sonic motor used.
(a) Lateral view (b) Top view
Fig 2.9 Ultrasonic motor used for the tactile presentation device
2.4 Materials and method
2.4.1 Subjects
Ten right-handed, healthy volunteers (all males, mean age of 22.2±1.8 years old) participated in this experiment. All subjects had no remarkable injuries to the hands or fingers, normal visions, and given written informed consent for participation. The local medical ethics committee of Okayama University approved the protocol.
2.4.2 Apparatus and stimuli
Tactile stimuli surfaces consisted of 0.5mm thick sandpapers with six different particle sizes, ranged from 1.5 to 34 µm (Figure 2.10). Each sandpaper was spray coated
30㎜ 45㎜
44 ㎜
(a) Top side (b) Lateral side
30㎜ 45㎜
44 ㎜
(a) Top side (b) Lateral side
30㎜ 45㎜
44 ㎜
(a) Top side (b) Lateral side
30㎜ 45㎜
44 ㎜
(a) Top side (b) Lateral side
15
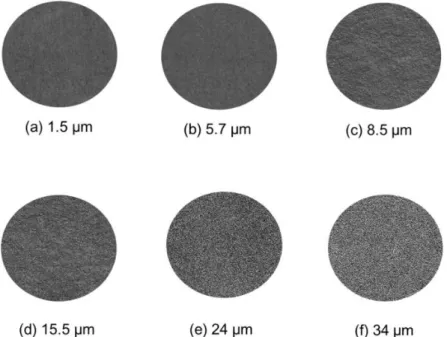
to prevent subject’s finger from abrasive. Each sandpapers were fixed to side of prima to present to the subjects with 4.5cm width and 3.5cm of length. High-resolution scanned sandpapers were used as the visual stimuli. The average luminance of visual sandpapers stimuli used in this experiment were constant and they varied only along a single texture dimension, i.e. the average particles diameters, ensuring that changes in other surface properties like color do not influence the results. The six types variation of roughness in each stimulus referred to the size of particles of abrading materials embedded in the sandpaper based on the Japanese Industrial Standards Committee (JIS).
Fig 2.10. Six types of scanned sandpapers used in all task involving visually displayed stimuli.
Numbers represented the average of particle sizes of each.
During tactile stimulus exploration, index finger of the right hand of subjects contacted with the tactile stimuli. The cover-plate allowed subjects to explore only one texture at a time and served as the resting position for the hand in be-tween exploration trials. Beneath the cover-plate is an octagonal prism; fixed at the center as an axis and the presence of two stands with two bearings inside executed a rotation mechanism. The octagonal prism was supported by two stands with height of 90 mm each. Two bearings were insert-ed in each stands 75mm from the bottom. The axis of the octagonal prism was inserted into both ends of bearings, making it possible for rotation mechanism. The
16
presentation of tactile stimulation was fully controlled by Presentation R software (Neurobehavioral Systems, Inc., Albany, CA, USA). The surface is exactly the same size with the tactile stimuli (sandpapers) which is 35mm long and 45mm width. The display was connected to the experimenter’s computer and outputs of visual indication stimuli and visual stimuli were displayed and controlled by the experimenter. The visual display and chin rest stand were divided with experimenter’s computer and the tactile texture presentation device by a partition plate. With the mouse on the left hand as the response key, the partition plate certainly prevents any visual information from the device and PC. The right hand, get placed on top of the cover-plate of the tactile presentation device and the arm was supported by elbow stand, located at certain location which can be moved according to the subject’s hand’s length (Fig 2.11)
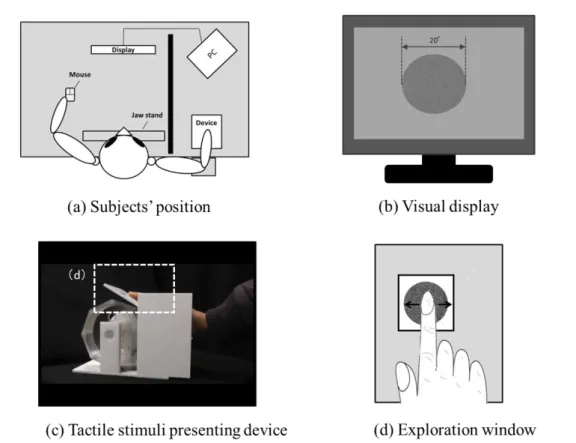
Fig 2.11 Subject’s position, visual display, and tactile device (a) Illustration from the top view of the position of subject, display, mouse, and the tactile surface presenting device. Experimenter’s
computer and the device were distracted from subject’s visual range by a partition plate. (b) Illustration of the visual display with 20 degree of angle view (c) Controlled tactile stimuli presenting device which positioned at subjects’ right hand. Subject will explore the sandpapers at the
exploration window by their index finger, such as in (d).
17 2.4.3 Procedures
Primarily, the experiment consisted of two unimodal tasks and two bimodal tasks. In unimodal task, subjects only need to perceive whether visually or tactually. Bimodal task is where subjects need to the same task as unimodal, but they were asked to perceive the interference stimulus. Bimodal task furthermore divided into two: one with rough interference stimulus (34µm) and smooth interference stimulus (1.5 µm). The all six tasks are:
1) Unimodal Tactile-only task (T-T) 2) Unimodal Visual-only task (V-V)
3) Bimodal Tactile Task with rough visual interference stimulus (T-Tv-rough) 4) Bimodal Tactile Task with smooth visual interference stimulus (T-Tv-smooth) 5) Bimodal Visual task with rough tactile interference stim-ulus (V-Vt-rough) 6) Bimodal Visual task with smooth tactile interference stimulus (V-Vt-smooth)
Subjects were presented sequentially two times in every trial; initial stimulation is called reference stimulus (RS) and the latter is comparison stimulus (CS). Subjects were instructed whether to look at the display or to explore the textures by sweeping their index finger in determined times with command by the indication stimuli.
18
Fig 2.12 Time chart for one trial in the unimodal task of tactile T-T, visual V-V. Separated by two seconds of interval, subjects were presented with the stimuli twice in each task, which are the reference stimulus (RS) and the comparison stimulus (CS). In (a) T-T task, subjects need to explore the RS when the red signal presented before they may explore the CS. Once perceived the roughness
of CS, the subjects will response by mouse click and the next trial will begin. In (b) V-V task, subjects performed the same procedures as in T-T task with the visual stimulation. In bimodal task, subjects need to do both task when perceiving CS. After the inter-stimulus interval, subjects need to
response whether perceived CS was “rougher”, “smoother”, or “same” compared to RS, as soon as possible.
In T-T task, subjects need to identify the roughness of two different (or same) tactile stimuli. First, a white visual indication stimulus was presented on the screen for 2 seconds. Next, red visual indication stimulus was presented for 4 seconds. At the same time, tactile RS was presented to subject’s right hand and subjects need to explore the stimulus with their index finger. Visual display then presented black inter-stimulus interval stimulus for 2 seconds to make sure the subjects ready for the CS. CS then presented to subjects, and simultaneously the response time was measured. After exploration, subjects needed to compare which explored stimulus were rougher between RS and CS and they needed to click the mouse with their left hand as soon as possible.
Left click if CS was “rougher” than RS, right click if CS was “smoother” than RS, and middle click if they feel both roughness was at the “same” roughness. Once the subject
19
response, it is counted as one trial. In V-V task, subject was asked to perform the same procedures as T-T, except they need to perceived roughness based on visual stimuli. In bi-modal T-Tv task, subjects need to identify the roughness of two different (or same) rough nesses of tactile stimuli with exploration of visual interference stimuli at CS.
Procedures of V-Vt is vice versa of those in T-Tv. (Figure 2.13)
Fig 2.13 Time chart for one trial in the bimodal tactile T-Tv, and bimodal visual V-Vt. In (a) and (b), subjects need to perform the same task as the corresponding unimodal task, except they need to perceive different-modality interference stimulus with CS. The interference stimulus were two types
which are the biggest particle 34 µm and smallest stimulus 1.5 µm.
Six types of stimuli were randomized between RS and CS, and all possible 36 combinations involved. Each combination was repeated 10 times in each session over the course of experiment. For unimodal task (V-V, T-T), there are 36 combinations in
20
each task, which totaling 360 trials. For bi-modal task (V-Vt and T-Tv ), the total amount of trial are doubled into 720 trials because of involvement of interference stimulus. Time estimated for each trial was about 10 to 15 seconds, depending on task.
All tasks were randomized and divided into 6 sessions of 90 minutes to ensure all the subjects to avoid fatigue. Subjects at least had two times of intermission in the 90 minutes’ session which was not compulsory. Only one session was carried out per day;
subjects need at least 6 days to complete all trials. The experiment was carried out in a dark room to sharpen the perception of roughness visually and tactually.
2.4.4 Data processing and analysis
Each participant’s response was analyzed to remove outliers and separate incorrect or double click responses. Reaction time and response distributions for each of the tasks were calculated for each subject. Data were then collapsed across participants and compared using two tasks (tactile and visual) × six CS conditions (six different particle sizes of CS) repeated measures analyses of variance (ANOVAs) in every RS condition (from 1.5, 5.7, until 34 µm; out coming six times of ANOVA per task) to determine if response distribution or reaction time differed by cross modal interaction. The level of significance was fixed at P < 0.05 and Bonferroni test (α= 5%) was performed. Post scanning roughness estimates and individual difference in accuracy and reaction time was analyzed in every RS condition that have main effects or significant interaction with CS conditions; in order to verify the validity of the experimental data obtained.
Subjects were forced to make a choice of what they perceived was the rougher of two stimuli, even if they could not detect a difference. The response rate of “same”
by subjects were divided into half and were contributed to “rougher” and “smoother”
response rate equivalently. As assumption, the guess rate (chance level) is 50% when subject perceive same size of RS and CS. The largest rate of the response “rougher”
percentage is 100% and the smallest will be 0% when subject perceived CS is smoother than RS. Therefore, the sigmoid psychometric function changed from 0% to 100%. We also measured the CS threshold for each RS at 25% and 75%. The logistic curve is the most common sigmoid curve used extensively in cognitive psychological experiments for measuring thresholds [11][12][13]. The response rate data was applied to the
21 following logistic function.
In this equation, d is the unique degrees of freedom of the logistic curve. X is 0.25 or 0.75 when we calculated threshold for each RS at 25% and 75% respectively.
All of the analyses were performed using RStudio Desktop version 1.0.136 (RStudio, Inc.) and SPSS version 17.0 (SPSS, Tokyo, Japan)
2.5 Results
The experiment demanded subjects to compare six different RS to six different CS in two unimodal tasks. A round robin of combinations demanded every subject to do 360 trials for each unimodal task. They also needed to do the same task while perceiving the interference stimulus, making it 720 trials for each bimodal task. In this study, we arranged subject’s reaction time and response by each RS order, starting from RS 1.5, 5.7, until 34µm. We then performed a two modality (tactile and visual) × six CS conditions (six different particle sizes of CS) repeated-measures ANOVA on the data by each RS. We first checked whether there were any main effects of modality, main effects of CS conditions, or significant interaction between the modality and conditions (modality ×CS conditions) in every RS. In the present study, if there were no significant interaction, we will also consider the main effect of modality before doing the post hoc analysis.
2.5.1 Reaction time
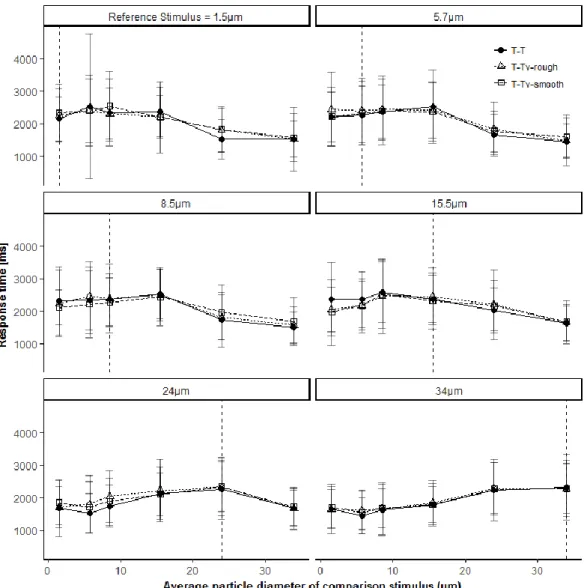
Overall, subjects needed more time to response in tactile task compared to visual task (Figure 2.14). When we compared unimodal tactile and unimodal visual task, there was significance interaction between modality and CS conditions in almost all RS (e.g F(5,95)=4.534, P<0.005 in RS 1.5µm). This was expected since tactile task need the subjects to touch and perceived the tactile before clicking.
1 )
1 ( X Ln X d
Threshold
22
Fig 2.14 Response time and proportion of ‘rougher’ response between unimodal T-T
However, there were no significant differences of response time within each modality when we compared unimodal and bimodal task. This result showed that subjects can response in almost the same time during the bimodal task and the interference stimulus seems did not restraint the time for subjects to response; even in condition that demand them to perceive stimuli by both modalities. In the present study, we did not concentrate on reaction time for discussion
23
Fig 2.15 Response time between unimodal V-V and bimodal tasks
.
2.5.2 Proportion of “rougher” response
Subjects needed to response whether left click, right click or middle click when they sensed CS was “rougher” than RS, “smoother” than RS, or the “same” roughness, respectively We analysed the response distributions of every subject in order to find any kind of effects that generated during bimodal task; visually or tactually. The proportions of “rougher” response by subjects in every task were analysed and we separated them according to RS and CS in order.
24
Fig 2.16. Individual results of (a) tactile task and (b) visual task.
The rates of the response “rougher” as a function of the particle size of the tactile CS are plotted in Figure 2.16 and Figure 2.17b. RS for each CS are arranged vertically in ascending order from 1.5 to 34µm.
25
Fig 2.17 Response time and proportion of ‘rougher’ response between unimodal T-T and unimodal V-V. In (a), subjects needed more time to response in tactile tasks. In (b), roughness tendency were more to visual when the RS is below 8.5 µm, but more to tactile after RS of 15.5µm and above.
To show the difference between tactile and visual rough-ness perception, we compared the proportion of “rougher” response in the unimodal T-T to those in V-V task (Figure 2.17b). Overall, subjects tend to differentiate between smooth and rough excellently when RS and CS are not similar (e.g. 1.5 vs 34, 1.5 vs 24). We performed a two modality (tactile and visual) × six CS conditions (six different particle sizes of CS) repeated-measures ANOVA on the proportion of “rougher” response for each RS. We found significant main effect on modality [F(1,99)=37.54, P < 0.001 in RS 1.5µm] and
26
significant main effect on CS conditions [F(5,95)=428.09, P < 0.001 in RS 1.5µm]. We also found a significant interaction between the modality and CS condition [F(5,95)=26.77, P < 0.001 in RS 1.5µm]. We made a post hoc comparison using Bonferroni correction and we focused on where there were significant difference between modalities on each comparison of RS and CS (asterisk in Fig 4). The post hoc comparison revealed that “rougher” response rate of V-V were significantly higher than those in T-T for RS of 1.5 until 8.5 µm. Interestingly, the opposite phenomenon can be seen from RS of 15.5µm as T-T were significantly higher than those in V-V, except for the comparison of 24µm and 15.5µm.
In order to understand the consequences of cross modalities between tactile and visual, we analyzed the difference between unimodal task and bimodal task, separately by respective modalities. Applying same method as previous paragraph, we highlighted the proportion of “rougher” response in unimodal and separately compared to the two corresponding bimodal task. In tactile, there were one condition with main effects when we compared T-T with T-Tv-rough (Figure 2.18a) and another three conditions when we compared T-T with T-Tv-smooth (Fig 2.18b). In Fig 2.18a, post- hoc analysis showed that rough visual interference stimulus made subjects tend to feel the same stimulus to be tactually rougher than origin (unimodal) perception. On the other hand, smooth visual interference stimulus affects subject’s roughness perception with random pattern.
27
Fig 2.18 Proportion of ‘rougher’ response between unimodal T-T and bimodal T-Tv-rough and unimodal T-T and bimodal T-Tv-smooth. Bold areas (RS 24µm in (a), 8.5, 15.5, 24µm in (b)) are RS with main effects or interaction between the two tasks and CS conditions. Multiple comparisons showed that in (a), rough visual interference stimulus made subjects tend to feel the same stimulus to
be tactually rougher than actual (unimodal) perception. In (b), smooth visual interference stimulus affects subject’s roughness perception with random pattern.
Dissimilarly to tactile task, we detected even more conditions with main effects caused by tactile interference stimulus in visual task. As showed in Fig 2.18a, four conditions with main effects were spotted when we compared V-V with V-Vt- rough. Multiple comparisons in each RS and CS combinations showed that subjects tend to perceive rougher in bimodal rough task. Furthermore, we so identified all conditions with main effects with most of post hoc analysis recorded p-value less than 0.005 between V-V and V-Vt-smooth (Fig 2.18b). Overall, rough and smooth tactile interference stimulus affects subject’s roughness perception randomly in visual tasks.
28
Fig 2.19 Proportion of ‘rougher’ response between unimodal V-V and bimodal V-Vt-rough and unimodal V-V and bimodal V-Vt-smooth. Post-hoc multiple comparison showed significant difference was detected in more pairs of RS (bold area) compared to those in unimodal and bimodal
tactile task. Moreover, far notable amount of significant difference was found in (b) rather than (a).
Overall, rough and smooth tactile interference stimulus affects subject’s roughness perception randomly.
To understand the reason of significant differences be-tween modalities, we analyzed and evaluated six stimuli that we used in this study. According to Weber’s Law, the ratio of the increment threshold to the background intensity is a constant.
Applying this law, we calculated the 25% and 75% threshold of CS for each RS in every task, find the middle point, and divide by corresponding RS.
29
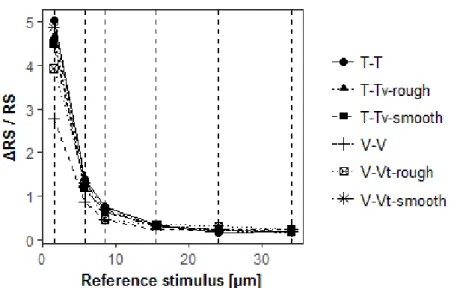
Fig 2.20 For example, in T-T task, with a reference of 1.5µm, subjects need CS of approximately 5µm to eventually perceive it as the same roughness. In this figure, small particle (1.5, 5.7 µm)
showed greater value compared to others in each task
30
The outcome constant number showed the Weber’s constant which is the increment threshold of each RS to perceive the same size of CS (e.g. RS 8.5 and CS 8.5).
As showed in Fig 7, all six tasks showed the same pattern; high constant of small particles and very low constant in big particles (from 15.5µm). As an example, in T-T task, to compare with reference stimulus of 1.5 µm, the increment threshold that subjects needed were 5.1 to perceive CS of 1,5µm.
2.6 Discussion
We were interested to explore the mechanism inside tactile, visual and the interaction between them in the perception of roughness using fine textures. By designing two unimodal tasks and four bimodal tasks accompanying both modalities, we expected to understand more about how humans perceive roughness in behavioral level of tactile and visual
2.6.1 Tactile dominant roughness perception of fine surface
The comparison of unimodal tasks (T-T and V-V) in our study suggested that roughness comparison was related to the spatial properties of the surfaces. We focused on combinations where subjects need to compare CS that was larger than the RS, where subjects were presented CS that were rougher than comparison (right side of reference line in Fig 2.17b, 2.18, 2.19). We detected that subjects perceived a surface rougher visually when the RS is small, but perceived rougher tactually when the RS is bigger (Fig 2.17). This phenomenon can be clarified as the RA (rapidly adapting) and PC (Pacinian corpuscle) afferents in the skin were considered to encode temporal variations related to different surfaces, and the subjects could use the temporal features to reach their final decision regarding their perception. Two factors that can be considered to determine the human perception of haptic roughness are the spatial properties and the temporal properties by touch [5][14][15]. Surfaces with small particles may generate high temporal frequencies, which led the subject to perceive a smoother surface tactually. Bensmaia et al [7] also stated that the perception of surface larger than 200µm was encoded by the spatial and temporal properties that were
31
dominant in the haptic perception of fine surface roughness. In the present study, subjects’ roughness estimation almost showed particle size dependence, therefore led the subject to perceive a smoother surface.
While in visual, the perception of visual roughness is a complex process that may generate more complex neural activations, which much depends on the direction of illumination, viewpoint, and the shadow [9][16][17]. Even we con-trolled the average luminance of all visual stimuli, small particles might give little information to subjects compared to other factors as the visual texture perception mainly focuses on the ability to different distributions of properties such as brightness, size, color, or slope[18].
2.6.2 Influence of interference stimulus in each other modality during cross modalities
How multisensory information is integrated from different modalities and accommodate in brain is still unclear. The bimodal tasks that we composed into present study were carried out in order to find if there is any type of acceleration or suppression in either accuracy rate or reaction time during the appearance of another sensory in a single sensory task. These experiments demanded participants’ ability to make quick and accurate discriminations between multisensory stimuli.
Our results suggested that in bimodal sensory tasks, both visual and tactile tasks roughness perception were influenced, although in different volume. Visual sensory receive a big impact when cross modality occurred from tactile information, more than tactile sensory received. This can be explained by behavioral evidence by Klatzky et al [19] that indicated surface roughness is particularly salient to the tactile sense. On the contrary, we suggest that tactile sensory receiving little effects from visual information when two sensory are working. This may suggest that information encoded across vision and touch may not transfer efficiently across modalities, but we proposed tactile to do the “job” better than vision does.
Moreover, subjects needed more time to response in tac-tile task compared to visual task, but we found no significant differences of response time within each modality when we compared unimodal and bimodal task. This result showed that
32
subjects can response in almost the same time during the bimodal task and the interference stimulus seems did not restraint the time for subjects to response; even in condition that demand them to perceive stimuli by both modalities. In the present study, we did not concentrate on reaction time for discussion but we did observe a trend for reductions in the magnitude of the performance decrements under bimodal tasks, but such changes were quite small in tactile. However, things were different in visual task.
As roughness is recognizes as an important perceptual dimension of texture, this result supports the study by Guest et al [20] which stated the dominance of tactile in texture perception. Moreover, these may suggest that both modalities information processing may not be excellently integrated and dependently different across them.
2.6.3 “Smooth” and “rough” in fine textures
Katz in his review [3] noted that spatial features under 100 µm have different mechanism for perceiving haptic roughness. In the present study, we can divide fine textures into two types, the smoother group (1.5, 5.7, 8.5 µm) and coarser group (15.5, 24, 34 µm). Comparing unimodal tasks directly showed us that subjects perceive the smoother and coarser group differently. This difference showed the importance of spatial features for tactile roughness perception but also challenged on how subjects perceive visually. We suggest that even in spatial features under 100µm, the perception of haptic roughness might diverse in small particle recognition where visual is dominant.
In addition, by looking for type of acceleration or suppression in direct comparison with rough and smooth bimodal tasks, we found that smooth interference stimulus (1.5µm) played a big role to interfere with subject’s perception. In Figure 2.21, small particle has big Weber’s constant in every tactile and visual task. Subjects need more “roughness” to match two visual or tactile stimuli with small particles textures (1.5, 5.7 µm) rather than big particles (8.5, 15.5, 24, 34 µm). By touch or by visual, small particle such as 1.5µm have big “noise” during recognition caused the subjects to confuse during perceiving interference stimulus. The lack of evidence of better performance in bimodal relative to unimodal conditions may be due to different information encoded in each modality and the “noise” might affect the relative dominance of each modality to the percept.
33
Fig 2. 21 Weber’s constant (refer: Weber’s law) of each RS within every task. We define the outcome Weber’s constant here as the increment threshold of each RS to perceive the same size of CS (e.g RS 8.5 and CS 8.5). For example, in T-T task, with a reference of 1.5µm, subjects need CS
of approximately 5µm to eventually perceive it as the same roughness. In this graph, small particle (1.5, 5.7 µm) showed greater value compared to others in each task
Vibrotaction of small particles may be the best explanation for the “noise”
in tactile tasks. In tactile, fine textures are well acknowledged to be perceived by vibrations evoked on the skin during exploration [2][21], but relied on the amplitude Sandpapers with small particles that we used in the present study might yields a great amplitude across the fingertip compared to the coarser group. Moreover, despite most of previous studies give less attention to the role of vision in roughness perception and most claimed that these modalities encode in separate manner, we found visual stimuli in present study have the same tendency as those in tactile stimuli. However, the fact bimodal tasks were not accelerated nor suppressed the “noise” compared to unimodal tasks suggest that the roughness information encoded differently in each modality.
34
2.7 Conclusion
In many situations, stimuli from different sensory modalities will likely convey non-matching information, potentially impairing the ability to process one or more of the stimuli. One common example of this situation occurs during a telephone conversation, when it is highly not probable that the visual stimuli in your environment counterpart the auditory stimuli of the telephone conversation.
These experiments demonstrate the two modalities influence each other during roughness perception of fine surface. We were interested to explore the mechanism inside tactile, visual and the interaction between them in the perception of roughness using fine textures. By designing two unimodal tasks and four bimodal tasks accompanying both modalities, we expected to understand more about how humans perceive roughness in behavioral level of tactile and visual. The experimental results are summarized as follows;
1) Tactile dominant roughness perception of fine surface
2) In bimodal sensory tasks, both visual and tactile tasks roughness perception were influenced, although in different volume.
3) Smaller particles give more influences to accelerate or suppress roughness judgement in each other modality
35
Chapter 3 Neural mechanisms of Roughness Perception by Tactile Visual Cross-modal dot pattern
Abstract
Human sensations always involve in interaction, but a lot of brain’s response during the interaction is still unknown. This study was designed to discover the unresolved part of the brain during performing visual and tactile interaction roughness recognition experiments. We intended to measure the peak value of roughness recognition during the behavioural experiments, but it was not possible to obtain the peak value. For this study, we measured brain activity using fMRI. We designed four types of tasks: visual task (VV), tactile task (TT), visual - tactile task (VT), tactile - visual task (TV). The common area of each of the brain activation during each task was analysed; and the results showed that activations located in the frontal and parietal, suggesting these regions were actively involved in the cross-modal processing. Specific activation for the information from the tactile and visual modality was seen in the frontal and parietal lobe, respectively, suggesting the particular activation in each at this region.
36
3.1 Introduction
Humans need to be able to differentiate surface qualities of objects not only by touch but also visually. This is important for object recognition and for the interaction with objects in our environment[22]. Behavioural studies showed that both haptic and visual information add to texture perception [23] and that a cross modal transfer of texture information between both sensory modalities occurs[24].
Several neuroimaging studies focused on texture matching and discrimination [25][26][27][28] [29][26] as well as on different dimensions of texture perception within the tactile and visual modality; examples include spatial density [30] [31], spatial orientation [32][31];) and roughness [33][30] [34] [35][36] . Most of the tactile studies states the importance of the parietal operculum and the posterior insula [27][34]
[35][36] [37] for processing surface textures, while studies focusing on visual texture perception often report regions near the collateral sulcus, the lingual gyrus and areas in early visual cortex[25][38] [39][40] [28][37] [29]
A recent approach by Hiramatsu et al [41] investigated how visual material properties are coded in the cortex along the ventral visual pathway. A similar distributed network was described by Sathian et al [29] for the processing of haptic texture information. In connectivity analyses Sathian and colleagues showed a flow of texture information from task-non-selective regions of the postcentral gyrus to texture-selective areas in the parietal operculum and further to regions of the middle occipital cortex.
Despite the pure tactile stimulation in many paradigms, consistent visual cortex activation was reported in several of these studies[42] [36][37].
All of the studies that have been mentioned discussed texture perception in separate visual and haptic paradigms. The effect of simultaneous visual and haptic exploration of textures perception has been mostly ignored. An overlap of visual and haptic texture representations in some brain areas can be expected, but interaction between visual and haptic information in the regions were not anticipated. The imaging study by Sathian et al [29] might give the first idea. Behavioral studies also indicate the existence of such crossmodal interaction and matching effects in visuo-haptic tasks. It was shown that people consistently and absolutely match specific tactile vibration rates to visual spatial frequencies [10] indicating some kind of crossmodal association effect in visual and
37
haptic texture perception. Additionally, simultaneous tactile stimulation can disambiguate binocular rivalry, a process in which two equally salient but dissimilar monocular stimuli are presented to corresponding retinal locations [43].
The main objective of the present chapter was to investigate texture perception in a paradigm that combines visual and haptic input in a single condition in order to explore crossmodal interactions at the cortical level. Cross modality effects are different according to individual and the effects activated by it are also believed to be various. In this study, we expect to find the characteristics of those effects related to the cross modal of tactile and visual, during the perception of roughness. We would expect these crossmodal effects already in early sensory cortices, e.g. postcentral gyrus and posterior occipital cortex[44] [41] [42] [29] [37], but perception-related differences rather in higher-order cortical regions, the parietal operculum and the insula [40][41][34].
Occupying on earlier studies we assumed roughness perception by haptic to be correlated with the dot spacing [45][46].
3.2 Experimental stimuli
In this study, we outlined two types of stimuli throughout the experiment; tactile stimuli and visual stimuli. Along with these stimuli, we also arranged the indication stimuli which functioned as the instructor for the subjects. The indication stimuli make sure that a smooth and continuous experiment can be performed.
3.2.1 Tactile stimuli
Tactile stimuli consisted of five types of different acrylic plates which embossed with different dot patterns. Deliberately, the tactile roughness is exactly the same with the correspondence visual stimuli. Each plate is 50.0mm length and 40mm width, which sums the surface area of the stimuli to 20 cm2. The dots were arranged periodically. The dots are 0.6mm high and diameter of 0.8mm.
Index finger of the right hand of subjects contacted with the tactile stimuli. Figure 3.1 is the samples of tactile dot patterns that we used during examination. The inter dot
38
spacing ranged from 1mm to 9mm, in steps of 2mm. The stimuli were manufactured by machining equipment of Okayama University.
Fig 3.1 Samples of tactile stimuli
Table 3.1 Samples of tactile stimuli
3.2.2 Visual stimuli
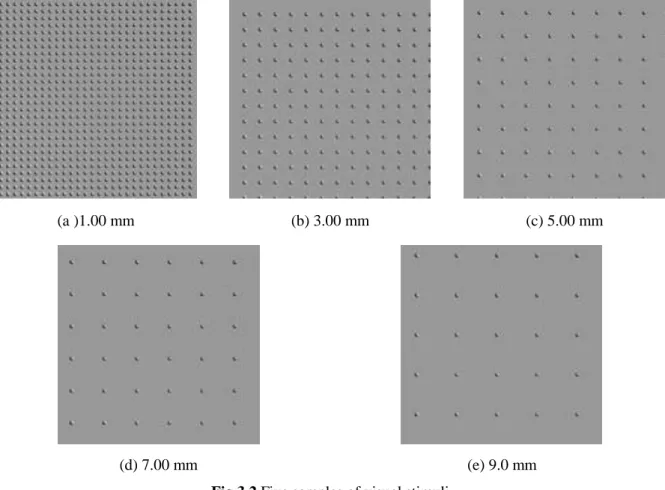
We used dot patterns with the same inter-dot spacing as tactile stimuli for all types of visual stimuli. The brightness of grey scale was fixed into one scale. Distance of presented visual stimuli from computer’s display to subject’s face is 500mm, and the visual scale is exactly the same with the correspondence tactile stimuli. The circles were presented on a grey screen.
Stimulus 1 2 3 4 5
Inter-dot spacing
mm()
1.00 3.00 5.00 7.00 9.00
39
(a )1.00 mm (b) 3.00 mm (c) 5.00 mm
(d) 7.00 mm (e) 9.0 mm
Fig 3.2 Five samples of visual stimuli
3.2.3 Visual indication stimuli
To maximize the smoothness of presentation of tactile and visual stimuli, we designed an automated experimental system for maximum smoothness during fMRI experiments. For this reason, we designed the visual indication stimuli. In this chapter, these stimuli can be divided into four types with four colors. The four colors indicating four different types of instructions. For every task whether it is visual or tactile task, subjects will be presented three times. The initial stimulus is the Reference Stimulus while the secondary stimulus is the Target Stimulus.
As shown in Figure 3.3, visual indication stimuli are four types of cross symbol (+), presented in the center of display, with 17.5mm size at 2 ° central angle. In what is shown, white cross symbol indicates the initial stimulus will be presented in a little while and the subjects need to prepare. Blue and green cross symbols are signs or
40
reminder for subjects to explore the tactile stimulation (dot stimuli). Lastly, red cross symbol is a sign or reminder for subjects to response their answer with the response button. Blue and green indicators will only be presented during presence of tactile stimuli. Figure3.3 shown is the visual indication stimuli in an enlarged view which was used.
(a) White indicator (b) Red indicator (c) Blue indicator (d) Green indicator Fig 3.3 Visual indication stimuli. From left: white (before Reference Stimulus presented), black
(before Comparison Stimulus presented), and red (contact with tactile stimulation)
Besides, to avoid subject confusion during experiment, we designed another two types of visual indication stimuli. The experiment was carried out randomly within four tasks. Thus, subjects need to be aware of the type of forthcoming stimuli, whether it is visual or tactile stimulation. Before the presentation of visual/ tactile stimuli, two Japanese characters which defined “visual” and “tactile” were presented to subjects for two seconds.
(a )Indication stimuli before visual stimuli presentation
(b) Indication stimuli before tactile stimuli presentation
Fig 3.4 Pre-visual and pre-tactile indication stimuli.
3.3 Experimental setup