ORIGINAL ARTICLE
ASSOCIATION BETWEEN BODY COMPOSITION AND PULMONARY FUNCTION BY MEASURING RESTING METABOLIC RATE USING INDIRECT CALORIMETRY IN CHRONIC RESPIRATORY DISEASE
PATIENTS
Mayumi Urushizaka
1),Koichi Okudera
2),Shingo Takanashi
3),Hideaki Yamabe
1), and Ken Okumura
4)Abstract Patients with chronic respiratory diseases have been found to develop malnutrition as a result of enhanced resting metabolic rate (RMR) associated with exacerbated ventilatory impairment. It is therefore necessary to measure each individual’s required amount of energy in order to provide nutritional support. There are few reports regarding the RMR of patients with chronic respiratory diseases that have used indirect calorimetry. We investigated the association between body composition, pulmonary function, and dyspnea grade by measuring RMR using indirect calorimetry in 23 patients with chronic obstructive pulmonary disease (COPD) and 21 patients with interstitial pneumonia (IP). We found no increase in RMR in COPD patients without any decrease in weight or muscle mass and increase in RMR in IP patients. Fat mass was suggested to influence RMR in IP patients. Early nutritional support for COPD patients in whom no reduction in body weight or muscle mass is seen may possibly prevent RMR enhancement and malnutrition. RMR measurements using indirect calorimetry are an easy means of ascertaining the amount of energy required for nutritional support, and are easy enough to use when evaluating the nutritional status of patients with chronic respiratory diseases.
Hirosaki Med.J. 66:38―47,2015
Key words: resting metabolic rate; body composition; pulmonary function; indirect calorimetry;
chronic respiratory disease.
1) Hirosaki University Graduate School of Health Sciences, Hirosaki Japan
2) Hirosaki Chuo hospital, Hirosaki, Japan
3) Hirosaki University Health Administration Center, Hirosaki Japan
4) Department of Respiratory Medicine Hirosaki University Graduate School of Medicine, Hirosaki, Japan
Correspondence: M. Urushizaka
Received for publication, December 12, 2014 Accepted for publication, December 26, 2014
Introduction
Basal metabolic rate (BMR) is the minimum amount of energy required to live at rest both physically and mentally. BMR is measured at rest before the patient is fully awake in the early morning when the digestion and absorption of food ingested in the evening of the day before are completed. Basal metabolism is not easily measured due to these strict conditions. Meanwhile, resting metabolic rate
(RMR) is the metabolic rate while sitting quietly and is approximately 10% higher than
the BMR
1,2). The measurement conditions for RMR are not as strict as those for BMR. That is why RMR is used as an evaluation index for the nutrition required by each individual when providing nutritional support in clinical settings
2).
Patients experience weight gain or weight loss depending on the type of the diseases. It is therefore necessary to evaluate the individual’
s medical condition and nutritional status, in order to manage the patient’s physical condition.
One of the serious problems in patients with
chronic respiratory diseases is malnutrition.
= 1). Long-term oxygen therapy (LTOT) was administered to 6 COPD patients and 8 IP patients (total 14 patients).
Measurements Body Composition
Body weight, fat mass, and fat free mass
(FFM) were measured with a body composition analyzer (TBF-102,TANITA, Japan) by bioelectrical impedance analysis. Ideal body weight (IBW) was calculated as height (m)
squared multiplied by 22. We then calculated the ratio of ideal body weight (%IBW). The body mass index (BMI) was calculated as body weight (kg) divided by height (m) squared.
The fat mass index (FMI) was calculated as fat mass (kg) divided by height (m) squared, while the FFM index was calculated as FFM
(kg) divided by height (m) squared.
RMR
We used a hand-held indirect calorimeter
(MedGem
®Indirect Calorimeter, Microlife Inc., USA) to measure RMR. The MedGem
®is a convenient measuring device for calculating the ideal amount of energy required by each individual because it allows RMR to be measured easily. The reliability of the MedGem
®were validated by the finding that the measured values were reproducible in a comparative study with traditional measuring devices
6-9). The MedGem
®calculates RMR by measuring oxygen uptake
(VO
2). A constant respiratory quotient of 0.85 is used for this calculation. The following equation is used to calculate RMR.
RMR (kcal/day) = 6.931 × VO
2ml/min In order to measure RMR, we limited the intake of food and fluids other than water from 2 hours prior to RMR measurements to eliminate the effect of heat production from diet. Before starting the measurements, subjects rested for 10 minutes in a sitting position. On starting the measurements, subjects wore a nose clip and Malnutrition is known to affect prognosis
particularly in patients with chronic obstructive pulmonary disease (COPD). The causes of this include hypermetabolism and insufficient dietary intake
3-5). Malnutrition leads to increased risk of complications such as decreased physical activity and quality of life, osteoporosis, and infections; therefore, patients with chronic respiratory diseases require appropriate nutritional support
3). Measuring the RMR of patients with chronic respiratory diseases is useful in managing a patient’s physical condition. Recently, the hand-held indirect calorimeter (MedGem
®Indirect Calorimeter, Microlife Inc., USA) has been developed and can easily measure RMR, and its measurement results have been proven valid and reliable
6,7). However, few reports have measured RMR in patients with chronic respiratory diseases using a hand-held indirect calorimeter.
We investigated the association between body composition, pulmonary function, and dyspnea grade by measuring RMR in patients with chronic respiratory diseases using the MedGem
®hand-held indirect calorimeter.
Methods
Subjects
The study was conducted between February and August 2013. Subjects comprised 44 patients including 36 men and 8 women
(mean age: of 73.3 ± 7.8 years) with chronic respiratory diseases visiting hospital on an outpatient basis. All of these patients were followed-up at the Clinic of Hirosaki Chuo Hospital. Of the 44 patients, 23 had COPD and the other 21 interstitial pneumonia (IP).
The diagnoses among the IP patients were
idiopathic interstitial pneumonia (n = 13),
pulmonary involvement associated with collagen
vascular diseases (n = 7), and anti-neutrophil
cytoplasmic antibody-associated vasculitis (n
inserted a mouthpiece. RMR measurements were taken while subjects breathed normally for approximately 10 minutes and took a total of 20–30 minutes, including a rest period.
Oxygen inhalation also influences RMR results, and therefore, we withheld oxygen therapy in subjects undergoing LTOT until the end of measurement, including the period of seated rest, with the permission of their attending physician. The measurement environment had a mean room temperature of 24.9 ± 1.1°C and humidity of 47.1 ± 11.0%. Measured values were designated measured RMR (RMRm).
BMR can be estimated using an equation.
We used the Harris-Benedict Equation based on the components of height, weight, age, and sex to calculate BMR. The calculated value was designated as the estimated RMR (RMRe). The Harris-Benedict Equation is as follows.
Male: 66.4730 + 13.7516 × weight <kg> + 5.0033 × height <cm> − 6.7550 × age
Female: 655.0955 + 9.5634 × weight <kg> + 1.8496 × height <cm> − 4.6756 × age
The difference between the measured RMR and estimated RMR is calculated as RMRm/RMRe
× 100 (%).
RMR is influenced by physique and is known to be directly proportional to FFM. To reduce the effect of physique, we calculated the value obtained by dividing measured RMR by FFM
(RMRm/FFM). We used RMRm/FFM when comparing RMR.
Pulmonary function
The CHESTAC-8900 (CHEST, Japan) was used for the pulmonary function test. Thirty- eight patients (19 COPD patients and 19 IP patients) underwent the pulmonary function test (forced expiratory volume in one second/
forced vital capacity [FEV
1/FVC], percentage of forced expiratory volume in one second [%FEV
1], and percent vital capacity [%VC]).
Subjective symptoms
We used the modified Medical Research Council Dyspnea Scale (mMRC) to assess dyspnea. The mMRC can easily evaluate the degree of dyspnea in patients on a 5-point scale from “0” to “4”
10). The degrees of dyspnea evaluated by the mMRC are as follows: 0, I only get breathless with strenuous exercise.; 1, I get short of breath when hurrying on the level or walking up a slight hill.; 2, I walk slower than people of the same age on the level because of breathlessness, or I have to stop for breath when walking on my own pace on the level.; 3, I stop for breath after walking about 100 meters or after a few minutes on the level.; 4, I am too breathless to level the house or I am breathless when dressing or undressing.
Statistical analyses
All statistical analyses were performed using SPSS version 22 software (SAS Institute Inc., Cary, NC). Results are shown as means and standard deviations or as aggregate results and percentages. The independent two-sample t-test and Mann-Whitney U test were used for intergroup comparisons. Pearson’s product moment correlation coefficient was used to examine the relationship between RMR, age, weight, body composition, and pulmonary function. A P value of <0.05 was considered to indicate a significant difference.
Ethical Considerations
This study was approved by the Ethics
Committee of Hirosaki University Graduate
School of Medicine (Ethics Committee Permission
No.2012-024). We explained the aim of this study
to the subjects and the anonymous and voluntary
nature of their participation.
Results
We measured RMR in 44 patients (23 COPD patients and 21 IP patients) with chronic respiratory diseases using the MedGem
®. Measurement was discontinued in 1 male COPD patient undergoing LTOT due to coughing during RMR measurements. Apart from this patient, RMR measurements were completed without any problem (Table 1).
The body composition and RMR of patients with
chronic respiratory diseases
The mean %IBW of all the patients with chronic respiratory diseases was 103.0 ± 18.0%
and the mean BMI 22.7 ± 4.0. The mean RMRm of patients was 1335.1 ± 361.2kcal/day, the RMRe 1173.7 ± 212.8 kcal/day, the RMRm/RMRe 113.5
± 22.8%, and the RMRm/FFM 29.80 ± 7.82 kcal/
kg/day. The RMRm was significantly higher than the RMRe (p<0.01) (Table 2).
The RMRm of all 43 patients with chronic respiratory diseases was inversely correlated with age and positively correlated with weight,
%IBW, BMI, fat mass, FMI, FFM and FFM index (Table 3).
The RMRm/FFM of the 43 patients with chronic respiratory diseases was inversely correlated with age and positively correlated with fat mass and FMI.
The body compositions and resting metabolic rates of COPD and IP patients
The 43 patients with chronic respiratory diseases were divided into 2 groups according to their ventilatory impairment (COPD and IP groups) and the results were compared between the 2 groups.
Table 1 Patient characteristics
Patients n=43 n (%)
Age (years) Mean±SD 73.0 ± 7.6 Gender
Male 35 (81.4)
female 8 (18.6)
Disease
COPD 22 (51.2)
IP 21 (48.8)
LTOT
Usage 13 (30.2)
None 30 (69.8)
COPD; Chronic obstructive pulmonary disease.
IP; Interstitial pneumonia.
LTOT; Long term oxygen therapy.
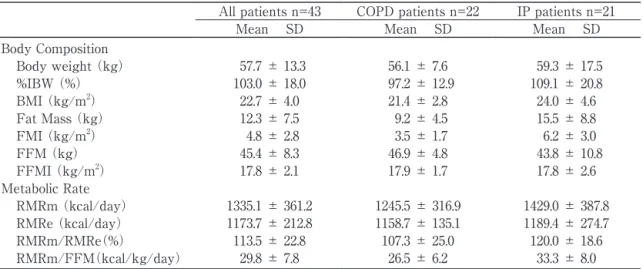
Table 2 Body composition and metabolic rate of patients
All patients n=43 COPD patients n=22 IP patients n=21
Mean SD Mean SD Mean SD
Body Composition
Body weight (kg) 57.7 ± 13.3 56.1 ± 7.6 59.3 ± 17.5
%IBW (%) 103.0 ± 18.0 97.2 ± 12.9 109.1 ± 20.8
BMI (kg/m2) 22.7 ± 4.0 21.4 ± 2.8 24.0 ± 4.6
Fat Mass (kg) 12.3 ± 7.5 9.2 ± 4.5 15.5 ± 8.8
FMI (kg/m2) 4.8 ± 2.8 3.5 ± 1.7 6.2 ± 3.0
FFM (kg) 45.4 ± 8.3 46.9 ± 4.8 43.8 ± 10.8
FFMI (kg/m2) 17.8 ± 2.1 17.9 ± 1.7 17.8 ± 2.6
Metabolic Rate
RMRm (kcal/day) 1335.1 ± 361.2 1245.5 ± 316.9 1429.0 ± 387.8 RMRe (kcal/day) 1173.7 ± 212.8 1158.7 ± 135.1 1189.4 ± 274.7
RMRm/RMRe(%) 113.5 ± 22.8 107.3 ± 25.0 120.0 ± 18.6
RMRm/FFM(kcal/kg/day) 29.8 ± 7.8 26.5 ± 6.2 33.3 ± 8.0
%IBW; Percent ideal body weight BMI; Body mass index FMI; Fat mass index.
FFM; Fat free mass FFMI; Fat free mass index.
RMR; Resting metabolic rate RMRm; measured RMR RMRe; estimated RMR.
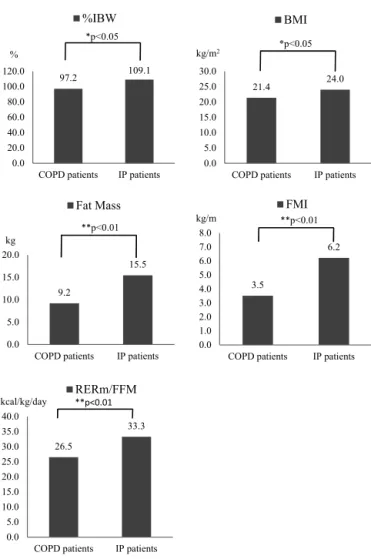
The mean BMI was 21.4 ± 2.8 in COPD patients and 24.0 ± 4.6 in IP patients. An intergroup comparison revealed a significant difference in %IBW, BMI, fat mass, and FMI, and COPD patients were slimmer and had less fat mass than IP patients (Fig.1).
COPD patients had a mean RMRm of 1245.5
± 316.9 kcal/day, RMRe of 1158.7 ± 135.1 kcal/
day, and RMR/FFM of 26.50 ± 6.16 kcal/kg/day, whereas IP patients had a mean RMRm of 1429.0
± 387.8 kcal/day, RMRe of 1189.4 ± 274.7 kcal/
day, and RMR/FFM of 33.26 ± 8.01 kcal/kg/day
(Table2). The RMRm/FFM of COPD patients was significantly lower than that of IP patients
(Fig. 1).
The RMRm of COPD patients was only positively correlated with weight and FFM, while the RMRm of IP patients was negatively correlated with age and positively correlated with weight, %IBW, BMI, fat mass, FMI, FFM and FFM index (Table3).
No correlation was seen between RMRm/
FFM and age, weight, or body composition in COPD patients. However, a negative correlation was seen between RMRm/FFM and age in IP patients.
RMR and dyspnea in patients with chronic
respiratory diseases
The most common degree of dyspnea among all 43 patients with chronic respiratory diseases according to the mMRC was Grade 1 (34.9%), followed by Grade 3 (25.6%) (Table 4). The mean mMRC grade was 1.72 ± 1.14.
The most common degree of dyspnea in an intragroup comparison of the 22 COPD patients and 21 IP patients was mMRC Grade 1 (Table 4). The mean mMRC grade was 1.68 ± 1.13 in COPD patients and 1.76 ± 1.18 in IP patients, with no significant difference.
To investigate the effect of dyspnea on RMR, we examined the correlation between RMRm/FFM and mMRC in all 43 patients, but found no significant association. The 22 COPD patients and 21 IP patients were also examined separately, but no correlation was found between RMRm/FFM and dyspnea.
RMR and pulmonary function in patients with chronic respiratory diseases
We examined pulmonary function in 38 of the patients. 19 COPD patients had obstructive ventilator impairment and moderate airflow obstruction (%FEV
1;58.1 ±20.0). Meanwhile, decreased %VC was seen in 19 IP patients
(Table 5).
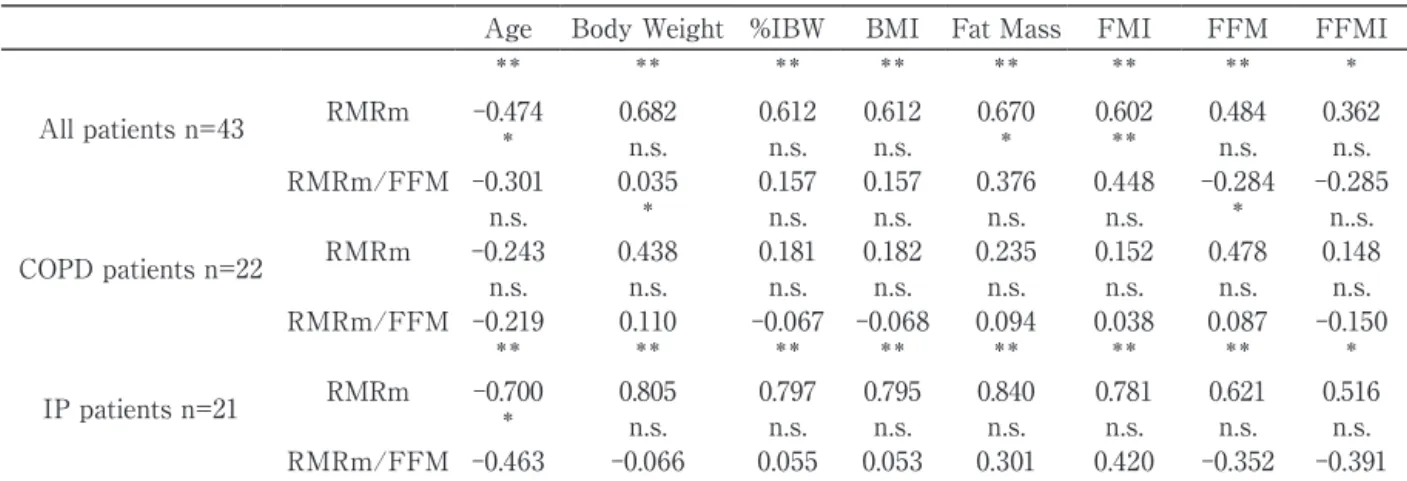
Table 3 Pearson correlation coefficients between metabolic rate and body composition
Age Body Weight %IBW BMI Fat Mass FMI FFM FFMI
** ** ** ** ** ** ** *
All patients n=43 RMRm -0.474 0.682 0.612 0.612 0.670 0.602 0.484 0.362
* n.s. n.s. n.s. * ** n.s. n.s.
RMRm/FFM -0.301 0.035 0.157 0.157 0.376 0.448 -0.284 -0.285
n.s. * n.s. n.s. n.s. n.s. * n..s.
COPD patients n=22 RMRm -0.243 0.438 0.181 0.182 0.235 0.152 0.478 0.148
n.s. n.s. n.s. n.s. n.s. n.s. n.s. n.s.
RMRm/FFM -0.219 0.110 -0.067 -0.068 0.094 0.038 0.087 -0.150
** ** ** ** ** ** ** *
IP patients n=21 RMRm -0.700 0.805 0.797 0.795 0.840 0.781 0.621 0.516
* n.s. n.s. n.s. n.s. n.s. n.s. n.s.
RMRm/FFM -0.463 -0.066 0.055 0.053 0.301 0.420 -0.352 -0.391
*p<0.05 **p<0.01 n.s. no signigicant.
%IBW; Percent ideal body weight BMI; Body mass index FM; Fat mass FMI; Fat mass index FFM; Fat free mass.
FFMI; Fat free mass index.
Fig. 1 Comparison of COPD patients and IP patients
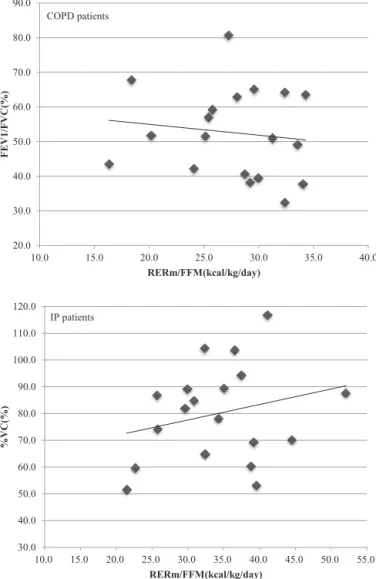
To examine the correlation between pul- monary function and RMRm/FFM in the 38 patients, we divided patients into 19 COPD patients with obstructive ventilatory impairment and 19 IP patients with restrictive ventilatory impairment. No correlation was seen between
%FEV
1and RMRm/FFM in the COPD patients or between %VC and RERm/FFM in the IP patients (Fig. 2).
Table 4 mMRC of patients
All patients n=43 COPD patients n=22 IP patients n=21
n(%) n(%) n(%)
mMRC
0 6(14.0) 3(13.6) 3(14.3)
1 15(34.9) 8(36.4) 7(33.3)
2 9(20.9) 5(22.7) 4(19.0)
3 11(25.6) 5(22.7) 6(28.6)
4 2(4.7) 1(4.5) 1(4.8)
mMRC; modified Medical research Council.
Fig.1 Comparison of COPD patients and IP patients
97.2 109.1
0.0 20.0 40.0 60.0 80.0 100.0 120.0
COPD patients IP patients
%
%IBW
*p<0.05
21.4 24.0
0.0 5.0 10.0 15.0 20.0 25.0 30.0
COPD patients IP patients kg/m2
BMI
9.2
15.5
0.0 5.0 10.0 15.0 20.0
COPD patients IP patients kg
Fat Mass
3.5
6.2
0.0 1.0 2.0 3.0 4.0 5.0 6.0 7.0 8.0
COPD patients IP patients FMI
*p<0.05
**p<0.01
**p<0.01
26.5
33.3
0.0 5.0 10.0 15.0 20.0 25.0 30.0 35.0 40.0
COPD patients IP patients RERm/FFM
**p<0.01 kcal/kg/day
kg/m
Fig. 2 Relationship between RMRm/FFM and pulmonary function in COPD patients and IP patients.
Fig. 2 Relationship between RMRm/FFM and pulmonary function in COPD patients and IP patients 20.0
30.0 40.0 50.0 60.0 70.0 80.0 90.0
10.0 15.0 20.0 25.0 30.0 35.0 40.0
FEV1/FVC(%)
RERm/FFM(kcal/kg/day)
30.0 40.0 50.0 60.0 70.0 80.0 90.0 100.0 110.0 120.0
10.0 15.0 20.0 25.0 30.0 35.0 40.0 45.0 50.0 55.0
%VC(%)
RERm/FFM(kcal/kg/day) COPD patients
IP patients
Discussion
RMR is known to be influenced by the disease type and condition. The nutritional status of patients with chronic diseases is often poor; therefore, when providing nutritional
support, it is advisable to perform nutritional evaluation by measuring RMR
11,12). The factors influencing RMR have been studied in each disease. Cirrhotic patients have reduced muscle mass and sarcopenia; thus, it is necessary to provided nutritional support tailored to
Table 5 Pulmonary function of patients
All patientsn=38 COPD patients n=19 IP patients n=19
Mean SD Mean SD Mean SD
%VC (%) 89.0 ± 25.6 97.9 ± 29.3 80.0 ± 18.0
FEV1/FVC (%) 67.1 ± 19.5 52.6 ± 12.8 81.6 ± 13.0
%FEV1 (%) 70.1 ± 24.8 58.1 ± 20.0 82.1 ± 23.7
%VC; Percent vital capacity.
FEV1/FVC; Forced expiratory volume in one second/forced vital capacity.
%FEV1; Percentage of forced expiratory volime in one second.
the individual patient by measuring RMR
13). Meanwhile, patients with chronic heart failure have been found to have an enhanced RMR due to increased cardiac load and anemia
14). Patients with chronic respiratory diseases, on the other hand, experience weight loss and malnutrition as a result of decreased dietary intake due to reduced digestive function and dyspnea associated with eating behavior
15). It is therefore necessary to maintain good nutritional status for systemic management
3). In the previous study, COPD is a chronic respiratory disease in which the workload of the respiratory muscles is increased in conjunction with a decrease in ventilatory efficiency, airway resistance is enhanced due to airway obstruction, and RMR is increased due to smoking etc.
16).
The mean RMRm/RMRe of COPD patients in the present study was 107.3 ± 25.0%. In general, the RMRm is approximately 10%
higher than the RMRe. In this study, the measured RMRm and estimated RMRe were close in value. Moreover, we saw no significant difference in the RMRm and RMRe of COPD patients. Therefore, the RMR of COPD patients did not increase, being inconsistent with the previous reports
16). A possible reason for this is that no weight loss, which is a cause of enhanced RMR, was seen in COPD patients in this study. Another possible reason is that muscle mass was maintained due to a FFM index of ≥16.0 kg/m
2. Moreover, moderate obstructive ventilatory impairment with a mean
%FEV1 of 58.1 ± 20.0% was seen. The mean mMRC grade for dyspnea due to living behavior was 1.68 ± 1.13, which was the degree at which breathlessness was felt from walking at a brisk pace and climbing slopes. The COPD patients in the present study did not have an enhanced RMR because they experienced no increase in respiratory workload associated with activities of daily living and no decrease in weight or muscle mass.
On the other hand, the RMRm/RMRe in IP patients was 120.0 ± 18.6%. The RMRm exceeded the RMRe and RMRm was significantly higher as compared with RMRe. It is reported that the RMR increased in patients with restrictive ventilatory impairment
17)and identified increased workload of the respiratory muscles caused by decreased lung volume and compliance as the reason behind this. In the present study, the RMRm was likely higher in IP patients due to the increased workload of the respiratory muscles. Another likely reason is fat mass, which was identified as a factor influencing RMR. In addition to FFM fat mass has been reported to affect RMR especially in obese patients
18,19). It is also reported visceral fat mass as a determinant of RMR
20). Moreover, the results of the present study showed that RMRm was positively correlated with fat mass in IP patients and fat mass was found to be significantly greater in IP patients than in COPD patients. Our findings thus suggested that fat mass was a cause of the high RMRm in IP patients.
Few studies to date have compared RMR between COPD and IP patients. In the present study, RMRm/FFM was used as an index for comparing RMR between the 2 diseases. As a result, we found that the mean RMRm/FFM was 26.5 ± 6.2 kcal/kg/day in COPD and 33.3
± 8.02 kcal/kg/day in IP patients, indicating that RMRm/FFM was significantly lower in the former. A possible reason for this RMRm is, as stated above, the increased respiratory workload and greater fat mass of IP patients.
The FFM used in our comparisons is composed of elements including bone, muscle and organ tissue and water content. The metabolic rate of each tissue is known to differ. Moreover, the composition ratio of each tissue also differs according to the individual. The composition ratio and metabolic rate of FFM may thus influence the RERm.
In conclusion, we found no increase in RMR in
COPD patients without any decrease in weight or muscle mass and increase in RMR in IP patients.
Our comparison of RMR between COPD patients and IP patients suggested that the factors influencing RMR differ depending on the disease.
RMR measurements can be performed easily in clinical settings using the MedGem
®, which is sufficiently useful for evaluating nutritional status in patients with chronic respiratory diseases.
Acknowledgements
We would like to express our deepest gratitude to the Clinic of Hirosaki Chuo Hospital and their staff for their cooperation. This work was supported by JSPS KAKENHI Grant Number 24659982.
References
1)Levine JA. Measurement of energy expenditure.
Public Health Nutr. 2005;8:1123-32.
2)Psota T, Chen KY. Measuring energy expenditure in clinical populations: rewards and challenges.
Eur J Clin Nutr. 2013;67:436-42.
3)Thomsen C. Nutritional support in advanced pulmonary disease. Respir Med. 1997;91:249-54.
4)Pingleton SK. Enteral nutrition in patients with respiratory disease. Eur Respir J. 1996;9:364-70.
5)Schols AMWJ. Nutrition and respiratory disease.
Clin Nutr. 2001;20 Suppl. 1:173-9.
6)Compher C, Hise M, Sternberg A, Kinosian BP.
Comparison between Medgem and Deltatrac resting metabolic rate measurements. Eur J Clin Nutr. 2005;59:1136-1141.
7)McDoniel SO. A systematic review on use of a handheld indirect calorimeter to assess energy needs in adults and children. Int Sport Nutr Exerc Metab. 2007;17:491-500.
8)Fields DA, Kearney JT, Copeland KC. Medgem hand-held calorimeter is valid for resting energy expenditure measurement in healthy children.
Obsety. 2006;14:1755-61.
9)St-Onge MP, Rubiano F, Jones A Jr, Heymsfield SB. A new hand-held indirect calorimeter to measure postprandial energy expenditure. Obse Res. 2004; 12:704-9.
10)Kim S, Oh J, Kim YI, Ban HJ, Kwon YS, Oh IJ, Kim KS, et al. Differences in classification of COPD group using COPD assessment test (CAT)
or modified Medical research Council (mMRC)
dyspnea scores: a cross-sectional analyses. BMC Pulm Med. 2013;13:35. doi: 10.1186/1471-2466-13-35.
11)Slinde F, Ellegård L, Grönberg AM, Larsson L, Rossander-Hulthén L. Total energy expenditure in underweight patients with severe chronic obstructive pulmonary disease living at home.
Clin Nutr. 2003;22:159-65.
12)Cohen RI, Marzouk K, Berkoski P, O’Donnell CP, Politsky VY, Scharf SM. Body composition and resting energy expenditure in clinically stable, non-weight-losting patients with severe emphysema. Chest. 2003;124:1365-72.
13)Glass C, Hipskind P, Cole D, Lopez R, Dasarathy S. Handheld caqlorimeter is a valid instrument to quantify resting energy expenditure in hospitalized cirrhotic patients: a prospective study. Nutr Clin Pract. 2012;27(5):677-88.
14)Vaisman N, Silverberg DS, Wexler D, Niv E, Blum M, Keren G, Soroka N, et al. Correction of anemia in patients with congestive heart failure increases resting energy expenditure. Clin Nutr.
2004;23:355-61.
15)Itoh M, Tsuji T, Nemoto K, Nakamura H, Aoshiba K. Undernutrition in patients with COPD and its Treatment. Nutrients. 2013;5:1316-35.
16)Ikuno M. Study on relationof body composition, respiratory muscle strength, and serum cytokines to energy metabolism in pulmonary emphysema.
J Nara Med Assoc. (in Japanese) 1999;50(6):479- 96.
17)Sasaki M. Energy metabolism, respiratory heat loss, and lung functions in patients with chronic obstructive pulmonary disease and pulmonary fibrosis. Jpn J Thorac Dis (in Japanese) 1992;30
(7):1265-72.
18)Lazzer S, Bedobni G, Lafortuna CL, Marazzi N, Busti C, Galli R, De Col A, et al. Relationship between basal metabolic rate, gender, age, and body composition in 8,780 white obese subjects.
Obesity (Silver Sprng). 2010;18:71-8.
19)Nelson KM, Weinsier RL, Long CL, Schutz Y.
Predication of resting energy expenditure from fat-free mass and fat mass. Am J Clin Nurt.
1992;56:848-56.
20)Armellini F, Zamboni M, Pergola G DE, Bissoli L, Turcato E, Giorgino R, Bosello O. Resting energy expenditure, growth hormone indices, body composition and adipose tissue distribution in premenopausal women. J Intern Med.
2000;247:709-14.