Large As sublattice distortion in sphalerite ZnSnAs2 thin films revealed by x-ray fluorescence holography
Kouichi Hayashi, Naotaka Uchitomi, Keitaro Yamagami, Akiko Suzuki, Hayato Yoshizawa, Joel T. Asubar, Naohisa Happo, and Shinya Hosokawa
Citation: Journal of Applied Physics 119, 125703 (2016); doi: 10.1063/1.4945004 View online: http://dx.doi.org/10.1063/1.4945004
View Table of Contents: http://scitation.aip.org/content/aip/journal/jap/119/12?ver=pdfcov Published by the AIP Publishing
Articles you may be interested in
Epitaxial Cu2ZnSnS4 thin film on Si (111) 4° substrate Appl. Phys. Lett. 106, 252102 (2015); 10.1063/1.4922992
Inhomogeneous distribution of manganese atoms in ferromagnetic ZnSnAs2:Mn thin films on InP revealed by three-dimensional atom probe investigation
J. Appl. Phys. 117, 17B905 (2015); 10.1063/1.4914065
Investigation of combinatorial coevaporated thin film Cu2ZnSnS4. I. Temperature effect, crystalline phases, morphology, and photoluminescence
J. Appl. Phys. 115, 173502 (2014); 10.1063/1.4871664
Magnetization dependence on electron density in epitaxial ZnO thin films codoped with Mn and Sn J. Appl. Phys. 97, 053904 (2005); 10.1063/1.1856225
Studies of Mn/GaAs digital alloys using x-ray absorption fine structure and x-ray diffraction methods
Appl. Phys. Lett. 80, 2654 (2002); 10.1063/1.1467982
Large As sublattice distortion in sphalerite ZnSnAs 2 thin films revealed by x-ray fluorescence holography
Kouichi Hayashi,
1,a)Naotaka Uchitomi,
2Keitaro Yamagami,
2Akiko Suzuki,
2Hayato Yoshizawa,
2Joel T. Asubar,
3Naohisa Happo,
4and Shinya Hosokawa
51
Department of Materials Science and Engineering, Nagoya Institute of Technology, Nagoya 466-8555, Japan
2
Department of Electrical Engineering, Nagaoka University of Technology, Nagaoka 940-2188, Japan
3
Graduate School of Engineering, University of Fukui, Fukui 910-8507, Japan
4
Graduate School of Information Sciences, Hiroshima City University, Hiroshima 731-3194, Japan
5
Department of Physics, Graduate School of Science and Technology, Kumamoto University, Kumamoto 860-8555, Japan
(Received 18 December 2015; accepted 17 March 2016; published online 30 March 2016)
The structure of a ZnSnAs
2thin film epitaxially grown on an InP substrate was evaluated using x-ray fluorescence holography. The reconstructed three-dimensional atomic images clearly show that the crystal structure of the ZnSnAs
2thin film is mainly of the sphalerite type, in contrast to the bulk form. A large disordering of the As layers is observed, whereas the positions of the Zn/Sn atoms are relatively stable. The analysis of the data indicates that the As layers serve as a buffer and relax the strain caused by the random occupation of Zn and Sn atoms. These results provide further understanding and a means of controlling the growth of Mn-doped ZnSnAs
2, a high-T
cdiluted magnetic semiconductor. V
C2016 AIP Publishing LLC.
[http://dx.doi.org/10.1063/1.4945004]
I. INTRODUCTION
Over the last five years, x-ray fluorescence holography
1(XFH) has been used for various types of structural charac- terization of crystals, such as to clarify the local environ- ments and lattice distortions around impurity atoms,
2,3the formation of local-
4and intermediate-range
5,6clusters, and lattice distortions around specific elements.
7,8These results are not easy to obtain by conventional diffraction or x-ray absorption fine structure (XAFS) experiments. Another diffi- culty in the structural characterization of crystals addressed in this article is the quantitative determination of crystal forms in disordered systems.
9For example, the solar cell material ZnSnP
2has a chalco- pyrite structure in the bulk form at room temperature.
10Bulk ZnSnP
2is known to undergo an order–disorder (chalcopyrite- sphalerite) transition at 720
C.
11With the change in crystal symmetry, the electronic structure varies and the band gap sig- nificantly decreases from 1.66 to 1.24 eV upon the transition.
12The band gaps of chalcopyrite and sphalerite ZnSnP
2thin films were also reported to be 1.683 and 1.383 eV, respectively.
13The coexistence of equilibrium ordered- and nonequilibrium disorder phases has been discussed for epitaxial ZnSnP
2thin films on GaAs substrates using high-resolution x-ray diffraction (XRD). This coexistence depends on Zn/Sn flux ratio
14and the substrate temperature during growth.
15Thus, this material in the thin-film form can have a mixture of chalcopyrite and sphalerite phases with different band gaps but the same chemi- cal composition.
In principle, a specific structure in thin films can be precisely detected by high-resolution XRD measurements by
observing specific Bragg peaks characteristic of the struc- ture, as was carried out by Francoeur et al. for ZnSnP
2thin films.
15They also determined Bragg-William order parame- ter characterized by the average long-range order in the mixed sublattice. For analyzing the order degree of the chal- copyrite structure, infrared or Raman spectra of ZnSnP
2thin films are useful by referring to the structural model given in Ref. 14. Moreover, further investigation of structural proc- esses, such as the lattice distortions and cluster formations around specific elements, is difficult to perform by only using these conventional methods.
In this study, we investigated ZnSnAs
2thin film epitax- ially grown on an InP substrate.
16II-IV-V
2ternary com- pound semiconductors are known as promising materials for thermophotovoltaic solar cells, nonlinear optics, and infrared detectors.
17,18There has been renewed interest in ZnSnAs
2after a report of room-temperature ferromagnetism in Mn- doped bulk ZnSnAs
2.
19Such ferromagnetism has also been investigated in thin film grown on InP substrate by molecular beam epitaxy (MBE).
20,21In bulk form under ambient conditions, ZnSnAs
2crys- tallizes in the stable chalcopyrite structure (space group:
I 42d) with a ¼ 5.851 and c ¼ 11.702 A ˚ , which undergoes a transformation at 655
C (Ref. 22) to the metastable sphaler- ite structure (space group: F 43m) with the same a value.
10In the chalcopyrite structure (see the insets of Figs. 2(b) and 2(c), Zn and Sn atoms are tetrahedrally coordinated with four As atoms, and the As atoms are tetrahedrally bonded with two Zn and two Sn atoms in a specific order. Two iden- tical fcc cells are stacked on each other to form a body- centered tetragonal structure, which may produce optical anisotropy. In the sphalerite structure (see the inset of Fig. 2(d)), on the other hand, Zn and Sn atoms are randomly distributed on the cation sublattice, and there is no optical
a)
Author to whom correspondence should be addressed. Electronic mail:
[email protected].
0021-8979/2016/119(12)/125703/9/$30.00 119, 125703-1 VC2016 AIP Publishing LLC
anisotropy, although the local structure is similar to that of the chalcopyrite structure.
Similar to the ZnSnP
2crystal, different optical and elec- tronic properties are expected in the ZnSnAs
2crystal for the chalcopyrite and sphalerite structures owing to the structural ordering in the chalcopyrite form. To our knowledge, how- ever, there had been no measurements to verify this.
Nevertheless, it is very important for applications to quanti- tatively know the fraction of chalcopyrite and sphalerite structures in thin films of this alloy crystal.
XFH provides three-dimensional (3D) atomic images around a specific element emitting its own fluorescent x- rays.
1Recent technical advances in XFH using intense syn- chrotron radiation facilities have enabled 3D images to be reproduced with a diameter of a 10 A ˚ order, called middle- range local structures. Moreover, XFH is very sensitive to positional fluctuations of each of neighboring atoms. Note that the As atoms in ZnSnAs
2are much more clearly visible in XFH than the P atoms in ZnSnP
2because the x-ray scat- tering ability of As is much greater than that of P.
In this paper, we report the results of Zn Ka XFH experiments on a ZnSnAs
2thin film epitaxially grown on an InP substrate. From the reconstructed 3D atomic image, we not only quantitatively determine the crystal type but also clarify the sublattice distortions in the thin film. On the basis of these structural results, we discuss its structural features as a host material for the room-temperature ferromagnetic semiconductor Mn-doped ZnSnAs
2.
II. EXPERIMENTAL PROCEDURE
A ZnSnAs
2epitaxial single-crystal layer was grown on a semi-insulating InP substrate with a (001) surface by MBE using a procedure described elsewhere.
20,21The homogene- ity of the thin film was monitored by reflection high-energy electron diffraction during the growth of the film. The film thickness was chosen to be 500 nm. The structure of the sam- ple film was examined using XRD, and it was confirmed that the sample was of high single-crystal quality. Bragg peaks characteristic of the chalcopyrite structure was not clearly identified from the XRD data. A GaAs thin film with the same thickness was also grown on a Ge(001) substrate by MBE as a reference in the XFH measurement. Then, the samples were cut to a surface size of 10 10 mm
2.
The XFH experiment was carried out at the beamline BL6C of the Photon Factory in the High Energy Accelerator Research Organization (PF-KEK) in Tsukuba, Japan. The Zn Ka fluorescent x-rays were collected using an avalanche pho- todiode detector with a cylindrical graphite energy analyzer.
The measurements were performed by rotating two axes of the sample, 0
h 75
in steps of 1:0
and 0
/ 360
in steps of 0:35
, and detecting the small modulations with angles of about 0.3%. Such holograms were recorded with 15 different energies of the incident x-rays of 9.3–13.8 keV in steps of 0.25 keV. The average count rate of the Zn Ka fluorescent x-rays was about 200 000 cps, and each scan took about 3 h. One of the aims of the present work was quantitative determination of atomic fluctuations like our past studies.
2,8To perform this, we needed a
standard sample, in which mean square displacements of atoms were already determined by other method. To avoid the sample form effect, we chose a GaAs thin film, not a GaAs bulk. Therefore, we measured Ga Ka holograms of this sample under the same experimental condition.
Holographic oscillation data were obtained by subtracting the background from the fluorescent x-ray intensities and nor- malizing them by the incident x-ray intensities. The statistical improvement of the holographic data was carried out by twofold-symmetrizing the raw data using the crystallographic symmetry of the chalcopyrite and sphalerite crystal structures and the measured x-ray standing wave (XSW) lines.
For comparison with the experimental data, a theoretical hologram was obtained using chalcopyrite and sphalerite crystal model clusters by simulating the scattering in the crystals. The lattice constants of the chalcopyrite and sphal- erite forms were fixed to the values obtained by XRD by Vaipolin et al.,
10and the cluster radius was about 60 A ˚ with about 33 500 atoms around the central Zn atom. Atomic scat- tering intensities from neighboring atoms were simulated using atomic form factors,
23Debye-Waller factors,
24and absorption coefficients
25obtained from the literature. The calculations were performed using our own codes based on those in the literature.
26,27III. RESULTS
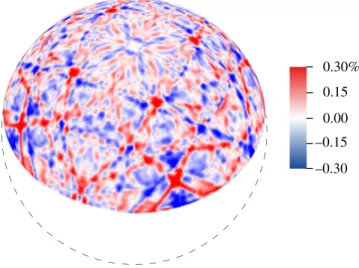
Figure 1 shows the Zn Ka hologram measured at an incident x-ray energy of 9.8 keV. The sharp lines observed in the pattern are the XSW lines, which indicate the high crystallinity of the ZnSnAs
2film. From the fifteen Zn Ka holograms with different incident x-ray energies, we reconstructed real-space images around Zn using Barton’s multiple-energy holography algorithm.
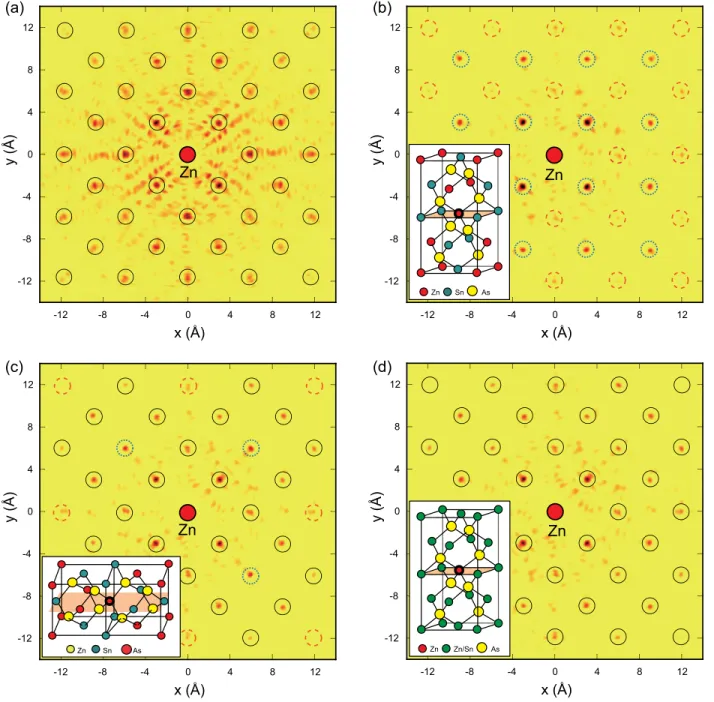
28Figure 2(a) shows the resultant atomic images on the (001) plane at z ¼ 0.0 A ˚ . All the atomic images displayed here are of the cation atoms of Zn and Sn. The atomic images at all the sites in this plane can be clearly observed, and the intensity appears to monotonically decrease with increasing distance from the center.
FIG. 1. X-ray fluorescence hologram of ZnSnAs
2thin film measured at 9.8 keV.
125703-2 Hayashiet al. J. Appl. Phys.119, 125703 (2016)
ZnSnAs
2film films fabricated by MBE had believed to form chalcopyrite structure. To determine the major structure of the ZnSnAs
2film, we calculated holograms using the structure models of chalcopyrite and sphalerite. Differently from XRD, long range-periodicity is not necessary for XFH.
XFH can analyze locally ordered chalcopyrite structure, as well. To check out any possibilities of chalcopyrite structure, we modeled c-axis and a-axis models for the hologram cal- culations, as shown in the insets in Figs. 2(b) and 2(c). In addition to these, holograms of the sphalerite structure model were calculated as a last possibility. Figure 2(b) shows the atomic image on the (001) plane at z ¼ 0.0 A ˚ reconstructed from theoretical holograms of the c-axis-oriented chalcopy- rite structure. The atomic arrangement of this model is displayed in the inset. Note that for this theoretical image,
we considered four different orientations of the clusters with the c-axis parallel to the [100], [ 100], [010], and [0 10] direc- tions of the InP substrate, but the atoms on this plane are identical in these clusters. As can be clearly seen in the figure, the atomic images indicated by the dotted circles are much stronger than those shown by the dashed circles, because the former and latter images correspond to the Sn and Zn atoms, respectively, and the x-ray scattering cross section of Sn is much larger than that of Zn.
Figure 2(c) shows the atomic image on the (001) plane at z ¼ 0.0 A ˚ reconstructed from theoretical holograms of the a-axis-oriented chalcopyrite structure model. As mentioned above, there are four different orientations of the a-axis in the chalcopyrite model cluster. The image is reconstructed from the average of the holograms of four different clusters
FIG. 2. Atomic images on the (001) plane at
z¼0.0 A ˚ around the central Zn atom obtained from (a) experimental holograms and theoretical holograms using the models of (b)
c-axis- and (c)a-axis-oriented chalcopyrite, and (d) sphalerite structures. The insets are the structure models used for the hologram calcula-tions. The solid circles in (a) indicate ideal cation positions. The dotted and dashed circles in (b) and (c) indicate the positions of Sn and Zn atoms, respectively.
The solid circles in (c) and (d) indicate the overlapping positions of Zn and Sn atoms.
with the c-axis parallel to the [100], [ 100], [010], and [0 10]
directions. In contrast to Fig. 2(b), the atomic images indi- cated by solid circles thus correspond to the averaged images of the Sn and Zn atoms.
Figure 2(d) shows the atomic images on the (001) plane at z ¼ 0.0 A ˚ obtained from the sphalerite structure model. All the atomic images of the sphalerite structure model are attributed to the average of Sn and Zn images. The differen- ces between Figs. 2(c) and 2(d) appear only for the distant atoms, where the compositions of the cation elements are different. In the a-oriented chalcopyrite model in Fig. 2(c), the second atoms in the diagonal directions at a length of 8.275 A ˚ are always Sn atoms, and the second atoms in the horizontal and vertical directions at 11.702 A ˚ are always the Zn atoms, while those in the sphalerite structure model are always the averaged values of the Sn and Zn atoms.
IV. DISCUSSION
A. Structural determination of ZnSnAs
2thin film To determine the structure of the ZnSnAs
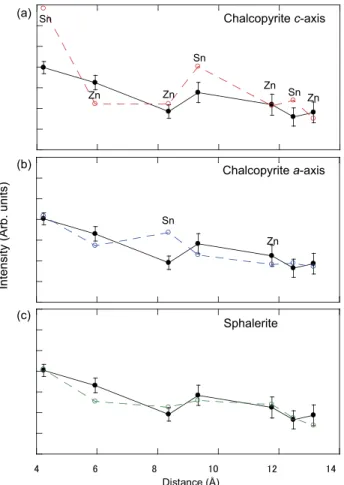
2thin film, we plot in Fig. 3 the intensities of the experimental images (solid lines) and calculated images (dashed lines) from the (a) c- and (b) a-oriented chalcopyrite structure models and (c) the sphalerite structure model as a function of the distance from the central Zn atom.
In Fig. 3(a), large discrepancies can be observed between the image intensities in the experiment and the c-oriented chalcopyrite model at every neighboring atom, as mentioned above for the comparison between Figs. 2(a) and 2(b). In the c-oriented chalcopyrite model, the first- (4.137 A ˚ ), fourth- (9.251 A ˚ ), and sixth- (12.412 A˚) neighboring atoms on this plane are composed of only Sn atoms having a larger x-ray scattering cross section than Zn atoms, where the theoretical values considerably exceed the experimental data. On the other hand, the second- (5.851 A ˚ ), third- (8.275 A˚), fifth- (11.702 A ˚ ), and seventh- (13.083 A˚) neighboring atoms on this plane are composed of only Zn atoms, where the theoreti- cal image intensities are slightly lower or similar to the exper- imental values. Thus, the c-oriented chalcopyrite model is not a suitable structure for the present ZnSnAs
2thin film.
In Fig. 3(b), the coincidence between the image inten- sities in the experiment and the a-oriented chalcopyrite model is much improved. However, a positive discrepancy is realized at the third-neighboring atomic images on this plane, which are solely composed of the Sn atoms in the a-oriented chalcopyrite model clusters.
The result for the sphalerite model cluster is shown in Fig. 3(c), where the coincidence between the experimental and theoretical image intensities is excellent. Compared with the calculated intensity variations using the two chalcopyrite structure models, the result using the sphalerite crystal struc- ture model is more similar to the experimental result.
Therefore, we can conclude that the dominant structure in the ZnSnAs
2thin-film sample is of the sphalerite type, and that the crystal structure of ZnSnAs
2in the thin-film form is different from that in the bulk form.
19Since there appear to be small differences between the sphalerite and a-oriented chalcopyrite models, it would be useful to examine the fraction of the chalcopyrite structures in the ZnSnAs
2thin film in detail. Figure 4 shows the sum of the squared residuals of the model intensities obtained with the c- (full circles) and a-oriented (empty circles)
FIG. 3. Intensities of the atomic images as a function of the distance from the center in (a)
c-axis-oriented chalcopyrite, (b)a-axis-oriented chalcopy-rite, and (c) sphalerite structures. Solid and dashed lines indicate the experi- mental and calculated data, respectively.
FIG. 4. Sum of squared residuals between the experimental and model image intensities as a function of the chalcopyrite fraction. The results for the
c- and a-oriented chalcopyrite models are given by full and emptycircles, respectively.
125703-4 Hayashiet al. J. Appl. Phys.119, 125703 (2016)
chalcopyrite models with respect to the experimental image intensities as a function of the fraction of the chalcopyrite structure. Note that the calculations were performed in steps of 5% and that the errors are within the size of the marks. As can be clearly seen in the figure, the sum of the squared residuals monotonically decreases with decreasing fraction of either the c- or a-oriented chalcopyrite structures. It is thus concluded that the crystal structure of the ZnSnAs
2thin film is mainly of the sphalerite type within an error of 5%.
B. Positional fluctuations of As atoms in sphalerite structure
Since the sample mostly has the sphalerite structure, we can extend the hologram from a limited h range to the 4p full angle range using the fourfold rotational and mirror sym- metries of the sphalerite crystal structure. An example of the fully symmetrized result at an incident x-ray energy of 9.8 keV is given in Fig. 5.
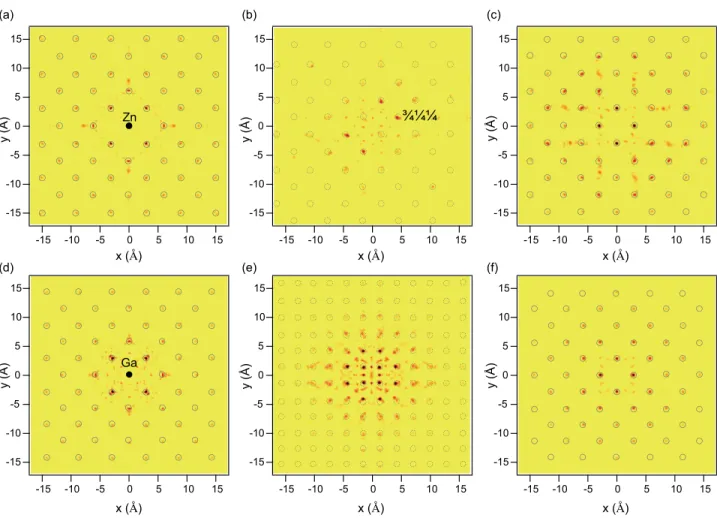
The obtained 4p holograms greatly improve the spatial resolution of the images, making it possible to more quanti- tatively discuss the atomic images. Figures 6(a)–6(c) show reconstructed images at z ¼ 0.0, 1.46, and 2.92 A ˚ , respec- tively. All the images at z ¼ 0.0 A ˚ in Fig. 6(a) correspond to the average of the Zn and Sn cation images, which are clearly observed up to the edges of the figure. In contrast, the images of As at z ¼ 1.46 A ˚ in Fig. 6(b) are very weak except for the As image at (3/4, 1/4, 1/4) and its equivalents. The cation images at z ¼ 2.92 A ˚ in Fig. 6(c) are again clearly visible.
The intensity of an atomic image is basically propor- tional to the atomic number and inversely proportional to the distance from the origin. Since the atomic number of As (33) is 82.5% of the average of the atomic numbers of Zn (30) and Sn (50), the atomic number does not cause a significant decrease in the As image intensity. In addition to the above factors, the image intensity decreases with the positional fluctuations of atoms.
2Therefore, it can be inferred that the main reason for the decrease in the As image intensity should be the large positional fluctuations of the As atom sites with
respect to the central Zn atom. If this is the case, it is surpris- ing that the As atoms are more positionally disordered than the cations even though the cation sites are randomly occu- pied by Zn or Sn atoms.
To quantitatively analyze the extent of the fluctuations of the As and Zn/Sn in the ZnSnAs
2film, we fabricated a GaAs thin film (500 nm) on a Ge substrate as a reference sample and measured the Ga Ka holograms. Principally, a mean square displacement of atom is determined by the intensity reduction due to the fluctuation of atom. This reduction rate is indirectly obtained by comparing with a standard sample whose mean square displacements of the atoms were already estimated by other methods, as discussed below. Figures 6(d)–6(f) show the atomic images at z ¼ 0.0, 1.41, and 2.82 A ˚ , respectively. The images of Ga atoms appear at z ¼ 0.0 and 2.82 A ˚ , and those of As atoms appear at 1.41 A˚. Since Ge sub- strate does not have cation and anion layers, during epitaxial growth both the Ga and As layers do not stack selectively on two kinds of crystallographic Ge layers, unlike the case of ZnSnAs
2/InP. Therefore, the As images of the GaAs film ex- hibit two zinc-blende-type atomic arrangements with different orientations. We assumed that the occupancy of the As atom at each site is random, and thus we doubled the As image intensities in Fig. 6(e) to enable a fair comparison. In Figs.
6(d)–6(f), the As images are clearly visible as well as the Ga images, in contrast to the As images in the ZnSnAs
2film shown in Fig. 6(b). This result confirms the higher degree of positional disorder of the As atoms in the ZnSnAs
2film.
Using the reconstructed atomic images of the ZnSnAs
2and reference GaAs thin films shown in Fig. 6, the image intensities are plotted as a function of the distance from the central Zn or Ga atom in Fig. 7. All the intensities are normalized to the atomic numbers of the elements of the neighboring atoms and then to the highest intensity of the first-neighboring As images of GaAs. These data were fitted by the simple formula a
1=d, where d is the distance from the central Zn or Ga atom and a
1is a fitting parameter, giving the positional stabilities of the atoms. Since some correla- tions are observed for near-neighboring atoms, particularly for the As images at (3/4, 1/4, 1/4), the fitting was carried out in the distance range of 5–16 A ˚ .
The obtained a
1values for Ga (GaAs), As (GaAs), Zn/Sn (ZnSnAs
2), and As (ZnSnAs
2) are 2.52, 2.92, 1.58, and 1.09, respectively. From these values, we estimated the atomic positional fluctuation, i.e., the mean square displace- ment of the neighboring scatterer atom relative to the central emitter atom, r. The r dependence of the image intensity was calculated using the multiple-energy hologram of a sim- ple dimer model,
8and the results are given in Fig. 8.
The r values of Ga and As in GaAs were reported to be 0.089 and 0.078 A ˚ , respectively.
29In XFH, the atomic fluctu- ations are regarded as the relative displacements from the central atom emitting fluorescent x-rays. Thus, the two values of r for the emitting and scatterer atoms should be convoluted to discuss the image intensities. The convoluted value for the Ga pair, r
GaGa, is 0.125 A ˚ and that for Ga and As, r
GaAs, is 0.117 A ˚ . These values are plotted in Fig. 8, and the intensities of 0.73 and 0.70 were obtained for r
GaGaand r
GaAs, respectively. These intensity values correspond
FIG. 5. Fully symmetrized x-ray fluorescence hologram of ZnSnAs
2thin
film measured at 9.8 keV.
to a
1¼ 2.52 and 2.92 for Ga and As in GaAs, respectively.
Thus, it is clarified that the larger a
1value for the As images originates from the smaller fluctuation of As atoms in GaAs.
To quantitatively estimate the atomic fluctuations in the ZnSnAs
2thin film, we define the average of r
GaGaand
r
GaAs, 0.121 A ˚ for GaAs, as the standard r value. This r value corresponds to a normalized intensity of 0.715, the av- erage of 0.73 for Ga-Ga and 0.70 for Ga-As, as indicated by the dashed line in Fig. 8. The averaged a
1value (2.72) of
FIG. 6. Atomic images on the (001) planes around Zn or Ga obtained from the 4p holograms. The images in (a)–(c) are of the ZnSnAs
2film and those in (d)–(f) are of the reference GaAs film. (a)
z¼0.0 A ˚ , (b)
z¼1.46 A ˚ , (c)
z¼2.92 A ˚ , (d)
z¼0.0 A ˚ , (e)
z¼1.41 A ˚ , and (f)
z¼2.82 A ˚ . The intensities of the As images in (e) are doubled. The circles in each images indicate ideal positions of atoms.
FIG. 7. Intensities of the atomic images as a function of the distance from the origin. The open and filled squares indicate the intensities of Zn/Sn and As images in ZnSnAs
2, respectively. The dotted and dotted-dashed lines indicate the fitting curves for the Zn/Sn and As images, respectively. The open and filled circles indicate the intensities of the Ga and As images in GaAs, respectively. The dashed and solid lines indicate the fitting curves for the Ga and As images, respectively. All intensities are normalized to the atomic numbers of the elements.
FIG. 8.
rdependence of image intensity on the atomic fluctuation. The inten- sity is normalized to its highest value at
r¼0 A ˚ . Open and filled circles indicate the Ga and As image intensities in GaAs, respectively. Open and filled squares indicate the (Zn, Sn) and As image intensities in ZnSnAs
2, respectively.
125703-6 Hayashiet al. J. Appl. Phys.119, 125703 (2016)
Ga-Ga (2.52) and Ga-As (2.92) corresponds to the normal- ized image intensity of 0.715 on the line in Fig. 8.
By calculating the ratios of the a
1values for the ZnSnAs
2crystal to the reference value of 2.72 for GaAs, we can quantitatively obtain the fluctuations of Zn/Sn and As.
The ratios of a
1¼ 1.58 for Zn/Sn and 1.09 for As in ZnSnAs
2to the averaged value of 2.72 for GaAs are 0.58 and 0.40, respectively. By taking the reduction factor of 0.72 into account, the normalized intensities are calculated to be 0.41 for Zn/Sn and 0.29 for As around the central Zn atom.
From Fig. 8, the r values are consequently estimated to be 0.207 A ˚ for r
ZnZn=Snand 0.255 A ˚ for r
ZnAs.
These r values are much larger than the reference value of r
GaGa=As¼ 0:121 A ˚ for GaAs. This can be easily under- stood from the large value of r
ZnZn=Sn¼ 0:207 A ˚ because the Zn and Sn atoms occupy the same atomic sites with dif- ferent atomic radii similar to mixed crystals such as In
1xGa
xSb (Ref. 2) and Zn
1xMn
xTe (Ref. 8) for which large positional fluctuations have been observed in the mixed sites by XFH. However, it is interesting that a much larger r
ZnAsvalue is observed for the Zn-As correlation even though the anion sites are occupied by only a single As element.
To evaluate r values for the neighboring Zn/Sn and As, it is expedient to assume that the r value for the central Zn atom in ZnSnAs
2equals that for the central Ga atom in GaAs of 0.089 A ˚ . Balzarotti et al. and Jeong et al. also treated the atomic fluctuations of different cations as same in their analyses of zinc-blend type mixed crystals.
31,32Using this assumption, r
Zn=Sn¼ 0.146 A ˚ and r
As¼ 0.209 A ˚ are obtained by the deconvolutions of r
Zn–Zn=Snand r
ZnAs, respectively. The r
Asvalue of an anion site is 43% larger than the r
Zn=Snvalue of a cation site with a mixture of Zn and Sn.
C. Comparison with existing models
To understand the structural features obtained by the present XFH experiment and the analysis of the ZnSnAs
2thin film, it is useful to compare the results with the existing structural models for mixed crystals. Balzarotti et al. meas- ured the XAFS on mixed crystals of the diluted magnetic semiconductor Cd
1xMn
xTe having a zinc-blende crystal structure and obtained the bimodal distribution of the nearest-neighbor distances of Cd-Te and Mn-Te.
30,31To rec- oncile this XAFS result with diffraction data exhibiting Vegard’s rule of proportional changes in nearest-neighbor distance with the cation ratio, they proposed a model named Balzarotti’s model in which the anion atoms are displaced from the ideal crystallographic positions by a large number, whereas the cation sublattice remains undistorted even in a mixture of Cd and Mn atoms with different atomic radii.
This model appears to be reasonable for the present ZnSnAs
2thin film.
Jeong et al. measured the high-energy XD on the semi- conductor In
xGa
1xAs and obtained atomic pair distribution functions (PDFs) with a high real-space resolution and the bimodal distribution of the nearest-neighbor distances.
32Combining this structural information with a theoretical
calculation using the Kirkwood potential, they evaluated the local atomic displacements and found that the value of r for the static disorder of the cation sublattice is 60% smaller than that for the static disorder of the anion sublattice.
Therefore, Balzarotti’s structural model of atomic spatial fluctuations appears to match our present XFH results for the ZnSnAs
2thin film.
We previously proposed a different model to explain the XFH result for a mixed crystal of Zn
0.4Mn
0.6Te.
8This model is the so-called locomotive wheel model, where the average positions of the atoms coincide with the corresponding lat- tice positions obtained by the XD experiment, while the actual atoms are located on spheres with certain diameters centered at the lattice positions to agree with the XAFS data.
In the case of Zn
0.4Mn
0.6Te, the diameters of the cation and anion are the same in the model, i.e., the positional fluctua- tions are the same for the cation and anion. The model per- fectly reproduces the XD and XAFS data as shown in Fig. 8 of Ref. 8 and would explain the atomic image intensities obtained from the XFH measurement.
In the ZnSnAs
2thin film, on the other hand, the posi- tional fluctuations in the As sublattice are more prominent than those in the Zn/Sn cation sublattice, although larger fluctuations are expected in the cation sublattice owing to the different atomic sizes of the Zn and Sn atoms. Thus, it can be concluded that the diameters of the spheres should be reconsidered for the locomotive wheel model to adopt it as a structural model for the ZnSnAs
2thin film.
D. Features and roles of distorted As sublattice
Finally, we discuss the correlations between the central Zn and neighboring As atoms. Figures 9(a) and 9(b), respec- tively, show the real-space images of the As layers at z ¼ 1.46 and 4.38 A ˚ . In these planes, strong As images can be seen as indicated by arrows. These images appear within a radius of 7 A ˚ . However, the first-neighboring and distant (beyond 7 A ˚ ) As images are very weak. The former observa- tion has been reported for several mixed crystals, while the latter observation is unusual.
2,8To discuss this unique feature, the number of chemical bonds between the central Zn and neighboring As atoms is counted. The solid and dashed arrows in Figs. 9(a) and 9(b) indicate the surrounding As atoms with three and five chemi- cal bonds from the central Zn atom, respectively. As can be clearly seen in the figures, the strong atomic images corre- spond to the As atoms with three and five chemical bonds from the central Zn atom, regardless of the interatomic length. Thus, it is concluded that the positional fluctuations of the As atoms are not randomly spread over the ZnSnAs
2crystal, and that some structural ordering exists with respect to the Zn atoms.
This structural feature of the As layer suggests that the
As layer plays an important role as a buffer to self-optimize
the structure of this mixed crystal. Namely, the positional
disordering in the As layer is expected to be important for
maintaining the crystal structure, because the As layer
relaxes the strain caused by the random occupation of Zn
and Sn atoms with different atomic sizes.
Considering the ZnSnAs
2thin film as a host material for magnetic doping, the buffer-like layers should play a very important role in achieving a Mn doping level as high as 10%.
33In the case of GaMnAs, the ferromagnetic nature appears upon the substitution of Mn impurities for Ga atoms.
The Curie temperature T
Cincreases with the Mn concentra- tion, reaches a maximum of 110 K approximately 6% Mn concentration, and then decreases with the further increase of Mn concentration.
34Recent experimental investigations of these ferromag- netic semiconductors have revealed that the T
Cvalue was enhanced to 191 K after the postgrowth annealing of GaMnAs with nominally 20% Mn concentration, which was attributed to the out-diffusion of magnetically inactive inter- stitial Mn impurities toward the free epilayer surface during annealing.
35On the other hand, detailed theoretical and experimental studies
36have revealed that although the T
Ccan be increased up to 173 K,
37only 6.8% of the Mn atoms can be substituted for Ga sites. Subsequently, doped Mn atoms preferentially occupy interstitial sites, which limit the attainable T
Cvalue. The rigid configuration of the host GaAs lattice may introduce large lattice distortions around Mn atoms having different bond lengths with As, resulting in the loss of the asymmetry of local configurations and the even- tual displacement of impurity atoms from substitutional sites.
In the case of Cd
1xMn
xTe, Balzarotti et al. reported that when the addition of Mn into CdTe increases the ionicity of the bond, the local distributions of the tetrahedral stabilize the zinc-blend type structure up to x ¼ 0.7 on the basis of their model.
31On the other hand, the As sites in the ZnSnAs
2thin film are highly flexible in terms of their positions, as found in the present XFH study. Compared with GaAs, ZnSnAs
2is expected to accommodate a higher Mn doping level while maintaining an undistorted MnAs
4tetrahedral symmetry in the sphalerite structure.
38Moreover, the random distribution
of the Zn/Sn cations in the sphalerite form may be stabilized by the fluctuation of the As sublattice layers inside the cubic structure, in contrast to the ordered chalcopyrite form, which is stable under thermal equilibrium.
Under such conditions, the buffer-like As layers in the sphalerite ZnSnAs
2thin film may allow a higher magnetic Mn doping level and suppress the formation of magnetic sec- ondary phases such as a NiAs-type hexagonal structure with sixfold coordination around the Mn atoms. Although this explanation requires further investigation in the future, we believe that the sphalerite ZnSnAs
2thin film is highly advan- tageous for synthesizing ferromagnetic semiconductors with high T
Cabove room temperature.
In the present study, we have determined the fundamen- tal structural information of a ZnSnAs
2thin film. As our next task, we will carry out an XFH experiment on a Mn-doped ZnSnAs
2thin film. We expect to obtain valuable knowledge on its relatively high Curie temperature by studying the local structure around Mn, particularly the correlations between Mn and other constituent elements.
V. CONCLUSIONS
We applied XFH to characterize the crystal structure and lattice distortions in a ZnSnAs
2thin film. The analysis of atomic images revealed that the measured ZnSnAs
2thin film mostly has a sphalerite structure and exhibits significantly larger positional disordering in the As layers than in the cati- onic layers, even though the Zn and Sn atoms randomly occupy the cation sites in the sphalerite structure. This struc- tural feature of the As layers allows it to act as a buffer to self-optimize this mixed crystal. Namely, the As layers are important for maintaining the crystal structure because they relax the strains caused by the random occupation of the Zn and Sn atoms. This newly revealed structural feature may be very useful for understanding the lattice distortions when additional Mn dopants are added to a ZnSnAs
2thin film to
FIG. 9. Strong correlations between Zn and As. (a) and (b) show the images of As layers at
z¼1.46 and 4.38 A ˚ , respectively, and (c) sphalerite structure of ZnSnAs
2. Solid and dashed arrows indicate strongly correlated As atoms with three and five chemical bonds from the central Zn atom, respectively.
125703-8 Hayashiet al. J. Appl. Phys.119, 125703 (2016)
induce a ferromagnetic nature at room temperature, at which the ferromagnetic properties are very sensitive to the local coordinations around the magnetic atoms.
ACKNOWLEDGMENTS
The authors thank Professor S. Sasaki and Dr. M. Okube of Tokyo Institute of Technology for the support of the XFH experiments. The XFH experiments were performed at BL6C of PF-KEK (Proposal Nos. 2011G530 and 2013G605). This work was supported by the Japan Society for the Promotion of Science (JSPS) with a Grant-in-Aid for Scientific Research on Innovative Areas “3D Active-Site Science” (Grant No. 26105006) and a Grant-in-Aid for Scientific Research (Grant No. 25286040).
1
K. Hayashi, N. Happo, S. Hosokawa, W. Hu, and T. Matsushita, J. Phys.:
Condens. Matter
24, 093201 (2012).2
S. Hosokawa, N. Happo, T. Ozaki, H. Ikemoto, T. Shishido, and K.
Hayashi, Phys. Rev. B
87, 094104 (2013).3
A pioneering work on Ge impurities in Si was described in K. Hayashi, Y.
Takahashi, I. Yonenaga, and E. Matsubara, Mater. Trans.
45, 1994 (2004).4
S. Hosokawa, N. Happo, S. Senba, T. Ozaki, T. Matsushita, A. Koura, F.
Shimojo, and K. Hayashi, J. Phys. Soc. Jpn.
83, 124602 (2014).5
W. Hu, K. Hayashi, T. Yamamoto, N. Happo, S. Hosokawa, T. Terai, T.
Fukuda, T. Kakeshita, H. Xie, T. Xiao, and M. Suzuki, Phys. Rev. B
80,060202(R) (2009).
6
W. Hu, K. Hayashi, T. Fukumura, K. Akagi, M. Tsukada, N. Happo, S.
Hosokawa, K. Ohwada, M. Takahasi, M. Suzuki, and M. Kawasaki, Appl.
Phys. Lett.
106, 222403 (2015).7
N. Happo, K. Hayashi, S. Senba, H. Sato, M. Suzuki, and S. Hosokawa, J. Phys. Soc. Jpn.
83, 113601 (2014).8
S. Hosokawa, N. Happo, and K. Hayashi, Phys. Rev. B
80, 134123 (2009).9
W. Hu, K. Hayashi, K. Ohwada, J. Chen, N. Happo, S. Hosokawa, M.
Takahasi, A. A. Bokov, and Z.-G. Ye, Phys. Rev. B
89, 140103(R) (2014).10
A. S. Borshchevskii, A. A. Vaipolin, N. A. Goryunova, and G. V.
Loshakova, Inorg. Mater.
4, 772 (1968).11
N. A. Goryunova, I. I. Kozhina, G. V. Loshakova, and A. S.
Borshchevskii, Vestn. Leningr. Univ., Ser. 4: Fiz., Khim.
22, 159 (1967).12
M. A. Ryan, M. W. Peterson, D. L. Williamson, J. S. Frey, G. E. Maciel, and B. A. Parkinson, J. Mater. Res.
2, 528 (1987).13
P. St-Jean, G. A. Seryogin, and S. Francoeur, Appl. Phys. Lett.
96, 231913(2010).
14
G. A. Seryogin, S. A. Nikishin, H. Temkin, A. M. Mintairov, J. L. Merz, and M. Holtz, Appl. Phys. Lett.
74, 2128 (1999).15
S. Francoeur, G. A. Seryogin, S. A. Nikishin, and H. Temkin, Appl. Phys.
Lett.
74, 3678 (1999).16
G. A. Seryogin, S. A. Nikishin, H. Temkin, R. Schlaf, L. I. Sharp, Y. C.
Wen, B. Parkinson, V. A. Elyukhin, Yu. A. Kudriavtsev, A. M. Mintairov, N. N. Faleev, and M. V. Baidakova, J. Vac. Sci. Technol., B
16, 1456(1998).
17
J. L. Shay and J. H. Wernick,
Ternary Chalcopyrite Semiconductors:Growth, Electronic Properties and Application
(Pergamon Press, New York, 1975).
18
V. O. G. Folberth and H. Pfister, Acta Crystallogr.
13, 199 (1960).19
S. Choi, G.-B. Cha, S. C. Hong, S. Cho, Y. Kim, J. B. Ketterson, S.-Y.
Jeong, and G.-C. Yi, Solid State Commun.
122, 165 (2002).20
J. T. Asubar, A. Kato, T. Kambayashi, S. Nakamura, Y. Jinbo, and N.
Uchitomi, J. Cryst. Growth
301–302, 656 (2007).21
J. T. Asubar, Y. Jinbo, and N. Uchitomi, J. Cryst. Growth
311, 929 (2009).22
E. Yu Tonkov,
High Pressure Phase Transformations Handbook 1(Gordon and Breach Science Publishers, Philadelphia, 1992), p. 71.
23International Tables for Crystallography, edited by A. J. C. Wilson and V.
Geist (Kluwer, Dordrecht, 1992), Vol. C.
24
C. Kittel,
Introduction to Solid State Physics, 7th ed. (Wiley, New York,1996), p. 126.
25
S. Sasaki, KEK Report No. 90-16, National Laboratory for High Energy Physics, Tsukuba, 1991, p. 1.
26
P. M. Len, S. Thevuthasan, C. S. Fadley, A. P. Kaduwela, and M. A. Van Hove, Phys. Rev. B
50, 11275 (1994).27
P. M. Len, Ph.D. thesis, University of California-Davis, June 1997, see http://www.icts.hkbu.edu.hk/surfstrucinfo/SurfStrucInfo_files/holo/
holopack.html.
28
J. J. Barton, Phys. Rev. Lett.
67, 3106 (1991).29
A. W. Stevenson, Acta Crystallogr., Sect. A: Found. Adv.
50, 621 (1994).30
A. Balzarotti, M. Czy_ znyk, A. Kisiel, N. Motta, M. Podg orny, and M.
Zimnal-Starnawska, Phys. Rev. B
30, 2295 (1984).31
A. Balzarotti, N. Motta, A. Kisiel, M. Zimnal-Starnawska, M. T. Czy_ znyk, and M. Podg orny, Phys. Rev. B
31, 7526 (1985).32
I.-K. Jeong, F. Mohiuddin-Jacobs, V. Petkov, S. J. L. Billinge, and S.
Kycia, Phys. Rev. B
63, 205202 (2001).33
N. Uchitomi, H. Endo, H. Oomae, and Y. Jinbo, Thin Solid Films
519,8207 (2011).
34
H. Ohno, Science
281, 951 (1998).35
L. Chen, S. Yan, P. F. Xu, J. Lu, W. Z. Wang, J. J. Deng, X. Qian, Y. Ji, and J. H. Zhao, Appl. Phys. Lett.
95, 182505 (2009).36
T. Jungwirth, K. Y. Wang, J. Ma sek, K. W. Edmonds, J. K€ onig, J. Sinova, M. Polini, N. A. Goncharuk, A. H. MacDonald, M. Sawicki, A. W.
Rushforth, R. P. Campion, L. X. Zhao, C. T. Foxon, and B. L. Gallagher, Phys. Rev. B
72, 165204 (2005).37
K. Wang, R. Campion, K. Edmonds, M. Sawicki, T. Dietl, C. Foxon, and B. Gallagher, AIP Conf. Proc.
772, 333 (2005).38
N. Uchitomi, H. Inoue, T. Kato, H. Toyota, and H. Uchida, J. Appl. Phys.
117, 17B905 (2015).