Substoichiometric isotope dilution mass
spectrometry of boron based on the ion‑pair extraction with salicyl alcohol derivatives and organic cations
著者 Morita Keisuke
雑誌名 金沢大学大学院自然科学研究科博士学位論文,
126p.
号 2011
ページ 1‑126
発行年 2012‑03‑22
URL http://hdl.handle.net/2297/34904
Dissertation
Substoichiometric isotope dilution mass spectrometry of boron based on the ion-pair extraction with salicyl alcohol
derivatives and organic cations
Graduate School of Natural Science and Technology Kanazawa University
Major subject: Division of Material Sciences Course: Material Information Analysis
School registration No.: 0923132306 Name: Keisuke Morita
Chief advisor: Prof. Hisanori Imura
Abstract
Salicyl alcohol derivatives, 5-bromosalicyl alcohol (H
2Brsal),
3,5-dibromosalicyl alcohol (H
2Br
2sal), and 3,5-diiodosalicyl alcohol
(H
2I
2sal), were synthesized as a novel ligand for the extraction of boric
acid. Boric acid is extracted with H
2X
nsal and organic cations such as
trioctylmethylammonium and tetraphenylphosphonium. The distribution
constant (K
D) and the acid-dissociation constant (K
a) of the ligands, and the
formation constant of hydrogen-bonded complexes of each H
2X
nsal with
trioctylmethylammonium chloride (TOMACl) in the organic phase were
determined. The effect of solvents and organic cations on the extraction of
boric acid with salicyl alcohol (H
2sal) was investigated. The solvents
having higher polarity such as o-dichlorobenzene and chlorobenzene and
the organic cations having higher hydrophobicity such as TOMACl gave
higher extractability. The extraction equilibrium of boric acid with H
2X
nsal
and TOMACl was studied in chlorobenzene. The composition of the
extracted species was confirmed to be TOMA∙B(X
nsal)
2by the slope
analysis, the mole-ratio method, and the negative electrospray
ionization-mass spectrometry. The highest extraction constant (K
ex) was
obtained with H
2I
2sal and TOMACl. The substoichiometric extraction
curves were computed from the K
exvalues, so the system with an excess
amount of H
2I
2sal and a substoichiometric amount of TOMACl was most
suitable. This substoichiometric extraction system was used for the
substoichiometric isotope dilution mass spectrometry and applied to a
reference material (high-analysis compound fertilizer). The value
determined was in good agreement with the certified value. This method is
useful for the rapid and reliable quantification of boron without any
calibration standards.
Chapter 1
Boron is a useful element in various fields, however, excess boron is toxic for not only plant but also mankind and wildlife. Generally, determination methods of trace boron are based on the comparative method using calibration curves. Recently, isotope dilution mass spectrometry has been applied to the determination of boron. Since two boron isotopes,
10B and
11B, are easily fractionated, their isotopic abundance in particular sample has to be accurately determined prior to the quantification of boron.
Therefore, absolute but simple quantification method for boron without any standards is necessary as a routine primary method.
The solvent extraction technique using diol compounds has been studied as the separation method of boric acid, but the extraction equilibrium and the extraction constant were not clarified.
In this study, the extraction equilibrium of boric acid with a series of salicyl alcohols and organic cations is studied and applied to the development of substoichiometric isotope dilution mass spectrometry for trace boron.
Chapter 2
Novel salicyl alcohol derivatives, 5-bromosalicyl alcohol (H
2Brsal), 3,5-dibromosalicyl alcohol (H
2Br
2sal), and 3,5-diiodosalicyl alcohol (H
2I
2sal), were synthesized. Their acid-dissociation constants (K
a) and distribution constants (K
D) were increased in the following order; salicyl alcohol (H
2sal) < H
2Brsal < H
2Br
2sal ≤ H
2I
2sal for K
aand H
2sal < H
2Brsal
< H
2Br
2sal < H
2I
2sal for K
D. These results can be explained by the electron
withdrawing and the hydrophobic effect of halogen groups. The association
of H
2X
nsal with TOMACl owing to the hydrogen bond was found. The composition of hydrogen-bonded complex was identified to be TOMACl∙2H
2X
nsal, and the association constant was determined.
Chapter 3
The extraction of boric acid with H
2X
nsal and various organic cations in several solvents was investigated. The solvents having higher polarity such as o-dichlorobenzene and chlorobenzene and the organic cations having higher hydrophobicity such as TOMACl gave higher extractability. The extraction equilibrium of boric acid with H
2X
nsal and TOMACl was studied in chlorobenzene. The composition of the extracted species was confirmed to be TOMA∙B(X
nsal)
2with each salicyl alcohol derivative by the slope analysis, a mole-ratio method, and the negative electrospray ionization-mass spectrometry. The extraction constant (K
ex) increases in the following order; H
2sal < H
2Brsal < H
2Br
2sal ≤ H
2I
2sal.
The halogenation of H
2sal leads to the increase in the K
a, K
D, and K
exvalues.
Chapter 4
The substoichiometric extraction systems with the salicyl alcohols
and TOMACl were evaluated using the K
exvalues. The system using an
excess amount of H
2I
2sal and a substoichiometric amount of TOMACl was
most suitable for the substoichiometric extraction of boron in low
concentration. The optimum pH range, reproducibility, and the effect of
foreign ions on the substoichiometric extraction of boric acid were studied
in detail. Metal ions such as Cu
2+and Mn
2+interfered in the
substoichiometric extraction, but these interference can be readily eliminated by EDTA as a masking agent. The present substoichiometric separation method was combined with the isotope dilution mass spectrometry and applied to the determination of boron in a reference material (high-analysis compound fertilizer). The value determined was in good agreement with the certified value.
Chapter 5
The proposed substoichiometric isotope dilution mass spectrometry
using an excess amount of H
2I
2sal and a substoichiometric amount of
TOMACl is useful in the rapid and reliable quantification of boron without
any calibration standards. This method is applicable to the sample
containing 8 nmol of B(OH)
3.
Contents
Chapter 1 Introduction 1
1.1 Boron 2
1.2 Determination method of boron 3
1.2.1 Spectrophotometry using methylene blue 3 1.2.2 Spectrophotometry using azomethine H 4 1.2.3 Inductively coupled plasma-optical emission
spectrometry 4
1.2.4 Inductively coupled plasma-mass spectrometry 4 1.3 Analytical quality assurance and management 4
1.3.1 Gravimetry 5
1.3.2 Titrimetry 6
1.3.3 Coulometry 6
1.3.4 Cryoscopy 6
1.3.5 Isotope dilution analysis 6
1.4 Substoichiometric isotope dilution mass spectrometry 8
1.5 Solvent extraction of boric acid 13
1.6 The aim of study 14
Chapter 2 Synthesis and liquid-liquid distribution properties of
salicyl alcohol derivatives 16
2.1 Introduction 17
2.2 Experimental 17
2.2.1 Reagents 18
2.2.2 Apparatus 18
2.2.3 Synthesis of 5-bromosalicyl alcohol 19
2.2.4 Synthesis of 3,5-dibromosalicyl alcohol 19
2.2.5 Synthesis of 3,5-diiodosalicyl alcohol 21
2.2.6 Determination of acid-dissociation constant 21 2.2.7 Determination of distribution constant 22 2.2.8 Determination of association constant 22
2.3 Results and discussion 22
2.3.1 Acid-dissociation equilibrium of the salicyl alcohol
derivatives 23
2.3.2 Distribution of the salicyl alcohol derivatives 29 2.3.3 Association of salicyl alcohol derivatives with
quaternary ammonium salts 36
2.4 Conclusion 49
Chapter 3 The ion-pair extraction of boric acid with salicyl alcohol derivatives and organic cations 50
3.1 Introduction 51
3.2 Experimental 51
3.2.1 Reagents 51
3.2.2 Apparatus 52
3.2.3 Extraction procedure 52
3.3 Results and discussion 53
3.3.1 Extraction with salicyl alcohol and organic cations into
various solvents 53
3.3.1.1 Effect of organic cations and solvents 53
3.3.1.2 Extraction equilibrium 55
3.3.2 Extraction with salicyl alcohol derivatives and
trioctylmethylammonium chloride 65
3.3.2.1 Extraction behavior 66
3.3.2.2 Extraction equilibrium 66
3.4 Conclusion 79
Chapter 4 Substoichiometric isotope dilution determination of
boron using ICP-MS 82
4.1 Introduction 83
4.2 Experimental 83
4.2.1 Reagents 84
4.2.2 Apparatus 84
4.2.3 Procedure 84
4.2.3.1 Substoichiometric extraction 84
4.2.3.2 Leaching of boron from reference material 84 4.2.3.3 Substoichiometric isotope dilution determination of
boron 85
4.3 Results and discussion 85
4.3.1 Substoichiometric extraction with salicyl alcohol and
TOMACl 87
4.3.1.1 Optimum conditions 87
4.3.1.2 Reproducibility 89
4.3.1.3 Effect of diverse ions 89
4.3.1.4 Substoichiometric determination of boron in a synthetic
solution 93
4.3.2 Substoichiometric extraction with H
2I
2sal and TOMACl 93
4.3.2.1 Optimum conditions 93
4.3.2.2 Reproducibility 95
4.3.2.3 Effect of diverse ions 95
4.3.2.4 Substoichiometric determination in fertilizer 99
4.4 Conclusion 99
Chapter 5 Conclusion 104
107
Abbreviation and Compound AcOH Acetic acid
CB Chlorobenzene
CF Trichloromethane DCB o-Dichlorobenzene DCE 1,2-Dichloroethane DCM Dichloromethane EtOH Ethanol
Hex Hexane
MeOH Methanol
MIBK 4-Methyl-2-pentanone THF Tetrahydrofuran
Tol Toluene
TOA Trioctylamine
Hex
4NBr Tetrahexylammonium bromide Oct
4NBr Tetraoctylammonium bromide TOMACl Trioctylmethylammonium chloride
CTMP 3-Chloro-5-(1,1,3,3-tetramethylbutyl)salicyl alcohol H
2sal Salicyl alcohol
H
2Brsal 5-Bromosalicyl alcohol
H
2Br
2sal 3,5-Dibromosalicyl alcohol
H
2I
2sal 3,5-Diiodosalicyl alcohol
OH
OH OH OH
Br
OH OH
Br
Br
OH OH
I
I
OH OH
Cl
H
2sal H
2Brsal H
2Br
2sal
H
2I
2sal CTMP
Chapter 1.
Introduction
1.1 Boron
Boron is widely used in various fields such as electronics, alloys, and organic synthesis. The estimated global consumption amount of boron rose to a record 1.8 million ton as B
2O
3in 2005 [1]. Boron has two stable isotopes
10B and
11B. Boron-10 has high neutron absorption cross section (σ
n= 3837 × 10
-24cm
2for
10B) [2]. Therefore,
10B is a very important isotope and is used in nuclear reactor and cancer treatment by boron neutron capture therapy. On the other hand,
11B is used in the radiation hardened semiconductor for spacecraft since
10B reacts with neutron produced by cosmic ray and damages semiconductor.
The isotopes of boron are easily fractionated by variety of natural and artificial processes. This phenomenon has been utilized to identification of the production area of crops and an indicator of past permafrost conditions [3-5]. In the Table of Standard Atomic Weights 2009, the standard atomic weight of boron is given as "[10.806; 10.821]" [6]. It indicates that atomic weight of boron in any normal material will be greater than 10.806 and will be less than 10.821. In other words, the abundance of boron isotopes is in the range from 0.18898 to 0.20493 for
10B and from 0.79597 to 0.81102 for
11B. Therefore, the isotopic abundance of boron in particular sample has to be accurately determined prior to the quantification of boron.
Boron is an essential trace element in plant, and a boron compound
related to the transportation of boric acid in plants is identified for the first
time in 2002 [7]. However, excess boron is toxic for not only plant but also
mankind and wildlife [8]. Therefore, the World Health Organization
recommends a boron level of 2.4 mg/l for drinking water [9]. The boron
concentration in waste water was regulated by the environmental regulation
in 2010 in Japan where the allowance levels of 10 mg/l and 230 mg/l as boron in a non-sea and a sea area respectively were established.
1.2 Determination method of boron
Various analytical methods such as acid-base titration, spectrophotometry [10-28], fluorimetry [29-37], flame optical emission spectrometry [38, 39], electrothermal atomic absorption spectrometry [40-42], inductively coupled plasma optical emission spectrometry [43, 44], inductively coupled plasma mass spectrometry [45-50], and neutron activation analysis [51, 52] have been used for the determination of boron.
In acid-base titration, boric acid is a very weak acid so that must be combined with a polyhydroxy compound such as glycerin and mannitol, prior to a titration assay. Once combined, it can be readily titrated with a strong base like sodium hydroxide. In general, spectrophotometry and fluorimetry are severely affected by the matrix of samples. Therefore, preseparation of boron from the sample matrix is carried out by the distillation of boric acid-methanol ester from concentrated sulfuric acid or the ion-pair extraction for anionic boron compounds, such as BF
4-and boric acid-diol complex with dye cations. The JIS K 0102 "Testing methods for industrial wastewater" provides the following four analytical methods for boron described in Section 1.2.1 to 1.2.4.
1.2.1 Spectrophotometry using methylene blue
Concentrated sulfuric acid and hydrofluoric acid were added to a
boron compound to form tetrafluoroborate. It was extracted into
1,2-dichloroethane as an ion-pair with methylene blue
(3,7-bis(dimethylamino)-5-phenothiazinium chloride), then determined from absorbance of the solution.
1.2.2 Spectrophotometry using azomethine H
To solution containing boric acid adjust to pH 6, azomethine H (8-hydroxy-1-(salicylideneamino)-3,6-naphthalenedisulfonic acid) was added, then determined from absorbance of the yellow complex.
1.2.3 Inductively coupled plasma-optical emission spectrometry
A sample was introduced into inductive coupling plasma, and the emission of boron at 249.733 nm was measured.
1.2.4 Inductively coupled plasma-mass spectrometry
An internal standard element was added to a sample and introduced into inductively coupled plasma. The intensity of each mass/charge of
10B or
11B and the internal standard were measured, and boron was determined by the internal standard method using the ratio of the intensity of boron to that of the internal standard.
1.3 Analytical quality assurance and management
The traceability in chemical measurements is the property that
measurement result has, and it connect to a known standard, national
measurement standard or international measurement standard generally, by
an unbroken chain of comparisons relating instrument measurements.
Recently, securing of international reliability of the determined value by the chemical analysis is a problem, therefore an analysis value connected to SI unit is required. The base unit of measurement in chemistry is mole. The analytical value of primary standard material is determined by the primary standard method, and the analytical value of secondary standard material is determined by a comparison with the analytical value of primary standard material. Similarly, the analytical value of working standard material used in practically is determined by a comparison with the analytical value of secondary standard material. In this way, the analytical value connects to SI unit through working standard, secondary standard, and primary standard material.
The primary standard method that Consultative Committee on amount of substance - Metrology in Chemistry (CCQM) of International Committee of Weights and Measures (CIPM) recommended is following five methods, gravimetry, titrimetry, coulometry, cryoscopy and isotope dilution analysis. These methods can be directly or indirectly quantitation of element in sample without any calibration standard. From the view of traceability, development of primary standard method is important.
1.3.1 Gravimetry
The element in question is separated as element or pure compound,
then quantitated by measuring its mass. This method needs time spending
and skill, and is direct and accuracy quantitation method. Titrimetry and the
instrumental measurement are based on a working standard exactly
prepared by this method.
1.3.2 Titrimetry
A standard solution reacting with an analyte is added to a sample by dropwise, and the analyte is quantitated by measuring the volume at the equivalence point. This method contains various titrations such as acid-base, calorimetric, chelatometric, coulometric, iodometric, Karl Fischer, redox, and precipitation. This method requires that the stoichiometry for reaction is clarified, subreaction is not occurring, the reaction rate is rapid, and the equilibrium constant is larger sufficiently.
1.3.3 Coulometry
The analyte reacted during electrolysis is quantitated by measurement of the electrolytic current based on Faraday's low. This method required 100 % of current efficiency or appearance current efficiency.
1.3.4 Cryoscopy
This method is based on the effect of impurity on the freezing point.
The total amount of impurities in the sample is quantitated by exactly measurement of the degree of freezing point depression, and the sample purity is determined by subtract impurities.
1.3.5 Isotope dilution analysis
The analyte labeled with a stable isotope (such as
2H,
13C,
15N,
18O
etc.) is added to a sample, after equilibration, amount of analyte in sample
is quantitated based on the change in isotopic abundance.
Amounts of the two isotopes of interest (ith and jth isotope), q
i,xand q
j,x, in M
xg of analyte (atomic weight A
x) are written by using abundance of ith and jth isotope, a
i,xand a
j,x, as follows,
x x , x x
, i
i a
A
q = M (1-1)
x x , x x
, j
j a
A
q = M . (1-2)
Similarly, the amounts of ith and jth isotope in the M
sg of labeled analyte (spike) (atomic weight A
s) are written as follows,
s s , s s
, i
i a
A
q = M (1-3)
s s , s s
, j
j a
A
q = M . (1-4)
After the analyte and spike are mixed, the total amount of analyte is given by (M
x+ M
s) g and the amount of ith and jth isotope, q
i,mand q
j,m, are written as follows,
s s , x s x , m x
, i i
i a
A a M
A
q = M + (1-5)
s s , x s x , m x
, j j
j a
A a M
A
q = M + , (1-6)
where, the q
i,mis written by the abundance of ith isotope in mixture, a
i,m, as q
i,m= (M
x/A
x+ M
s/A
s)a
i,m, M
xcan be expressed by,
x , m ,
m , s , s s x
x i i
i i
a a
a a A M A
M −
= − . (1-7)
Equation (1-7) is a fundamental equation for quantitation in IDMS. When, the ratio of abundance of ith isotope to that of jth is written as R
ij= a
i/a
j, Eq. (1-7) can be expressed by,
x , m
,
m , s
, x ,
s , s s x
x ij ij
ij ij
j j
R R
R R
a a A M A
M −
= − . (1-8)
Thereby, the unknown amount of analyte, M
x, can be calculated by the known amount of spike, the abundance of jth isotope in analyte and spike, and R
ijin the sample, the spike, and their mixture. This method requires only accurate measurement of R
ij, and has several advantages, i.e., the quantitative recovery of the analyte is not required; any calibration standards or curves are not necessary. However, the measurement of isotopic abundances, a
j,sand a
j,x, in spike and sample and correction of background signal are required.
1.4 Substoichiometric isotope dilution mass spectrometry
The substoichiometry was proposed by Suzuki in 1958 and has
been developed in the field of radio-chemical analysis [53, 54].
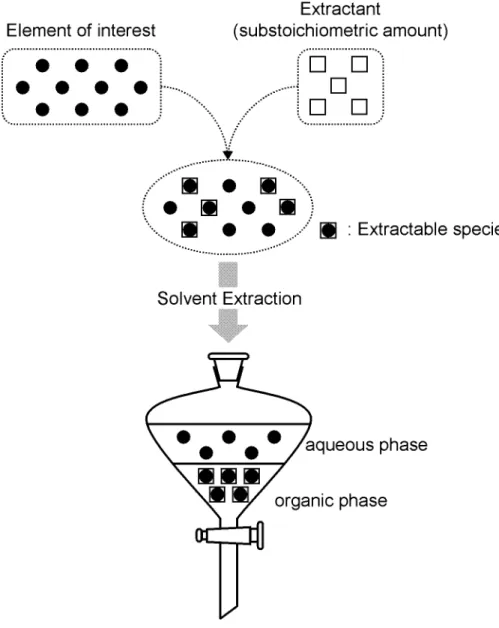
The substoichiometric separation is the method to achieve the separation of a constant amount of analyte by using a substoichiometric amount of reagent which reacts with the analyte stoichiometrically. The solvent extraction and precipitation are frequently used as the separation method, in particularly, substoichiometric separation using solvent extraction is often called substoichiometric extraction. An outline of the substoichiometric extraction is shown in Fig. 1-1.
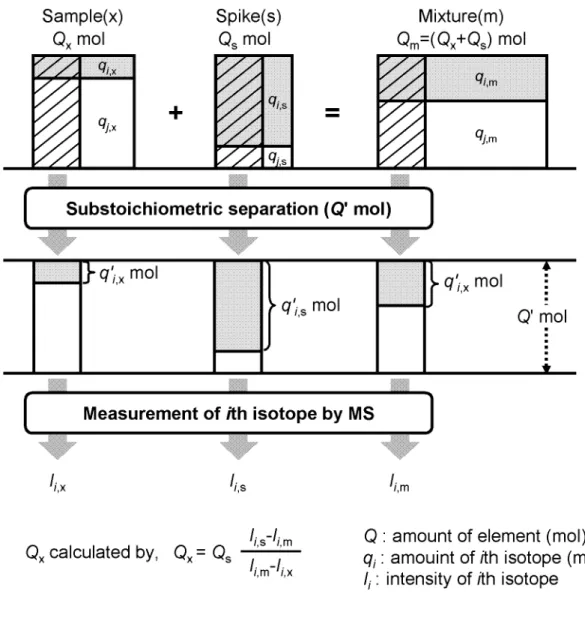
Substoichiometric isotope dilution mass spectrometry (SIDMS) is based on the stable isotope dilution determination by mass spectrometry and the substoichiometric separation of the analyte. Figure 1-2 shows an outline of the SIDMS. The quantitation is made by the following equation induced from Eqs. (1-1), (1-3), (1-5), and (1-7),
x x , m
m ,
m m , s
s , s x
Q q Q
q Q
q Q q Q
Q i i
i i
−
−
= , (1-9)
where, Q denotes moles of analyte. When a constant amount (Q' mol) of analyte is separated from the sample, spike, and mixture, the amount of ith isotope separated, q'
i,x, q'
i,s, and q'
i,mrespectively, can be expressed by,
' ' , x
x x ,
Q q Q
q i i
= (1-10)
' ' , s
s s ,
Q q Q
q i i
= (1-11)
Fig. 1-1. Concept of substoichiometric extraction.
Fig. 1-2. Principle of substoichiometric isotope dilution mass spectrometry.
' ' , m
m m ,
Q q Q
q i i
= . (1-12)
Equation (1-9) is rewritten by putting Eqs. (1-10), (1-11), and (1-12) in it and a fundamental quantitation equation in SIDMS is given by,
x , m ,
m , s , x
, m i,
m , s
, s
x ' '
' ' '
'
' '
' ' '
i i
i i i
i i
q q
q Qs q
Q q Q
q Q
q Q q Q
Q −
= −
−
−
= . (1-13)
Therefore, the unknown amount of analyte in sample, Q
x, can be calculated by measuring the amount of ith isotope in each portion substoichiometrically separated from the sample, spike, and mixture. When the signal intensity for ith isotope, I
i, obtained in the isotope measurement is related to moles of ith isotope,
x , x , x
' i , k i I i
q = (1-14)
s , s , s
' i , k i I i
q = (1-15)
m , m , m
' i , k i I i
q = , (1-16)
where k
idenotes the sensitivity constant for the ith isotope in the isotope measurement. Therefore, the quantitation equation can be simply written as follows,
x , m ,
m , s s ,
x i i
i i
I I
I Q I
Q −
= − (1-17)
Consequently, the amount of analyte in sample can be determined by only measuring the intensity of ith isotope.
1.5 Solvent extraction of boric acid
Solvent extraction is the method based on the distribution of a solute of interest between two immiscible liquid phases which consist of water and organic solvent, and is called the liquid-liquid distribution. This method is widely used for not only analytical chemistry but industrial separation and purification such as nuclear fuel processing and hydrometallurgy.
In the solvent extraction of boric acid, anionic complexes of boron
formed with various complexing agents are extracted into the organic phase
with organic cations. Boron has high affinity to F
-, so BF
4-is readily
formed by adding F
-to the solution containing boric acid at pH lowers than
4. BF
4-is hydrophilic, but a strong water-structure breaker, therefore it can
be easily extracted with a proper hydrophobic cation such as
tris(1,10-fenanthroline)cadmium(II), ferroin, quaternary ammonium,
alkaline metal-crownether, victoria blue 4R, dimethylindocarbocyanin dye,
and astra phloxine [55-62]. On the other hand, it is well known that boric
acid tends to react with hydroxy groups to form neutral esters or anionic
complexes. When hydrophobic diol compounds are used as reagents, the
anionic borate complex formed is hydrophobic and can be readily extracted
into hexane, toluene, 1,2-dichloroethane, trichloromethane, nitrobenzene,
etc.
1.6 The aim of study
Boron is an essential trace element in plant and is widely used in various fields. However, excess boron is toxic for not only plant but also mankind and wildlife. Therefore, a simple and accurately determination method for boron is required.
Various analytical methods for the determination of boron have been used. Since these methods are based on the comparative method with the aid of calibration standards or calibration curves, they cannot escape from matrix effect caused by sample matrices.
In recently, isotope dilution analysis has been applied to boron.
Boron has two stable isotopes,
10B and
11B, which are easily fractionated by variety of natural and artificial processes, therefore, the isotopic abundance of boron in particular sample has to be accurately determined prior to the quantification of boron.
The aim of this study is development of the substoichiometric isotope dilution mass spectrometry of boron based on the ion-pair extraction with novel salicyl alcohol derivatives and organic cations.
For the solvent extraction of boric acid, salicyl-alcohol moiety is selected as basic structure of extractant, and novel halogenated salicyl alcohol derivatives are synthesized. The distribution constant and the acid-dissociation constant of the salicyl alcohols are spectrophotometrically determined to clarify the property of the extractants. To evaluate the effect of solvents and organic cations on the extraction of boric acid, the extraction equilibrium of boric acid is investigated in detail. The extraction constants are determined to calculate the substoichiometric extraction curves.
The substoichiometric extraction for boric acid with
H
2sal-TOMACl and H
2I
2sal-TOMACl systems are studied to obtain the
optimum conditions and evaluate the reproducibility. To verify the validity
of the present SIDMS, quantitation of boron in the reference material are
performed, and the value determined is compared with the certified value.
Chapter 2.
Synthesis and liquid-liquid distribution properties of salicyl
alcohol derivatives
2.1 Introduction
Solvent extraction of metal ions with chelating agents has been widely studied. It has been elucidated that the hydrophobicity and the acidity of reagents are important factors affecting the extractability of metal ions in chelate systems. In contrast, the systematic and fundamental study for the extraction of boric acid has not been performed.
The solvent extraction of boric acid using aliphatic and/or aromatic diol compounds in various solvents is investigated, but only a few reports have dealt with the extraction equilibrium of boric acid [11, 63]. In particularly, 3-chloro-5-(1,1,3,3-tetramethylbutyl)salicyl alcohol (CTMP) has been industrially used for a removal of boron from alkaline brine.
However, the extraction equilibrium has been not clarified [64-67].
In this study, salicyl alcohol is selected as a mother compound of the extractant because CTMP shows good extractability. To investigate the effect of acidity and hydrophobicity of the extractant on the extraction of boric acid, novel salicyl alcohol derivatives having halogen substituents were synthesized, and their distribution constant and acid-dissociation constant were determined.
The formation of hydrogen-bonded complex of each salicyl alcohol derivative with quaternary ammonium salts in the organic phase was revealed. The association constants in chlorobenzene were determined and used for the calculation of the equilibrium concentration of free salicyl alcohols and free TOMACl.
2.2 Experimental
2.2.1 Reagents
Salicyl aldehyde (GR) was obtained from Wako Chemical. Iodine (GR) and bromine (GR) was purchased from Nacalai Tesque. Sodium tetrahydroborate (EP) and dimethyl sulfoxide-d
6(99.8+ atom %D) were purchased from Kanto Chemical. Chlorobenzene (GR, Sigma-Aldrich Japan) was used as obtained in distribution experiments or dried by molecular sieves (3A 1/8, Wako Chemical) in FT-IR measurement. Salicyl alcohol (H
2sal) (99 % purity), tetraoctylammonium bromide (Oct
4NBr) (>
98 % purity), trioctylamine (TOA) (99.7 % purity) and trioctylmethylammonium chloride (TOMACl) (Aliquat336) were purchased from Sigma-Aldrich Japan. Tetrahexylammonium bromide (Hex
4NBr) (99 % purity) was purchased from Acros Organics. Other chemicals used were of analytical or guaranteed reagent grade. High purity deionized water (18.2 MΩ) processed by a Milli-Q system (Milli-pore) was used throughout this work.
2.2.2 Apparatus
A mechanical shaker (TAITEC SR-2s) was used at 300 strokes/min.
A pH meter (Horiba model F-52) equipped with a combination glass
electrode (Horiba 9611-10D) was calibrated by the pH standard solutions
of oxalate, phthalate, phosphate, tetraborate, and calcium hydroxide. NMR
spectrum was recorded by JEOL ECS-400. A UV/Vis spectrophotometer
(JASCO V-630) was used for the measurement of absorption spectrum of
salicyl alcohol derivatives. An FT-IR spectrophotometer (JASCO
FT/IR-4200) equipped with a liquid cell (CaF
2windows, path length 1
mm) was used for the measurement of absorption spectrum of salicyl
alcohol derivatives in the presence of ion-pair reagent such as TOMACl, Oct
4NBr, and TOA.
2.2.3 Synthesis of 5-bromosalicyl alcohol
The synthesis of 5-bromosalicyl alcohol (H
2Brsal) was referred to the synthesis of 4-bromo-2-methylphenol [68], and summarized in Scheme 2-1. A solution of salicyl alcohol (3.0g, 23 mmol) in 95:5 dichloroethane:methanol (100 ml) was cooled on ice for 30 min. Br
2(1.0 ml, 19 mmol) in dichloromethane (80 ml) was added dropwise to the solution and stirred for 2 h at 0 °C. The resulting solution was washed with water until the aqueous phase pH becomes around neutrality, and then evaporated. The solid obtained was purified by recrystallization from ethyl acetate/hexane to give a white solid (1.0 g, 4.9 mmol, 26 % yield).
1H NMR (DMSO-d
6) δ = 4.45 (d, 2H), 5.13 (t, 1H), 6.72 (d, 1H), 7.19 (dd, 1H), 7.39 (d, 1H), and 9.71 (s, 1H).
2.2.4 Synthesis of 3,5-dibromosalicyl alcohol
The synthesis of 3,5-dibromosalicyl alcohol (H
2Br
2sal) was referred
to the synthesis of dibromosalicyl aldehyde [69] and reduction of salicyl
aldehyde [70]. A solution of salicyl aldehyde (15 ml, 150 mmol) in ethanol
was cooled on ice for 30 min. Br
2(20 ml, 400 mmol) was added dropwise
to the solution and stirred overnight at room temperature. After the solution
was poured into water, a solid product (dibromosalicyl aldehyde) was
filtered, purified by recrystallization from ethanol/water, dissolved in
tetrahydrofuran, and cooled on ice for 30 min. To the resulting solution,
NaBH (12 g) was slowly added and stirred overnight at room
Scheme 2-1. Synthesis of H
2X
nsal.
temperature. This solution was made acid (pH 1) with 6 M HCl and shaken with dichloromethane three times. The organic phase was washed with 1 M HCl and water, and then evaporated to dryness. The solid obtained was purified by recrystallization from ethyl acetate/hexane to give a white needlelike crystal (9.2 g, 32 mmol, 22 % yield).
1H NMR (DMSO-d
6) δ = 4.54 (s, 2H), 5.47 (br, 1H), 7.42 (d, 1H), 7.59 (d, 1H), and 9.47 (br, 1H).
2.2.5 Synthesis of 3,5-diiodosalicyl alcohol
The synthesis of 3,5-diiodosalicyl alcohol (H
2I
2sal) was referred to the synthesis of diiodosalicyl aldehyde [71], and reduction of salicyl aldehyde [70]. Acetic acid (12 ml) and phosphoric acid (12 ml) were added to a solution of salicyl aldehyde (5 ml, 50 mmol) in ethanol (12 ml). Then KIO
3(5.35 g, 25 mmol) and I
2(12.7 g, 50 mmol) were added to the solution and stirred overnight at 70 °C. After the reaction mixture was poured into a 10 % KI solution, a solid product (diiodosalicyl aldehyde) was filtered, washed with water, and reduced in a manner similar to that for dibromosalicyl aldehyde to give a pale yellow solid (4.5 g, 12 mmol, 24 % yield).
1H NMR (DMSO-d
6) δ = 4.51 (s, 2H), 5.49 (br, 1H), 7.55 (d, 1H), 7.86 (d, 1H), and 9.41 (br, 1H).
2.2.6 Determination of acid-dissociation constant
Acid dissociation constant of salicyl alcohol derivatives was
determined as follows: an aliquot of an aqueous solution containing
(2.0-5.0) × 10
-4M H
2X
nsal, 1.0 × 10
-1M NaCl, 1.0 × 10
-2M buffer
(chloroacetic acid, acetic acid, 2-(N-morpholino)ethanesulfonic acid (MES),
3-(N-morpholino)propanesulfonic acid (MOPS), or
2-(cyclohexylamino)ethanesulfonic acid (CHES)), and an appropriate amount of NaOH or HCl for pH adjust was prepared, and the UV/Vis absorption spectrum was measured.
2.2.7 Determination of distribution constant
An aliquot of an aqueous solution containing 1.0 × 10
-3M salicyl alcohol derivatives, 1.0 × 10
-1M NaCl, and 1.0 × 10
-2M pH buffer was shaken for 1 h with chlorobenzene at 25 ± 1 °C. After the two phases were separated by centrifugation, pH in the aqueous phase was determined. An aliquot of the aqueous phase was diluted with 0.1 M HCl, and then absorbance of the solution was measured at maximum absorption wavelength for each derivative. Salicyl alcohol derivatives in the organic phase were determined in the same manner after back-extraction with 0.1 M NaOH solution containing 0.1 M NaClO
4. The distribution ratio (D
R) of each salicyl alcohol derivative was calculated from the concentrations in both phases.
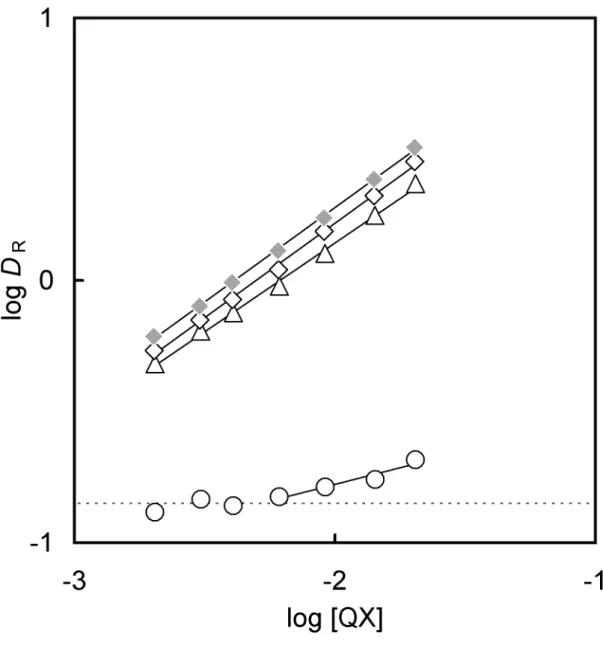
2.2.8 Determination of association constant
Association constant of salicyl alcohol derivatives with ion-pair reagents in chlorobenzene was determined as follows: a chlorobenzene solution containing 1.0 × 10
-2M H
2X
nsal and (0-4.0) × 10
-2M TOMACl, Oct
4NBr, or TOA was prepared, and the FT-IR absorption spectrum was measured.
2.3 Results and discussion
2.3.1 Acid-dissociation equilibrium of the salicyl alcohol derivatives
Salicyl alcohols have a phenolic -OH group. Therefore, the acid-dissociation equilibrium of H
2X
nsal can be written as follows,
+
−
+
← → HX sal H sal
X
H
2 n n(2-1)
sal]
X [H
] [H ] sal [HX
n 2 a n
+
=
−K , (2-2)
where K
adenotes the acid-dissociation constant. To confirm this equilibrium and to determine the acid dissociation constant, absorption spectra of H
2X
nsal in the aqueous solution containing 1.0 × 10
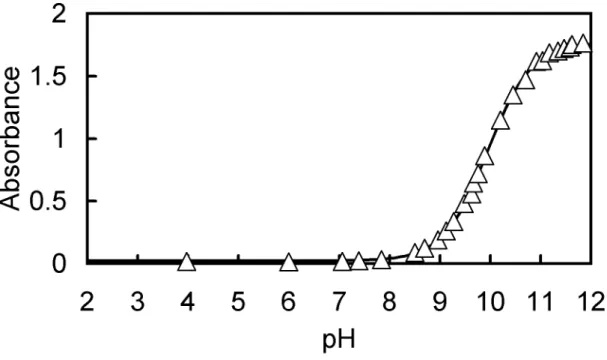
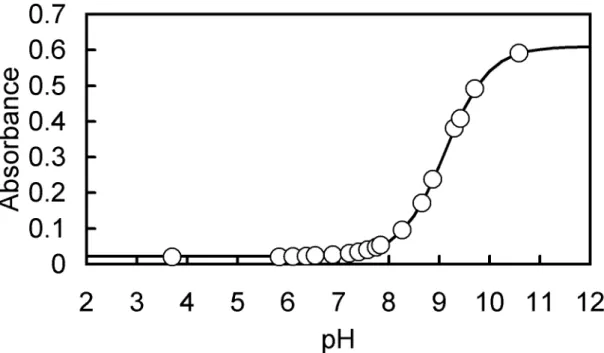
-1M NaCl were measured at varying pH. The spectra obtained are shown in Fig.
2-1(a-d). In all H
2X
nsal, the isosbestic points are observed as expected from Eq. (2-1). Maximum absorption wavelengths and molar absorptivities were calculated, and summarized in Table 2-1. The relationship between absorbance of the solution and pH can be expressed as follows:
l ε
l
ε [H X sal] [HX sal ] Absorbance H X sal 2 n HX sal n
n n 2
−
−
+
= (2-3)
l K C
K ε
ε
] /[H 1
] /[H
a sal a sal HX
X
H2 n n
+
+
+
= +
−, (2-4)
where ε, l, and C denote the molar absorptivity, the path length, and the
Fig. 2-1(a). Absorption spectra of 5.0 × 10
-4M H
2sal in the aqueous
solution containing 1.0 × 10
-1M NaCl at different pH (3.97, 6.00, 7.06,
7.39, 7.84, 8.50, 8.70, 8.96, 9.12, 9.28, 9.48, 9.63, 9.67, 9.76, 9.89, 10.20,
10.45, 10.70, 10.91, 11.04, 11.18, 11.34, 11.47, 11.59, 11.63, 11.85).
Fig. 2-1(b). Absorption spectra of 2.0 × 10
-4M H
2Brsal in the aqueous
solution containing 1.0 × 10
-1M NaCl at different pH (3.70, 5.83, 6.10,
6.36, 6.54, 6.89, 7.22, 7.40, 7.59, 7.75, 7.84, 8.27, 8.66, 8.87, 9.31, 9.42,
9.71, 10.59).
Fig. 2-1(c). Absorption spectra of 2.6 × 10
-4M H
2Br
2sal in the aqueous
solution containing 1.0 × 10
-1M NaCl at different pH (4.02, 6.06, 6.46,
6.59, 7.07, 7.44, 7.64, 7.87, 8.49, 8.68, 9.15, 9.32, 9.59, 10.16, 11.26,
11.61).
Fig. 2-1(d). Absorption spectra of 2.3 × 10
-4M H
2Br
2sal in the aqueous
solutions containing 1.0 × 10
-1M NaCl at different pH (4.12, 6.08, 6.57,
6.59, 7.12, 7.45, 7.75, 8.03, 9.11, 9.19, 9.33, 9.49, 10.13, 10.90, 11.33,
11.62).
Table 2-1. The maximum absorption wavelength (λ
max), molar absorptivity (ε), and acid-dissociation constant of salicyl alcohols (K
a)
Reagent Neutral form Anionic form
pK
a± σ λ
max(nm) ε (M
-1cm
-1)
aλ
max(nm) ε (M
-1cm
-1)
aH
2sal 273 1.9 × 10
3292 3.6 × 10
39.94 ± 0.04
H
2Brsal 283 1.8 × 10
3302 3.0 × 10
39.12 ± 0.03
H
2Br
2sal 288 2.2 × 10
3310 4.3 × 10
37.39 ± 0.06 H
2I
2sal 290 2.1 × 10
3310 4.4 × 10
37.27 ± 0.04
a
Calculated from the plateau region of absorbance at lower and higher pH.
total concentration of the solute. The subscripts H
2X
nsal and HX
nsal
-denote the corresponding species. The acid-dissociation constants were obtained by a nonlinear least-squares fitting method from the data of absorbance (at 292, 302, 310, and 310 nm for H
2sal, H
2Brsal, H
2Br
2sal, and H
2I
2sal, respectively) versus pH in Fig. 2-2(a-d). The results are summarized in Table 2-1. The halogenation on H
2sal leads to the increase in the K
avalue, which is ascribed to the electron withdrawing effect of halogen groups [72].
2.3.2 Distribution of the salicyl alcohol derivatives
The distribution ratio of salicyl alcohol derivatives (D
R) between the chlorobenzene and the aqueous phase was investigated as a function of the aqueous phase pH to determine the equilibrium constants for salicyl alcohols. Fig. 2-3 shows the plots of log D
R- pH in the four kinds of salicyl alcohols. Since typical distribution curves of monoprotic week acid are obtained for every alcohol, the distribution ratio can be written as follows;
] sal [HX sal]
X [H
sal]
X [H
n n
2
org n
R = 2 + −
D (2-5)
] /[H 1 + a +
= K
K D , (2-6)
where K
Dstands for the distribution constant (K
D=
[H
2X
nsal]
org/[H
2X
nsal]), and subscript "org" denotes the organic phase. The
acid-dissociation constant and the distribution constant were calculated
using a nonlinear least-squares fitting method for the plots of log D versus
pH. As shown in Table 2-2, the pK
avalues obtained are in good agreement
with those
Fig. 2-2(a). Absorbance of 5.0 × 10
-4M H
2sal in the aqueous solution
containing 1.0 × 10
-1M NaCl at 292 nm as a function of pH. The solid
curve was given by a non-linear least squares fitting method.
Fig. 2-2(b). Absorbance of 2.0 × 10
-4M H
2Brsal in the aqueous solution
containing 1.0 × 10
-1M NaCl at 302 nm as a function of pH. The solid
curve was given by a non-linear least squares fitting method.
Fig. 2-2(c). Absorbance of 2.6 × 10
-4M H
2Br
2sal in the aqueous solution
containing 1.0 × 10
-1M NaCl at 310 nm as a function of pH. The solid
curve was given by a non-linear least squares fitting method.
Fig. 2-2(d). Absorbance of 2.3 × 10
-4M H
2I
2sal in the aqueous solution
containing 1.0 × 10
-1M NaCl at 310 nm as a function of pH. The solid
curve was given by a non-linear least squares fitting method.
Fig. 2-3. Relationship between log D
Rof H
2X
nsal and the aqueous phase pH. The initial reagent concentration in the aqueous phase was 1.0 × 10
-3M.
The solid curves were obtained by a non-linear least squares fitting method.
(Δ) H
2sal; (○) H
2Brsal; (●) H
2Br
2sal; (♦) H
2I
2sal.
Table 2-2. The distribution constant (K
D) and the acid- dissociation constant (K
a) of salicyl alcohols at 25 °C
Reagent log K
D± σ pK
a± σ pK
aaH
2sal -0.85 ± 0.01 9.87 ± 0.04 9.94 H
2Brsal 0.09 ± 0.04 9.17 ± 0.06 9.12 H
2Br
2sal 1.57 ± 0.05 7.31 ± 0.09 7.39 H
2I
2sal 2.46 ± 0.04 7.27 ± 0.06 7.27
a